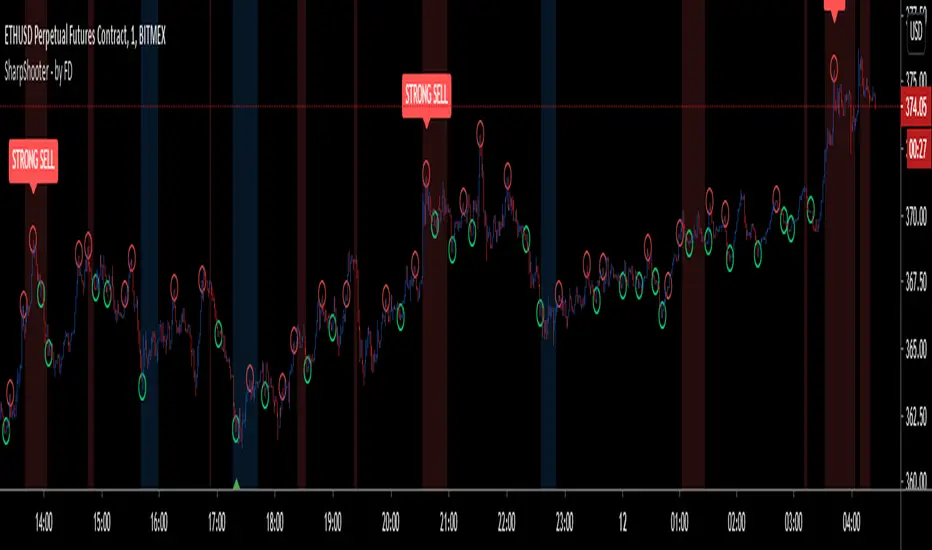
Sharp Shooter - by FiatDropoutThis is an experimental script and is intended to be used only on LTF charts for scalping. It may or may not be useful on other charts and time frame, but that is subject to back testing.
Now, coming back to this script. It has multiple features yet i tried to keep it as clean in representation as possible.
As obvious, few things are easily recognizable on chart, such as:
BUY - Go LONG
STRONG BUY - Heavy Uptrend is expected, Go LONG
SELL - Go SHORT
STRONG SHORT - Heavy Downtrend is expected, Go SHORT.
on addition to above signals, there are few other plot-shapes, which are:
Red Circle - Acts as TP for LONG during uptrend and acts as Add-On SHORT during downtrend
Green Circle - Acts as TP for SHORT during downtrend and acts as Add-on LONG during uptrend.
Red Background - Bearish Peak, potential start of downtrend
Blue Background - Bullish Peak, potential start of uptrend
------------------------------------------------------------------------------------------------------------------------------------------------------------------------------------
Now that plots are over, lets go to how to use them. As name of this script suggests, it intends to find most optimal entry and exit for long and short while taking profit on the way and adding to the position until trend changes.
Be aware that trend here is very much based on current time-frame and does not represent other time-frame's bias. Also, trend here is intended to be used as a scalp trend and not a swing trend.
Now once, you get a signal for BUY(example), then wait for "Bullish Peak"(blue background) to appear with either "STRONG BUY" or just "BUY" and take an entry at respective price, next look for "red circle" which acts as TP for long(refer sec, above) and either move stop to entry, or take partial profits or close position entirely.
Now every subsequent "green circle" will act as add-on for long and every "red circle" will act as TP for long, until "Bearish Peak" appears, which will reverse the order of how circles are used and direction of the trade. Now during "Bearish Peak" and until "Bullish Peak" appears, "red circle" will act as add-on for short and "green circle" will act as TP for short.
It might take some time to adjust to the plots, but i have decided to keep it that way in order to keep chart clean of too many signals.
------------------------------------------------------------------------------------------------------------------------------------------------------------------------------------
NOTE : Please use stops and be sure to place orders quickly as prices move faster on minute charts and you should be able to place orders and stop right away, so if you are new to trading and are currently in early stage of the business, scalping is strongly not advised, let alone this indicator. Also, past performance are not guarantee of future results and most importantly, this indicator does not repaint. By using this indicator, you accept that i am not responsible for any losses or gains made by user by trading with help of this bot.
Also, in next update, i will fix some bug, add some SS and also add alerts. Alerts are not being added currently because of high volatile nature of the bot signals which if tried on automation can give varied results. Once everything is set, i shall add alerts.
for any other queries, feel free to get back here on chat or DM.
ETHUSD
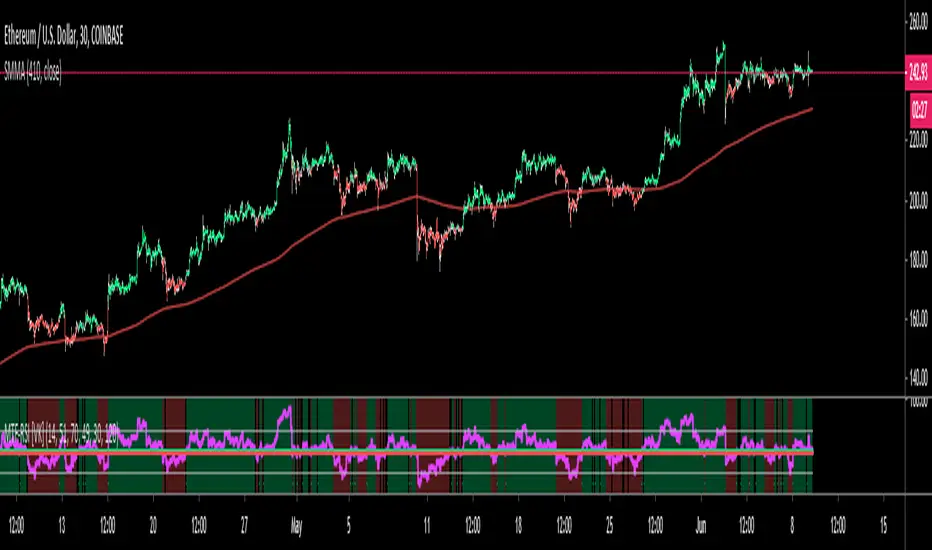
MACD Trend [VK]This strategy shows the trend using MACD
Use higher TF for better view
Combine MTF -RSI for entry points and use both indicators together to better understand the trend
THANK YOU

KINSKI RSI Short/LongExtends the display of the Relative Strength Index (RSI) by shorts and longs from Bitmex and shows them as a diagram.
How to interpret the display?
- blue line is the default Relative Strength Index
- red line means "oversold
- green line "overbought"
- grey dotted line up/down indicates the optimal range for up and down movements 30 to 70
- in general, the reaching or crossing of the thresholds in the direction of the mid-range is seen as a possible buy or sell signal
- RSI values (blue line) of over 70 percent are considered "overbought", values below 30 percent "oversold
Which settings can be made?
- Selection for the "Currency". Default value is "BTCUSD". Currently only the following currencies are supported "BTCUSD", "ETHUSD", "ETCUSD", "OMGUSD", "XLMUSD", "XTZUSD".
- Selection for calculation formula ("Calculation"). The default value is "hlc3".
- Field for the moving average value ("RSI Length"). The default value is 14, but values of 7, 9 or 25 are also common. The shorter the period under consideration, the more volatile the indicator is, but with longer periods, fewer signals are triggered.
- furthermore you can make layout adjustments via the "Style" menu

MTF-RSI+Candles [VK]This is the strategy where we buy when RSI is above 51 line and sell below 49 line
Ability to change RSI TF
Ability to change default value of RSI/upline/lowline/oversold/overbought lines
Ability to switch show/hide backgrount color
Ability to switch on/off candle colors when RSI crosses up/upline down/lowline
Ability to plot B/S signals when RSI crosses up/upline down/lowline
alerts added
can also be used as standard RSI
MA Pull [VK] - alert version of vkscalperThis is the alert version of vkscalper
you will need to change the settings for different TF also try changing MA types
Ability to choose MA types
Ability to plot stop loss / take profit lines
simply select buy alert or sell alert for alerts

Simple EMA trend indicatorSimple EMA trend indicator , pretty straightforward green equates to bullish and usually a retest/wick is often seen , same for the flipside viceversa


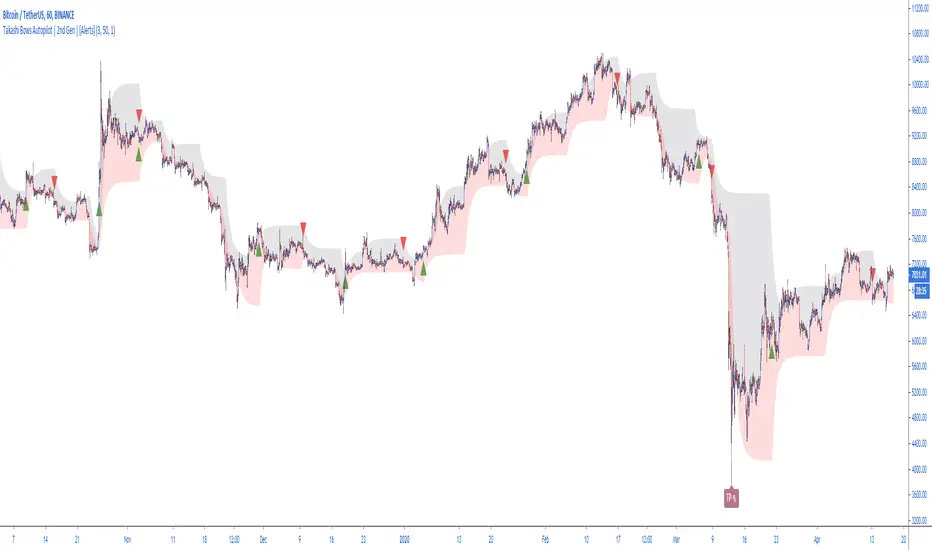
Takashi Bows Autopilot | 2nd Gen | [Alerts]Our state-of-the-art trend confirmation indicator is now combined with automatic threshold selection.
Takashi Bows Autopilot is the ultimate trading tool. Effortless, its signals put traders inside strong trends, locking big profits that cover all loss generated during sideways trends.
An upgrade version of Takashi Bows v1, this script is the result of some operations developed by us, it can easily adapt to different markets and time frames. Now ranging from level 1 to 20, traders can select the amount of signals to be displayed on the chart. Based on price movement, it signals entries after strong movement up or down.
Take Profit included. If a position is opened in one direction, it should be closed at take profit levels or when a position in the opposite direction is opened.
Inputs
Level
Integer input. Sets a level for signals generated up and down. The higher the level, more signals on chart, and vice-versa.
Take Profit %
Float input. Sets a percent of take profit for exiting previous open position.
Rule
Float input. Sets a ruler for more accuracy on less volatile markets. Standard value 1 for high volatile markets, higher values for low volatile markets.
See Bows
Bool input. If true, Bows lines can be seen on chart.
To get access to this and other scripts check links below.
Super AlgorithmIf you make a loss, I am not responsible for it. Please use this with caution that includes proper risk and money management.
When I see a sell signal, I may short &/or close my long.
When I see a buy signal, I may long &/or close my short.
The signal is most relevant for the exact time it comes on the chart. When the bar closes, it does not repaint.
The signal can show up and disappear on a running bar. It DOES NOT repaint once the bar is closed.
Do realize that on bar close, the price may have moved significantly, and the signal may not be relevant anymore. So, it needs to be used with caution whether one uses this as soon as a signal appears or on bar close. This is not suitable for the highly large timeframe (ake over 1day). I use it on 1 day and monthly on the lower timeframe.
My primary motivation for building this was three -
1) To ensure I am not addicted and not looking at the chart 24/7
2) To ensure I do not spend a lot of time & resources on multiple indicators
3) I have a consistent profit that can help me in my poor living expenses.
4) Recently, during the huge drawdown, I noticed that my other indicator () was unable to act as quickly as needed as the volatility happened in the lower timeframe. It made me realize that I need to do something to protect my capital in the future. Hence, the idea for this indicator.
5) I use this indicator alongside my other indicators that are showing the chart as well.
In the chart above, I am using
*
*
*
*
* And this indicator
You do not need to use all of these indicators. I have them always on my chart as I showed above.
The buy and sell shown with a blue background is the one coming from this indicator. The only thing that one can customize is colour.
This indicator differs significantly from my other indicators. This indicator prints less signal as careful work went in to reduce noise as much as possible and is to be used for 1 day or less tf.
I use it alongside other indicators for confirmation bias. The other indicators I use are the ones that come from me as well as shown on the chart.
This can possibly be used for other instruments. As I only use it for trading BTCUSD, I have crudely tested for BTCUSD after the dump and has been doing ok so far.
The code is written in Version 4 of pine script. If there are bugs, please let me know.
For info on gaining access see the ⬇ link below ⬇ in our signature field & direct message me. I have a busy schedule at my own workplace. Trading is my hobby. Hence, please be kind to me if I am late in replying

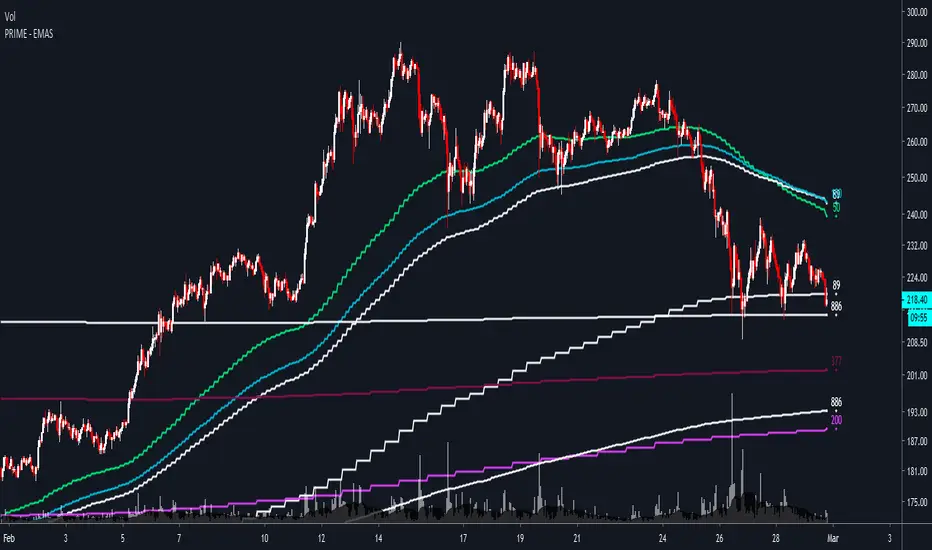
PRIME - EMAS - ETHUSD
PRIME - EMAS - ETHUSD is an indicator that allows you to see some of the best hourly, daily, weekly and monthly EMAs/SMAs for trading ETHUSD .
These are timeframe-fixed EMAs/SMAs, which means that they will provide you with the same data in all timeframes, unlike most EMAs/SMAs indicators out there.
You also have the option to show them in full or a simplified version of them to declutter your chart.
For access and questions, please message me here on TradingView. I will be happy to help!
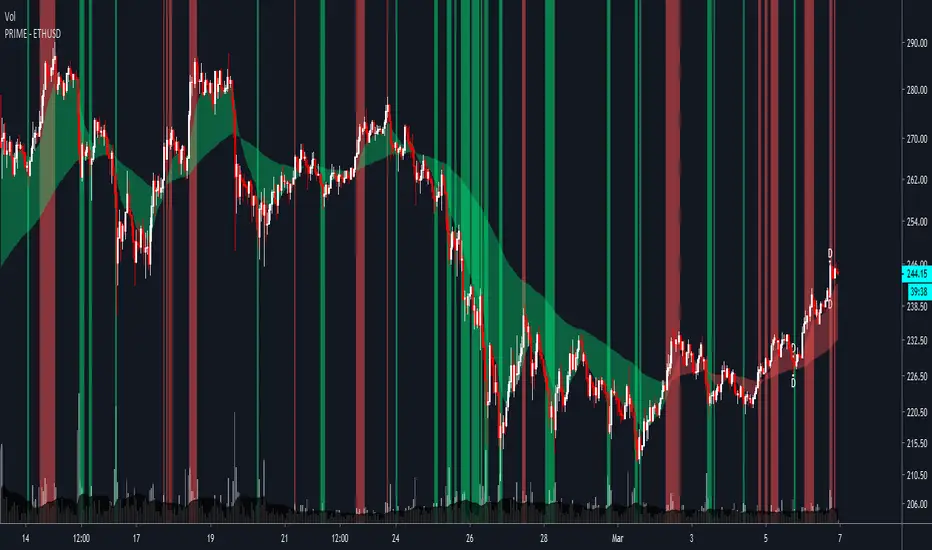
PRIME - ETHUSD - BYBITPRIME is a hyper-focused indicator made for a specific asset and timeframes. The goal of the indicator is to help you simplify and optimize your trading.
As of writing this, the indicator is optimized for the 1H and 4H timeframes.
The indicator will provide you with:
Potential buy and sell zones (the green and red vertical lines/flashes).
The trend of the market, with the cloud as support/resistance.
And the daily, weekly and monthly closes (as D, W and M).
In addition to these, the indicator also comes with the following alerts:
BUY ZONE
SELL ZONE
STOPPED FLASHING
CLOUD TOP X
CLOUD BOTTOM X
These alerts will allow you to know when some of the best opportunities in the market might be present.
This specific version of the indicator is for ETHUSD . However, I can adjust it to your favorite asset.
For access, questions, and full documentation, please message me here on TradingView.
Ace Pro Short Indicator - 1 Minute ETHUSD Ethereum ChartThe Ace Pro Short - 1 Minute ETHUSD calculates overbought and oversold conditions.
It focuses on momentum to identify whether the market is overbought or oversold.
If it detects that the market is overbought, it gives an alert of “Short Entry”
If it detects that the market is oversold, it gives an alert of “Short Exit"
Users are also able to set notifications on Tradingview with this version of the indicator.
To set an alert, after adding the indicator, at the top left of the chart where the indicator is listed, click on the "more" option (three dots), and then select "Add alert."
PLEASE NOTE THE FOLLOWING:
THE ACE PRO SHORT - 1 MINUTE ETHUSD INDICATOR IS DESIGNED ONLY FOR USE ON THE 1 MINUTE BITSTAMP ETHUSD CHART.
It is only to be used for opening and closing short positions.
It is not recommended for use with long positions.
It is not recommended for use with time frames other than the 1 minute.
In a sideways market, or during a violent move, it is likely to produce false signals.
Traders must use confluence from their technical analysis to enter trades.
Traders must use confluence from their technical analysis to enter trades.
The Ace Pro Short ETHUSD 1 minute has been designed to prioritize successful trades over number of trades.

TRADER DREAMSThis indicator based macd,rsi,stochastic based. But it includes my own secret values. Comes with Machine learning technology and zero lag option. Next generation of technical analysis.
Also you can look my other scripts
this is symbol scanner
this is wolfe and scalping indicator
this is trending trend based kst indicator
this is also can harmonic formation and trend analysis automatic and shows you target
this is the best for trading
and others....
I'm publishing this indicator for a while. Good luck.

BITMEX Bybit binance HUOBI OKCOIN BTC DMI ATR DPO TREND AlertBITMEX Bybit binance HUOBI OKCOIN BTC DMI ATR DPO TREND Alert
This is a very effective trend strategy.
Strategy principle
HOW TO USE
set long position when a green arrow appears in the chart.
set short position when a red arrow appears in the chart.
For the long position and the short direction, you can set the stop profit & stop loss or trailing profit stop & trailing stop loss respectively.
When a purple arrow appears to close a position, an aggressive trader can go in the opposite direction when it is purple.
Strategy applicability
The default setting is for bitmex perpetual swap contract XBTUSD , bybit BTCUSD perpetual futures contract ,binance btcusdt Spot,Bitfinex BTCUSD Spot,bitflyer BTCJPY Spot,bithumb BTCKRW Spot,bitso BTCMXN Spot, bitstamp BTCUSD Spot,bittrex BTCUSDT Spot,Coinbase BTCUSD spot, deribit BTCPERP perpetual futures contract,gemini BTCUSD Spot,Hitbit BTCUSDT Spot,huobi BTCUSDT Spot KRAKEN XBTUSD spot,OKCOIN OKEX BTCUSD3M BTCUSD BTCUSD2W,Poloniex BTCUSDT Spot etc btc symbol with 30 minutes timeframe.
This indicator has broad applicability and can be applied to multiple different symbols.
This indicator also applies to the ETHUSD symbol etc, just adjust the default configuration.
Using the alert of the indicator, it can work well on the trading robot like Gunbot,autoview, without repaint false signals.
这是非常有效的趋势策略。
如何使用
在图表中出现绿色箭头就做多。
在图表中出现红色箭头就做空。
对于多头头寸和空头方向,您可以分别设置止损和止损或尾随利润止损和尾随止损;当出现紫色箭头时平仓,激进的交易者,可以在紫色时就做反方向。
策略适用性
默认设置是针对bitmex交易所 XBTUSD永久掉期合约,BYBIT交易所 BTCUSD永续期货合约,binance币安交易所 btcusdt现货,Bitfinex交易所 BTCUSD现货,bitflyer交易所 BTCJPY现货,bithumb交易所 BTCKRW现货,bitso交易所 BTCMXN现货,bitstamp交易所 BTCUSD现货,bittrex交易所 BTCUSDT现货,Coinbase交易所 BTCUSD现货,deribit交易所 BTCPERP永续期货合约,gemini双子星交易所 BTCUSD现货,Hitbit交易所 BTCUSDT现货,huobi火币交易所 BTCUSDT现货,KRAKEN交易所 XBTUSD现货,OKCOIN OKEX交易所 BTCUSD3M OK BTC季度合约 BTCUSD BTCUSD2W OK BTC次周合约,Poloniex BTCUSDT现货等2小时区间的btc交易。
Bitmex XBTUSD 30分钟 比特币期货 30 minutes Futures
这个指标具有广泛的适用性,可以适用多个不同交易品种。
该指标还适用于ETHUSD,ETHBTC,ADABTC,TRXBTC,XRPBTC交易品种等,只需调整默认配置即可。
Bitmex ETHUSD 30分钟 以太币期货 30 minutes Futures
使用该指标的警报设置,它可以在自动交易机器人上很好地工作,而无重绘错误的信号。

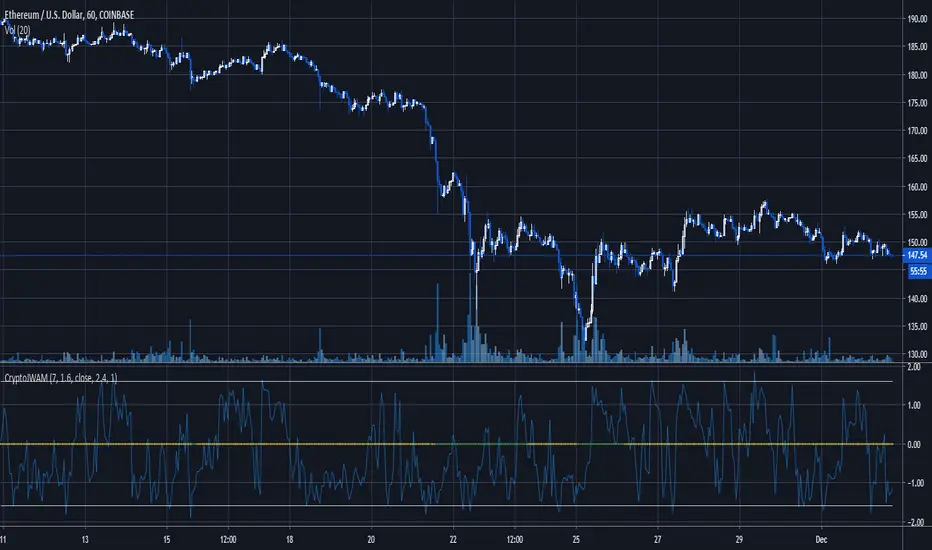
Pro CryptoSolver Indicator w Alerts [Jwammo12]This is a pro indicator for Crypto trading. It includes entry and exit alerts for both long and short trades.
The strategy version can be viewed here: CrytoSolver Strategy
Message me for a free 7-day trial and for pricing for lifetime access.
OracleWhere to use?
Oracle gives the best performance on ETH/USD but also works for BTC/USD and some other charts like XAU/USD ( Gold ). Fails for almost all other cryptocurrencies.
Use 1d or 4h time frames only. 2h and 3h also work in some cases. Use Heikin Ashi candles for the best results.
The strategy is still being tested. Use at your own risk.
How to use?
Arrows start pointing upwards and candle closes above the Orange line - Price is likely to go up
Arrows start pointing downwards and candle closes below the Orange line - Price is likely to go down
Also, the orange line can be used as a mental stop loss point.

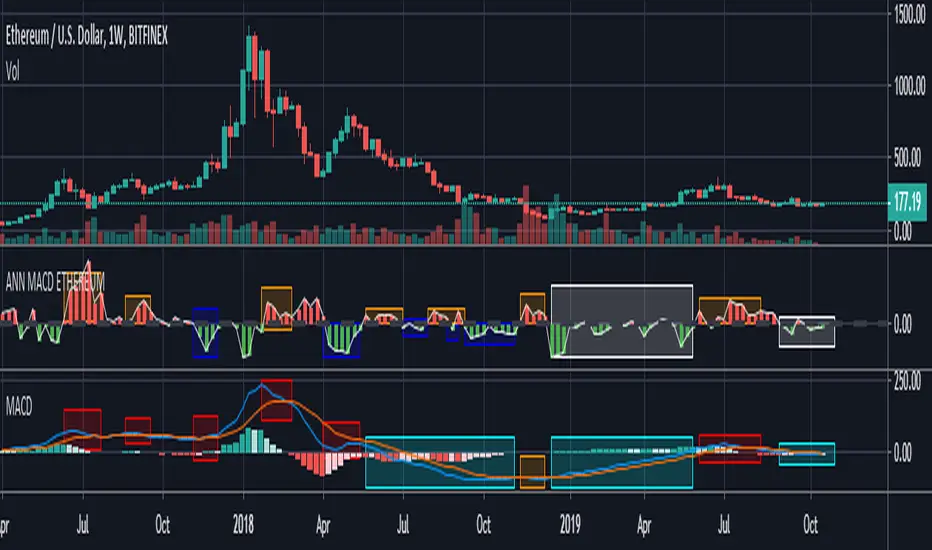
ANN MACD ETHEREUM
This script is trained with Ethereum (Timeframe : 4 hours ).
Details :
Input columns: 19
Output columns: 1
Excluded columns: 0
Training example rows: 300
Validating example rows: 0
Querying example rows: 0
Excluded example rows: 0
Duplicated example rows: 0
Input nodes connected: 19
Hidden layer 1 nodes: 8
Hidden layer 2 nodes: 1
Hidden layer 3 nodes: 0
Output nodes: 1
Learning rate: 0.7000
Momentum: 0.8000
Training error: 0.009378 ( That's a very good error coefficient. )
Many thanks to wroclai for help.
Deep learning series will continue!
Pivot Point Reversal + RSI AlertsThese are alerts for previously published strategy:
This strategy joins the Pivot Reversal strategy with the RSI indicator.
We check RSI level at the pivot point level and only if RSI condition is satisfied we update levels for stop orders.

Express XYZExpress XYZ allows you to set the parameters that best fit your needs.
You can select the range of candles you want the indicator to lock in on.
You can select if you want more or less signals to appear on the indicator to fit your trading style.
You can set alerts for buy/sell which is labeled as BULL (buy) and BEAR (sell).
Enjoy the experience to customize the Express XYZ to fit your needs!

Welles Wilder MAHow to trade:
Recommended for longer timeframes at least 4H.
Buy when the green dot appears.
Sell when the yellow dot appears.
Welles Wilder moving average by XOOOOOO

Borsaca Demo Limited Time OnlyThis indicator does NOT REPAINT. If the signal occurs it will be forever. Easy and profitable strategy optimized for Crypto, Foreks and Stock Markets...
This indicator gives you Long and Exit signals all timeframes...
BORSACA TRADER is optimized to catch trend movements as soon as possible and maximize profitability.
Strategy tester results. 96% Profitable on BTCUSD Daily scale. Test other markets you want.
WE RELY ON OUR INDICATOR TO THE END. AND WE ASSURE YOU THERE IS NOTHING BETTER THAN THE BORSACA TRADER INDICATOR.
Best regards and happy trading.
Herif's winning strategy option. Check the strategy tester results success than %96
Safe Mode as optional parameter. You can enable this to prevent some riskier trades to happen at the cost of some profitability. Use it if you are more conservative in trading.
Normal Mode signals for Buy and Sell. Trade Mode signals for buy and sell use with support and resistance levels.
Auto Support And Resistance ..
Auto Fibonacci Levels...
BORSACA TRADER indicator is the best option for everybody in financial markets. Check my Profile Page for more information and follow me, like and favorite my indicator and support your positive response and take a message for 10 days trial.
Happy trading. Good luck :)

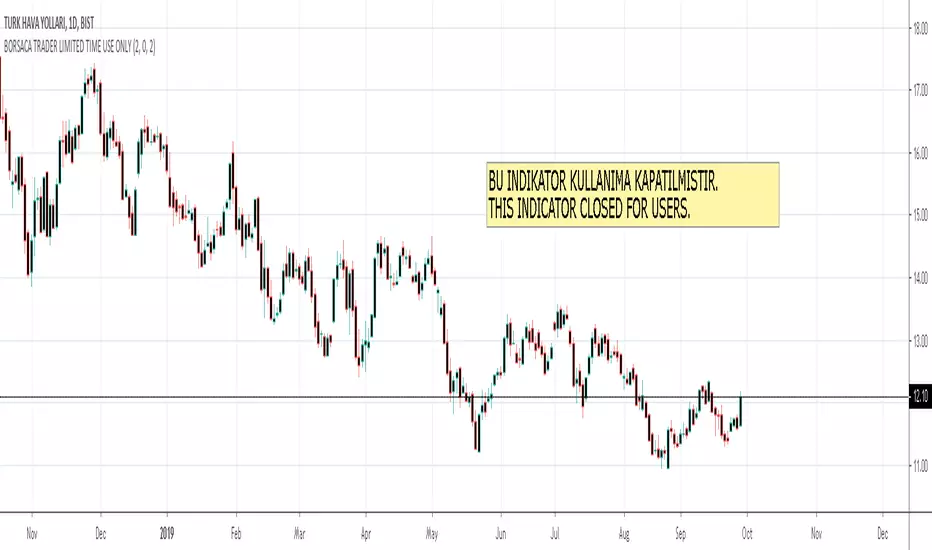
BORSACA TRADER LIMITED TIME USE ONLYThis indicator does NOT REPAINT. If the signal occurs it will be forever. Easy and profitable strategy optimized for Crypto, Foreks and Stock Markets...
This indicator gives you Long and Exit signals all timeframes...
BORSACA TRADER is optimized to catch trend movements as soon as possible and maximize profitability.
Strategy tester results. 96% Profitable on BTCUSD Daily scale. Test other markets you want.
WE RELY ON OUR INDICATOR TO THE END. AND WE ASSURE YOU THERE IS NOTHING BETTER THAN THE BORSACA TRADER INDICATOR.
Best regards and happy trading.
Herif's winning strategy option. Check the strategy tester results success than %96
Safe Mode as optional parameter. You can enable this to prevent some riskier trades to happen at the cost of some profitability. Use it if you are more conservative in trading.
Normal Mode signals for Buy and Sell.
Trade Mode signals for buy and sell use with support and resistance levels.
Auto Support And Resistance..
Auto Fibonacci Levels...
BORSACA TRADER indicator is the best option for everybody in financial markets. Check my Profile Page for more information and follow me, like and favorite my indicator and support your positive response and take a message for 10 days trial.
Happy trading. Good luck :)
₿OARWelcome to the ₿OAR!
This indicator is very simple to use. Simply apply it to any chart and you will see ₿ULL and ₿EAR signals! A ₿ULL signal is a buy and a ₿EAR signal is a sell.
Heikin ashi is recommended with this indicator.
You can also set alerts with this indicator. DM for access.
