Quad Rotation StochasticQuad Rotation Stochastic
The Quad Rotation Stochastic is a powerful and unique momentum oscillator that combines four different stochastic setups into one tool, providing an incredibly detailed view of market conditions. This multi-timeframe stochastic approach helps traders better anticipate trend continuations, reversals, and momentum shifts with greater precision than traditional single stochastic indicators.
Why this indicator is useful:
Multi-layered Momentum Analysis: Instead of relying on one stochastic, this script tracks four independent stochastic readings, smoothing out noise and confirming stronger signals.
Advanced Divergence Detection: It automatically identifies bullish and bearish divergences for each stochastic, helping traders spot potential reversals early.
Background Color Alerts: When a configurable number (e.g., 3 or 4) of the stochastics agree in direction and position (overbought/oversold), the background colors green (bullish) or red (bearish) to give instant visual cues.
ABCD Pattern Recognition: The script recognizes "shield" patterns when Stochastic 4 remains stuck at extreme levels (above 90 or below 10) for a set time, warning of potential trend continuation setups.
Super Signal Alerts: If all four stochastics align in extreme conditions and slope in the same direction, the indicator plots a special "Super Signal," offering high-confidence entry opportunities.
Why this indicator is unique:
Quad Confirmation Logic: Combining four different stochastics makes this tool much less prone to false signals compared to using a single stochastic.
Customizable Divergence Coloring: Traders can choose to have divergence lines automatically match the stochastic color for clear visual association.
Adaptive ABCD Shields: Innovative use of bar counting while a stochastic remains extreme acts as a "shield," offering a unique way to filter out minor fake-outs.
Flexible Configuration: Each stochastic's sensitivity, divergence settings, and visual styling can be fully customized, allowing traders to adapt it to their own strategy and asset.
Example Usage: Trading Bitcoin with Quad Rotation Stochastic
When trading Bitcoin (BTCUSD), you might set the minimum count (minCount) to 3, meaning three out of four stochastics must be in agreement to trigger a background color.
If the background turns green, and you notice an ABCD Bullish Shield (Green X), you might look for bullish candlestick patterns or moving average crossovers to enter a long trade.
Conversely, if the background turns red and a Super Down Signal appears, it suggests high probability for further downside, giving you strong confirmation to either short BTC or avoid entering new longs.
By combining divergence signals with background colors and the ABCD shields, the Quad Rotation Stochastic provides a layered confirmation system that gives traders greater confidence in their entries and exits — particularly in fast-moving, volatile markets like Bitcoin.
Exponential

Hybrid Triple Exponential Smoothing🙏🏻 TV, I present you HTES aka Hybrid Triple Exponential Smoothing, designed by Holt & Winters in the US, assembled by me in Saint P. I apply exponential smoothing individually to the data itself, then to residuals from the fitted values, and lastly to one-point forecast (OPF) errors, hence 'hybrid'. At the same time, the method is a closed-form solution and purely online, no need to make any recalculations & optimize anything, so the method is O(1).
^^ historical OPFs and one-point forecasting interval plotted instead of fitted values and prediction interval
Before the How-to, first let me tell you some non-obvious things about Triple Exponential smoothing (and about Exponential Smoothing in general) that not many catch. Expo smoothing seems very straightforward and obvious, but if you look deeper...
1) The whole point of exponential smoothing is its incremental/online nature, and its O(1) algorithm complexity, making it dope for high-frequency streaming data that is also univariate and has no weights. Consequently:
- Any hybrid models that involve expo smoothing and any type of ML models like gradient boosting applied to residuals rarely make much sense business-wise: if you have resources to boost the residuals, you prolly have resources to use something instead of expo smoothing;
- It also concerns the fashion of using optimizers to pick smoothing parameters; honestly, if you use this approach, you have to retrain on each datapoint, which is crazy in a streaming context. If you're not in a streaming context, why expo smoothing? What makes more sense is either picking smoothing parameters once, guided by exogenous info, or using dynamic ones calculated in a minimalistic and elegant way (more on that in further drops).
2) No matter how 'right' you choose the smoothing parameters, all the resulting components (level, trend, seasonal) are not pure; each of them contains a bit of info from the other components, this is just how non-sequential expo smoothing works. You gotta know this if you wanna use expo smoothing to decompose your time series into separate components. The only pure component there, lol, is the residuals;
3) Given what I've just said, treating the level (that does contain trend and seasonal components partially) as the resulting fit is a mistake. The resulting fit is level (l) + trend (b) + seasonal (s). And from this fit, you calculate residuals;
4) The residuals component is not some kind of bad thing; it is simply the component that contains info you consciously decide not to include in your model for whatever reason;
5) Forecasting Errors and Residuals from fitted values are 2 different things. The former are deltas between the forecasts you've made and actual values you've observed, the latter are simply differences between actual datapoints and in-sample fitted values;
6) Residuals are used for in-sample prediction intervals, errors for out-of-sample forecasting intervals;
7) Choosing between single, double, or triple expo smoothing should not be based exclusively on the nature of your data, but on what you need to do as well. For example:
- If you have trending seasonal data and you wanna do forecasting exclusively within the expo smoothing framework, then yes, you need Triple Exponential Smoothing;
- If you wanna use prediction intervals for generating trend-trading signals and you disregard seasonality, then you need single (simple) expo smoothing, even on trending data. Otherwise, the trend component will be included in your model's fitted values → prediction intervals.
8) Kind of not non-obvious, but when you put one smoothing parameter to zero, you basically disregard this component. E.g., in triple expo smoothing, when you put gamma and beta to zero, you basically end up with single exponential smoothing.
^^ data smoothing, beta and gamma zeroed out, forecasting steps = 0
About the implementation
* I use a simple power transform that results in a log transform with lambda = 0 instead of the mainstream-used transformers (if you put lambda on 2 in Box-Cox, you won't get a power of 2 transform)
* Separate set of smoothing parameters for data, residuals, and errors smoothing
* Separate band multipliers for residuals and errors
* Both typical error and typical residuals get multiplied by math.sqrt(math.pi / 2) in order to approach standard deviation so you can ~use Z values and get more or less corresponding probabilities
* In script settings → style, you can switch on/off plotting of many things that get calculated internally:
- You can visualize separate components (just remember they are not pure);
- You can switch off fit and switch on OPF plotting;
- You can plot residuals and their exponentially smoothed typical value to pick the smoothing parameters for both data and residuals;
- Or you might plot errors and play with data smoothing parameters to minimize them (consult SAE aka Sum of Absolute Errors plot);
^^ nuff said
More ideas on how to use the thing
1) Use Double Exponential Smoothing (data gamma = 0) to detrend your time series for further processing (Fourier likes at least weakly stationary data);
2) Put single expo smoothing on your strategy/subaccount equity chart (data alpha = data beta = 0), set prediction interval deviation multiplier to 1, run your strat live on simulator, start executing on real market when equity on simulator hits upper deviation (prediction interval), stop trading if equity hits lower deviation on simulator. Basically, let the strat always run on simulator, but send real orders to a real market when the strat is successful on your simulator;
3) Set up the model to minimize one-point forecasting errors, put error forecasting steps to 1, now you're doing nowcasting;
4) Forecast noisy trending sine waves for fun.
^^ nuff said 2
All Good TV ∞

Exponential Grid [Phi, Pi, Euler]If you disagree with one of the EMH principles that price is too random, then by definition you must agree that historic price has deterministic function to a scenario ahead.
I personally believe that constants like phi, pi and e can mimic exponential growth of the price.
In this script, first grid is based on the Lowest price multiplied with self fraction of the constant.
For example:
If you are familiar with fib ratio 1.272, then you must know that it is 1.618 to the power of 0.5.
With default settings of exponent step 0.25
First grid = Lowest price x phi^0.25
Second grid = Lowest price x phi^0.25x2
Third grid = Lowest price x phi^0.25x3 and so on
The script will automatically find the lowest price and update the grid values.
Or you can set up your custom Lowest price manually if you feel like the All Time Low level loses its relevance value after long period.
There are 64 grids including Lowest price level. And it wasn't by a chance. Pine Script has a limitation of max 64 plots. Number of grids shown in the chart depends on the highest price. Once price breaks above ATH a couple of next grids will be plotted automatically. In most cases if everything is plotted, the chart appears squeezed and you'll need to zoom in to see it. Therefore, I adjusted it relatively to the scale of the chart for the comfort.
In some cases 64 plots aren't enough to cover the whole chart. For example, let's take a look at NVIDIA chart:
Since the price has started with 0.0333, it is way too small to cover all with default settings.
We are left with 2 choices:
Either Enable "Round"
OR increase Exponent Step (from 0.25 to 0.5 in the particular example below)
If you set constant to pi or e which is a bigger number than phi, expect the gaps to be bigger. To reduce it to a more gradual way of expansion you can decrease Exponent Step.

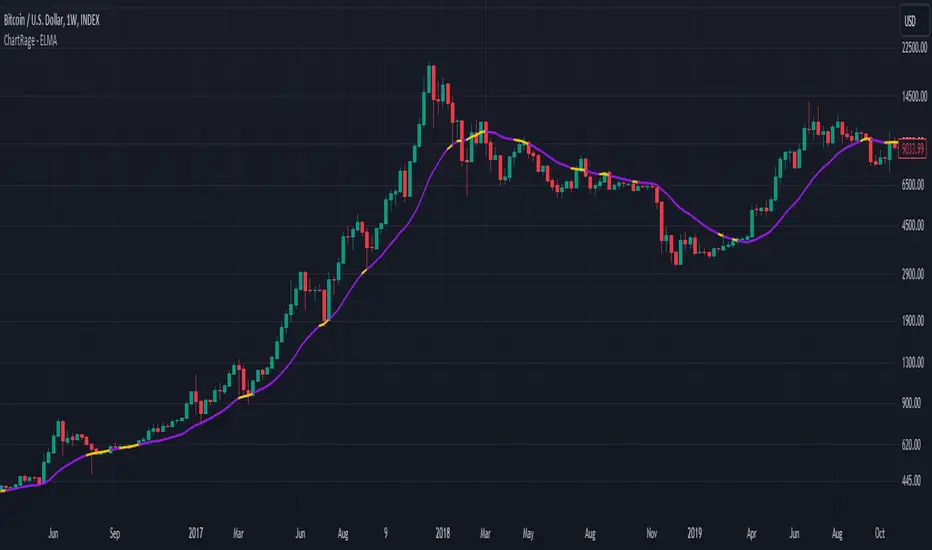
ChartRage - ELMAELMA - Exponential Logarithmic Moving Average
This is a new kind of moving average that is using exponential normalization of a logarithmic formula. The exponential function is used to average the weight on the moving average while the logarithmic function is used to calculate the overall price effect.
Features and Settings:
◻️ Following rate of change instead of absolute levels
◻️ Choose input source of the data
◻️ Real time signals through price interaction
◻️ Change ELMA length
◻️ Change the exponential decay rate
◻️ Customize base color and signal color
Equation of the ELMA:
This formula calculates a weighted average of the logarithm of prices, where more recent prices have a higher weight. The result is then exponentiated to return the ELMA value. This approach emphasizes the relative changes in price, making the ELMA sensitive to the % rate of change rather than absolute price levels. The decay rate can be adjusted in the settings.
Comparison EMA vs ELMA:
In this image we see the differences to the Exponential Moving Average.
Price Interaction and earlier Signals:
In this image we have added the bars, so we can see that the ELMA provides different signals of resistance and support zones and highlights them, by changing to the color yellow, when prices interact with the ELMA.
Strategy by trading Support and Resistance Zones:
The ELMA helps to evaluate trends and find entry points in bullish market conditions, and exit points in bearish conditions. When prices drop below the ELMA in a bull market, it is considered a buying signal. Conversely, in a bear market, it serves as an exit signal when prices trade above the ELMA.
Volatile Markets:
The ELMA works on all timeframes and markets. In this example we used the default value for Bitcoin. The ELMA clearly shows support and resistance zones. Depending on the asset, the length and the decay rate should be adjusted to provide the best results.
Real Time Signals:
Signals occur not after a candle closes but when price interacts with the ELMA level, providing real time signals by shifting color. (default = yellow)
Disclaimer* All analyses, charts, scripts, strategies, ideas, or indicators developed by us are provided for informational and educational purposes only. We do not guarantee any future results based on the use of these tools or past data. Users should trade at their own risk.
This work is licensed under Attribution-NonCommercial-ShareAlike 4.0 International
creativecommons.org
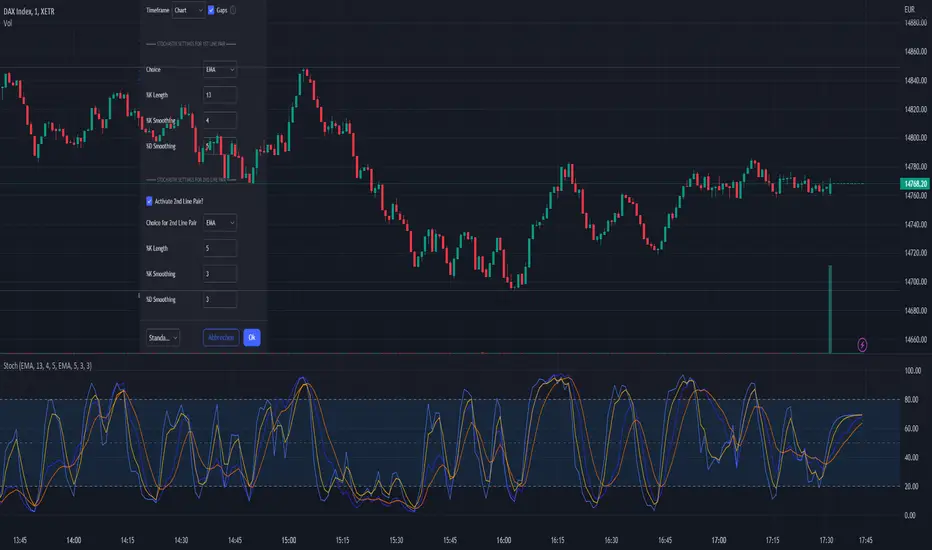
Stochastic EMA, SMA, VWMA + DivergenceEvery MetaTrader User knows the function to switch the stochastic calculation from simple to exponential.
So i took the original Stochastic code from TV and enhanced it for the SMA, EMA, and VWMA smoothing. If you are using a longer K Smoothing interval you will recognize a notable difference between SMA and EMA.
Standard Stochastic Calculation that is well kown
Option to switch smoothing calculation
Choice between Simple Moving Average, Exponential Moving Average, Volume Weighted Moving Average
If you have more wishes regarding the smoothing, just leave a comment i can add a lot more...
On my to-do list is also the divergence lines known from the "divergence indicator" (RSI).
I hope this helps to get better entries ;-)
Have fun!
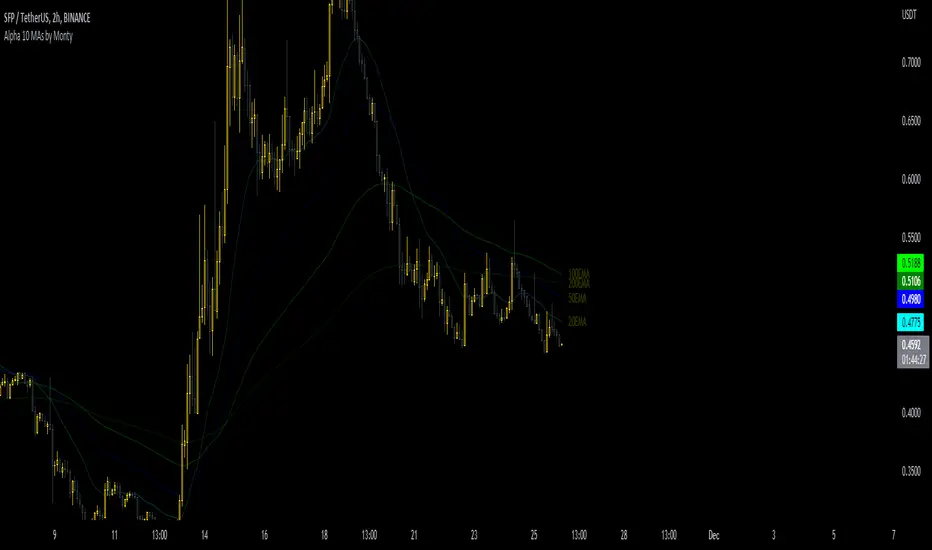
10 MAs Alpha Indicator by MontyThis indicator is a part of the script I coded earlier this month.
The name is to surprise one of our discord member.
I will publish that indicator in a few days as well, but publishing this as a gesture of giving back to the community.
Indicator has:
10 Moving Averages
Adjustable Color, Opacity and Size etc
Shows Labels for each of the MA.
Can be shifted between EMA or SMA
Can be fixed to show a specific TF MA on current Timeframe.
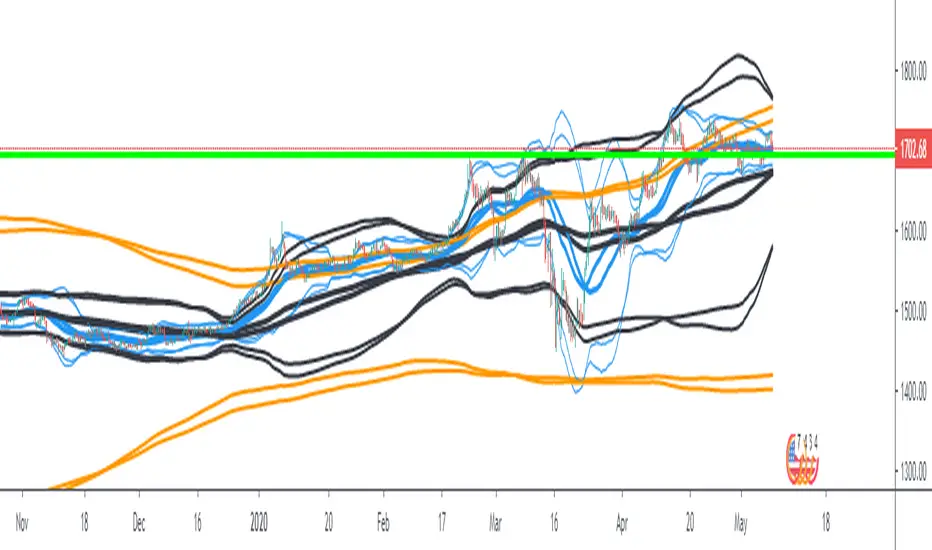
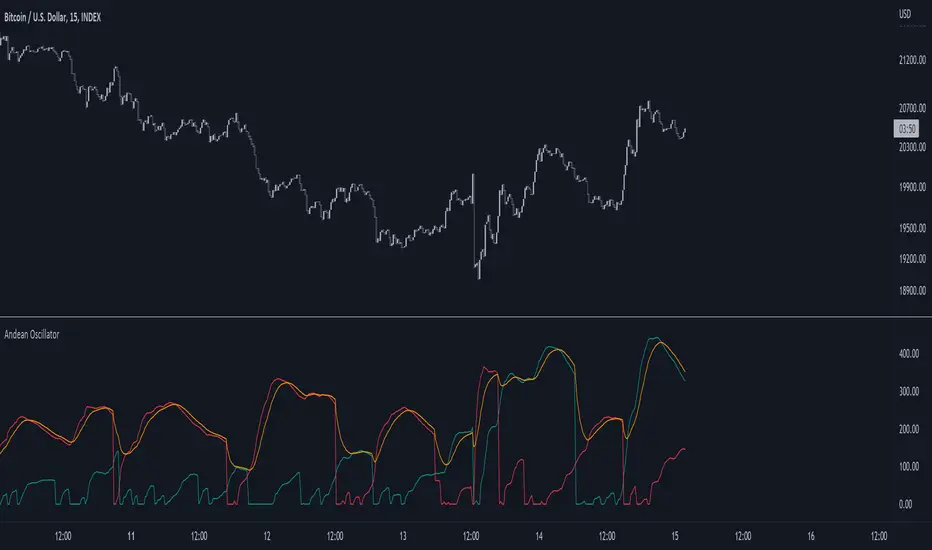
Andean OscillatorThe following script is an original creation originally posted on the blog section of the broker Alpaca.
The proposed indicator aims to measure the degree of variations of individual up-trends and down-trends in the price, thus allowing to highlight the direction and amplitude of a current trend.
Settings
Length : Determines the significance of the trends degree of variations measured by the indicator.
Signal Length : Moving average period of the signal line.
Usage
The Andean Oscillator can return multiple information to the user, with its core interpretation revolving around the bull and bear components.
A rising bull component (in green) indicates the presence of bullish price variations while a rising bear component (in red) indicates the presence of bearish price variations.
When the bull component is over the bear component market is up-trending, and the user can expect new higher highs. When the bear component is over the bull component market is down-trending, and the user can expect new lower lows.
The signal line (in orange) allows a more developed interpretation of the indicator and can be used in several ways.
It is possible to use it to filter out potential false signals given by the crosses between the bullish and bearish components. As such the user might want to enter a position once the bullish or bearish component crosses over the signal line instead.
Details
Measuring the degree of variations of trends in the price by their direction (up-trend/down-trend) can be done in several way.
The approach taken by the proposed indicator makes use of exponential envelopes and the naive computation of standard deviation.
First, exponential envelopes are obtained from both the regular prices and squared prices, thus giving two upper extremities, and two lower extremities.
The bullish component is obtained by first subtracting the upper extremity of the squared prices with the squared upper extremity of regular prices, the square root is then applied to this result.
The bearish component is obtained in the same way, but makes use of the lower extremities of the exponential envelopes.
VWAP With EMA Overlay (Adjustable Anchor)For those who want the classic Volume Weighted Average Price and Ema on the same overlay.
This script utilizes the same protocols as the VWAP and EMA you currently use. Just frees up an indicator space.
KEEP UP TO DATE
Are you a college student or graduate?
Join College Town Trade discord for helpful community specializing in trading stocks, options, and crypto.
Our staff consists of a group of college students with 10+ years of combined experience. Collectively we have profited and made well above an average yearly salary while being in college. The community aspect is everything and the team always listens and appreciates feedback. We all earn and learn together. There are free trials in place in order for you to see what it’s all about. These are in place so we can gain your trust and show transparency!
I look forward to seeing you in the community
advBtBjDhk

Volume Value per UnitThis script will plot the result of Volume / Close.
This is meant to normalize the volume of tickers with exponential growth, for example a ticker like $BTC that went from $1 to $50k. Having the volume divided by the close will normalize the volume for when the price was $1 and $50k.
Aggregated Moving AveragesUsers can display moving averages from higher time frame charts and display them on their current chart. This script supports up to 4 moving averages aggregated from a selected time frame. Each plot can be toggled if the user does not wish to have all 4 plots displayed.
Inputs allow user to edit:
Moving average length
Average type
Color
Timeframe input allows user to select which timeframe the moving averages are calculated from.
If you wish to have multiple timeframes across different moving averages, it is recommended you add a separate copies of the indicator for each timeframe you wish to display. Toggle visibility of which plots which you don't need.
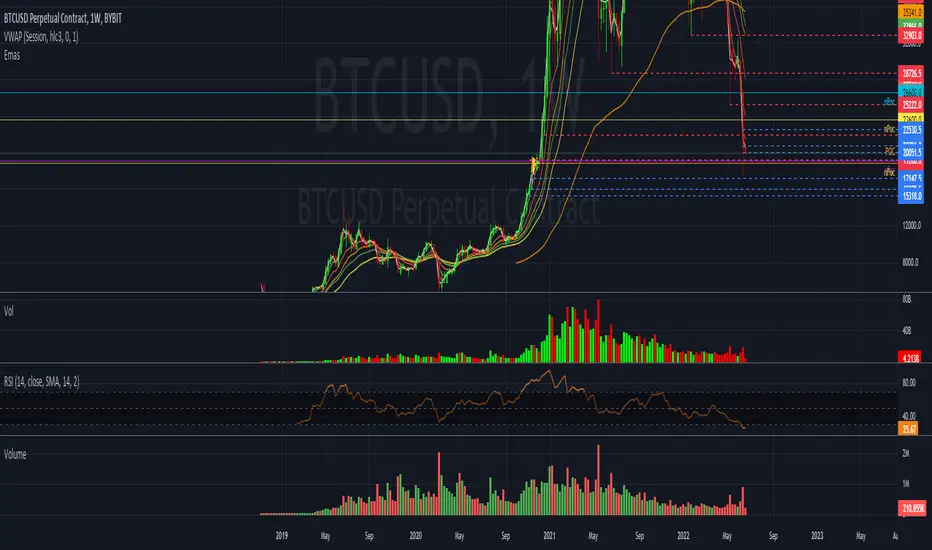
T3 + BB
TRES EMAS + BANDAS DE BOLLINGER
INDICADOR 1: TRES EMAS (MEDIA MOVIL EXPONENCIAL)
Con este indicador puede visualizar el promedio de precios con mayor peso a los datos mas recientes.
Se calculan y dibujan tres medias móviles exponenciales: 4, 20 y 200 últimas velas.
-Rápida EMA1 = 4, paso = 1
-Media EMA2 = 20, paso = 2
-Lenta EMA 3 = 200, paso = 10
INDICADOR 2: BANDAS DE BOLLINGER
Con este indicador podrá ver la fuerza y la tendencia del mercado, es decir la mide la volatilidad del precio del activo.
Si el precio sobrepasa la banda superior, el activo está sobrecomprado.
Si el precio sobrepasa la banda inferior, el activo está sobrevendido.
Longitud tendencia - BASE = 20, paso = 1
Desviación Estándar - Multiplicador = 2, paso = 0.2
Estos 2 indicadores sirven para todo tipo de activos: FOREX, CRIPTO, CFD´s, ETC.
------------------------------------------------------------------------------------------------------------------
THREE EMAS + BOLLINGER BANDS
INDICATOR 1: THREE EMAS (EXPONENTIAL MOVING AVERAGE)
With this indicator you can visualize the average of prices with greater weight to the most recent data.
Three exponential moving averages are calculated and drawn: 4, 20 and 200 last candles.
-Fast EMA1 = 4, step = 1
-Average EMA2 = 20, step = 2
-Slow EMA 3 = 200, step = 10
INDICATOR 2: BOLLINGER BANDS
With this indicator you can see the strength and trend of the market, that is, it is measured by the volatility of the asset price.
If the price goes above the upper band, the asset is overbought.
If the price goes above the lower band, the asset is oversold.
Trend length - BASE = 20, step = 1
Standard Deviation - Multiplier = 2, step = 0.2
These 2 indicators are used for all types of assets: FOREX, CRYPT, CFD's, ETC.

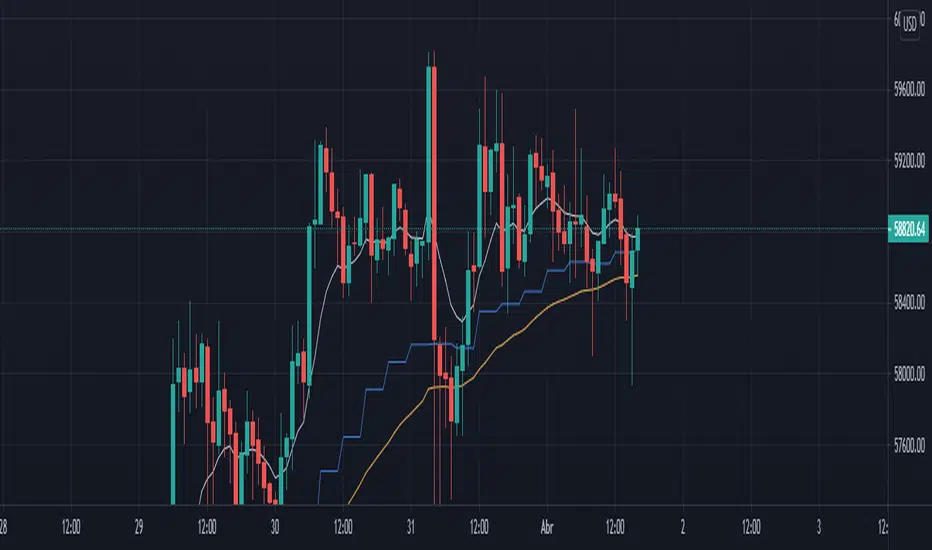
Fear Of Missing Out grid of forex tradingAbstract
This script finds potential safe grids placing limit orders without fear of missing out.
This script computes grids according to power of 1.0025 .
You can reference those price levels for your trading.
Introduction
Grid trading is a popular trading method.
Traders plan several price levels as grids and repeat buying at lower grids and selling at higher grids.
Grids can be round number like multiple of 100 pips.
Grids can also be support and resistance according to price history.
Some traders may think they need to adjust grids to trade.
However, there are several problems in choosing grids.
One problem is rate of change is related and therefore exponential. 20 to 30 is different from 30 to 40.
Another interesting point is there are some special impressing reversal price levels.
Several months ago, I had a question why usdjpy bounced near 108.3 .
After using a calculator, I found that 108.3 = 100 * 1.083 ≒ 100 * pow(1.0025,31) .
1.0025 , as known as 0.25% of change, is a potential stop out zone.
Therefore, we can compute grids and one grid is a little more than 1.0025 times than an another one.
After we finished computing grids, we can consider buy and sell near those grids.
Note that different traders may obtain different grid values.
For example, from 1.0 to 2.0 , it can be splited as 270 grids or 277 grids because pow(1.0025,277)<2 .
Those grids cannot always imply potential reversal points but they can be useful for traders looking for 0.25% profit targets with reducing fearing of buying or selling too early.
Computing grids
This script split from 1.0 to 10.0 into three segments.
One is 1.0 to 2.0 .
The second segment is from 2.0 to 5.0 .
The third segment is from 5.0 to 10.0 .
This script does the same thing for 0.1 to 1.0 , 10.0 to 100.0 , and so on.
For 1.0 to 2.0 and 5.0 to 10.0 , this script split a segment as 270 grids.
For 2.0 to 5.0 , this script split a segment as 360 grids.
The last step is display the next grids to the daily low and daily high.
Maybe also display the grids behind grids shown.
Parameters
x1,x2,x3,x4 : display the next x1,x2,x3,x4 grids to daily high and daily low. 1 means the next grid to daily high and daily low. 2 means the next grid to 1.
x_seg : default 2.0 . This script split from 1.0 to 10.0 into three segments. One is 1.0 to x_seg. The second segment is from x_seg to 10.0/x_seg . The third segment is from 10.0/x_seg to 10.0 .
x_grid1 : how many grids in the first segment
x_grid2 : how many grids in the second segment
x_lowprice : add this number for bigger grid distance. Generally, you don't need this number when trading forex but you may need it in stock trading. For stocks with price between 50 to 100, I recommend you use x_lowprice=100.
Conclusion and suggestions
This script can find potential grids for trading.
If price touches grids usually, we can consider buy and sell after price touches grids.
If price reverses before touching grids usually, we may consider buy and sell before price touches grids.
Those grids can remind us don't buy too much unless the price touches the next grid.
For instruments with less volatility, maybe we need more grids.
For traders with more money, they may also consider more grids for more dedicated range trading to collect more profit.
Reference
Sorry, I forgot them.

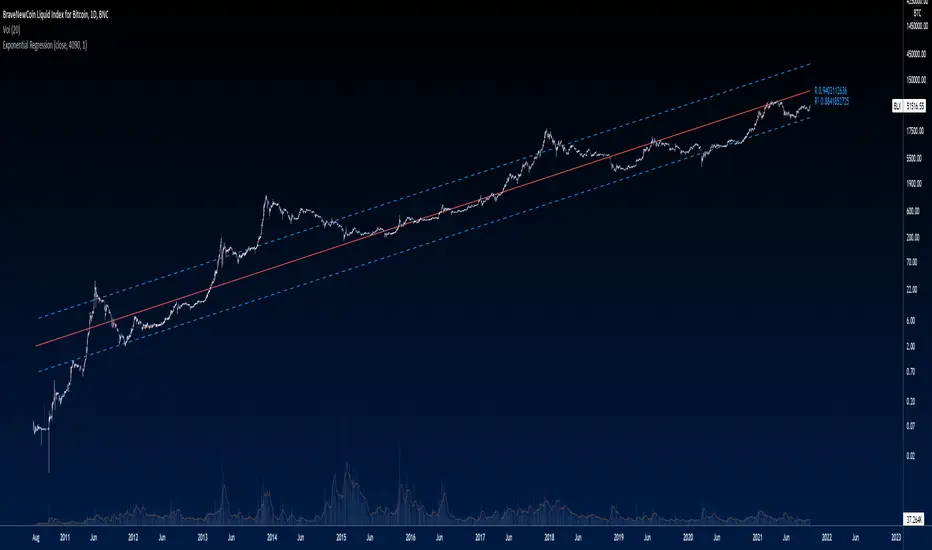
Exponential Regression From ArraysCalculates an exponential regression from arrays. Due to line limits, for sets greater than the limit, only every nth value is plotted in order to cover the entire set.
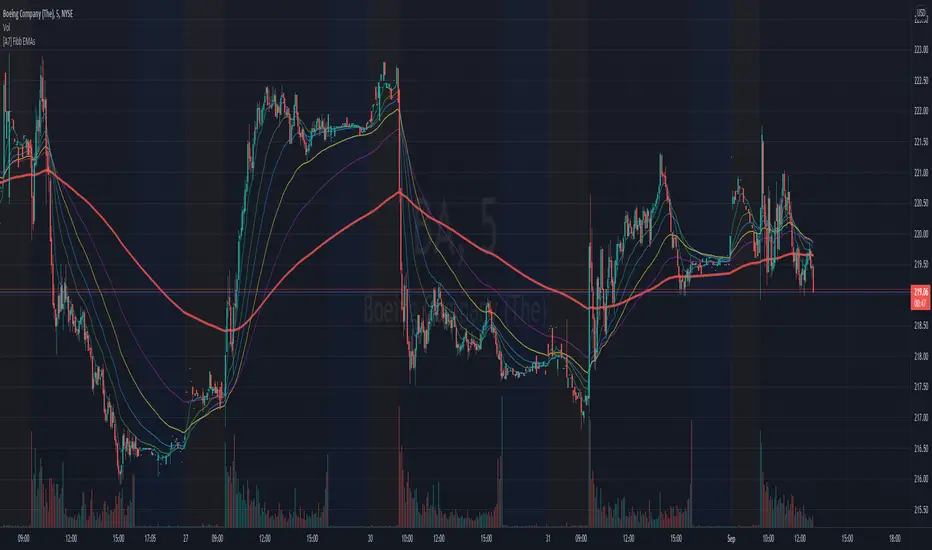
[A7] Fibonacci EMAs (8,21,34,55,89,233) Fibonacci EMAs (8,21,34,55,89,233)
Fibonacci Exponential Moving Averages
8 - aqua
21 - green
34 - blue
55 - yellow
89 - purple
233 - red
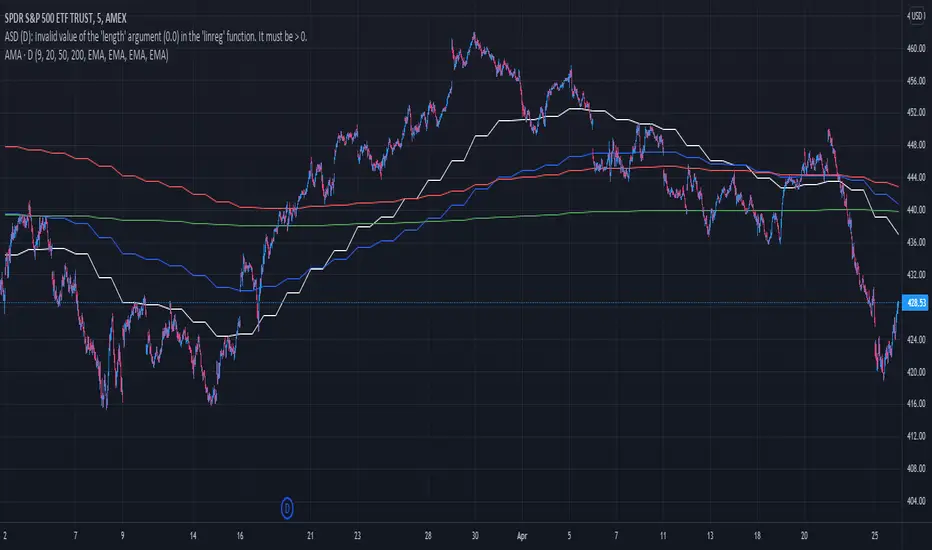
Overlay Indicators (EMAs, SMAs, Ichimoku & Bollinger Bands)This is a combination of popular overlay indicators that are used for dynamic support and resistance, trade targets and trend strength.
Included are:
-> 6 Exponential Moving Averages
-> 6 Simple Moving Averages
-> Ichimoku Cloud
-> Bollinger Bands
-> There is also a weekend background marker ideal for cryptocurrency trading
Using all these indicators in conjunction with each other provide great confluence and confidence in trades and price targets.
An explanation of each indicator is listed below.
What Is an Exponential Moving Average (EMA)?
"An exponential moving average (EMA) is a type of moving average (MA) that places a greater weight and significance on the most recent data points. The exponential moving average is also referred to as the exponentially weighted moving average. An exponentially weighted moving average reacts more significantly to recent price changes than a simple moving average (SMA), which applies an equal weight to all observations in the period.
What Does the Exponential Moving Average Tell You?
The 12- and 26-day exponential moving averages (EMAs) are often the most quoted and analyzed short-term averages. The 12- and 26-day are used to create indicators like the moving average convergence divergence (MACD) and the percentage price oscillator (PPO). In general, the 50- and 200-day EMAs are used as indicators for long-term trends. When a stock price crosses its 200-day moving average, it is a technical signal that a reversal has occurred.
Traders who employ technical analysis find moving averages very useful and insightful when applied correctly. However, they also realize that these signals can create havoc when used improperly or misinterpreted. All the moving averages commonly used in technical analysis are, by their very nature, lagging indicators."
Source: www.investopedia.com
Popular EMA lookback periods include fibonacci numbers and round numbers such as the 100 or 200. The default values of the EMAs in this indicator are the most widely used, specifically for cryptocurrency but they also work very well with traditional.
EMAs are normally used in conjunction with Simple Moving Averages.
" What Is Simple Moving Average (SMA)?
A simple moving average (SMA) calculates the average of a selected range of prices, usually closing prices, by the number of periods in that range.
Simple Moving Average vs. Exponential Moving Average
The major difference between an exponential moving average (EMA) and a simple moving average is the sensitivity each one shows to changes in the data used in its calculation. More specifically, the EMA gives a higher weighting to recent prices, while the SMA assigns an equal weighting to all values."
Source: www.investopedia.com
In this indicator, I've included 6 popular moving averages that are commonly used. Most traders will find specific settings for their own personal trading style.
Along with the EMA and SMA, another indicator that is good for finding confluence between these two is the Ichimoku Cloud.
" What is the Ichimoku Cloud?
The Ichimoku Cloud is a collection of technical indicators that show support and resistance levels, as well as momentum and trend direction. It does this by taking multiple averages and plotting them on the chart. It also uses these figures to compute a "cloud" which attempts to forecast where the price may find support or resistance in the future.
The Ichimoku cloud was developed by Goichi Hosoda, a Japanese journalist, and published in the late 1960s.1 It provides more data points than the standard candlestick chart. While it seems complicated at first glance, those familiar with how to read the charts often find it easy to understand with well-defined trading signals."
More info can be seen here: www.investopedia.com
I have changed the default settings on the Ichimoku to suit cryptocurrency trading (as cryptocurrency is usually fast and thus require slightly longer lookbacks) to 20 60 120 30.
Along with the Ichimoku, I like to use Bollinger Bands to not only find confluence for support and resistance but for price discovery targets and trend strength.
" What Is a Bollinger Band®?
A Bollinger Band® is a technical analysis tool defined by a set of trendlines plotted two standard deviations (positively and negatively) away from a simple moving average (SMA) of a security's price, but which can be adjusted to user preferences.
Bollinger Bands® were developed and copyrighted by famous technical trader John Bollinger, designed to discover opportunities that give investors a higher probability of properly identifying when an asset is oversold or overbought."
This article goes into great detail of the complexities of using the Bollinger band and how to use it.
=======
This indicator combines all these powerful indicators into one so that it is easier to input different settings, turn specific tools on or off and can be easily customised.

Multi_TF_EMAMultiple TimeFrame EMA
In a single indicator, up to 6 EMAs can be displayed in 6 different time frames.
En un solo indicador se puede visualizar hasta 6 EMAs en diferentes TImeFrames.
Rainbow Trend IndicatorThis is an indicator based on the MA rainbow concept. It is possible to choose between 15 or 20 MA's and if all 15 MA's is picked, the calculation will be calculated on 15 MA's and if 20 is picked the calculation is calculated on 20 MA's. The indicator will then be a line which is assigned a value from the calculation based on the MA's. If the line is above the dashed zero line, meaning the line's last value is a positive value, the price is in a uptrend and if the line is below the dashed zero line, meaning the line's last value is a negative value, the price is in a downtrend.
In short
If the line is green, the price is in a uptrend. If the line is red, the price is in a downtrend.

Exponential Deviation Bands Width [ChuckBanger]This indicator is a compliment to Exponential Deviation Bands . It is the difference between the upper and the lower bands divided by the middle band. It is an easy way to visualize consolidation before price movements or periods of higher volatility.
How it works
During a period of high volatility, the distance between the two bands will widen and Exponential Deviation Bands width will increase. And the opposite occurs during a period of low volatility, the distance between the two bands will contract and Exponential Deviation Bands width will decrease. Meaning there is a tendency for bands to alternate between expansion and contraction.
When the bands are relatively far apart, that is often is a sign that the current trend is ending. When the distance between the two bands is relatively narrow that often is a sign that the market is about to initiate a bigger move in either direction.


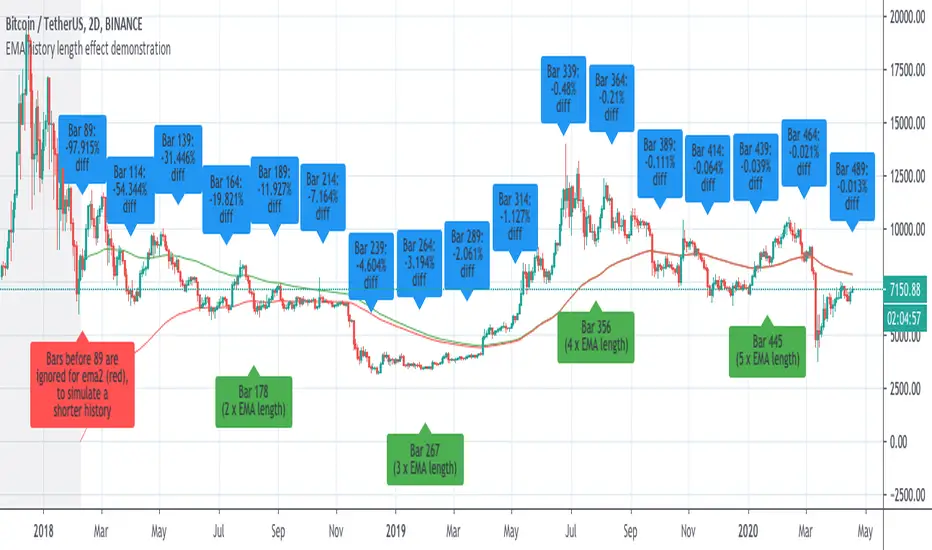
Demonstration of how history length affects all EMA valuesI saw some discussion of this so I whipped up an example to prove the that effect of history length on EMA values is pronounced, even for bars much further than the EMA length from the first candle of the chart.
This chart has two 89-bar EMAs of the close: a green one and a red one. However, for the red one, the first 89 bars of the graph are considered to have a close of "0", which is exactly whatTradingView's EMA calculation uses for bars before the start of the graph.
This is because unlike other moving averages, which reference the price of previous bars, the EMA references the EMA of previous bars. Therefore, bars closer to the beginning of the chart, where TradingView can't calculate an EMA because there is no previous EMA and therefore uses 0, will return substantially different values for the EMA() function that the same cart would with more history.
The further a bar is back in history, the less influence it has. However, every single historical bar has some influence on the EMA of every later bar.
To allow you to see this for yourself, this script contains the following inputs which you can change to see the effect:
-EMA period (default 89)
-Number of bars to ignore for EMA2 (default 89)
-decimal precision to show differences in. By making this a large number you can see that, although the effects diminish, history length affects all EMA values for the char.
-label spacing (increase this if you have a long history and run into TV's 50-label limit)
6 Moving Averages with MTF v1.0This indicator is a collection of 6 different period Moving Averages. It has support for different time-frame resolution for all of them individually.
Also, it has 11 different type of Moving Average calculation functions:
1. Simple Moving Average (SMA)
2. Exponential Moving Average (EMA)
3. Weighted Moving Average (WMA)
4. Volume Weighted Moving Average (VWMA)
5. Smoothed Moving Average (SMMA)
6. Double Exponential Moving Average (DEMA)
7. Triple Exponential Moving Average (TEMA)
8. Hull WMA Moving Average (HullMA)
9. Triangular Moving Average (TMA)
10. Super Smoother Moving Average (SSMA)
11. Zero Lag Exponential Moving Average (ZEMA)
Note: The Moving Average calculation function is adapted from @JustUncleL
Happy trading 😉
Thank you.

Bollinger Bands Ema 50,200,800EMAs converted to Bollinger Bands The bands are 50, 200 and 800 period, forming a strategy and having clear trends and stronger supports and resistances (when the lines converge the area is stronger).