Fair Value Gap Suite Adrian V1.0.0Brief description
The “FVG Suite” identifies fair value gaps across multiple time units, evaluates them with a displacement score, optionally filters them according to market structure events (BOS/CHOCH), and provides context-based alerts for first touch, partial and full fills, and invalidation. The aim is to show only high-quality imbalances and trade them based on rules.
What makes the script unique (originality/added value)
Displacement score: Strength of the impulse movement as a combination of (body/ATR, range/ATR, volume Z-score).
MTF aggregator: FVGs from higher timeframes are collected, ranked, and displayed as zones on the active chart (including overlap clustering).
Structure context: Optionally, only FVGs after confirmed BOS/CHOCH in the trend direction, including premium/discount evaluation relative to the HTF range.
Adaptive invalidation: FVG expires after candles, opposing BOS or defined time (e.g., end of session).
Session/instrument filter: Time window (e.g., NY/LDN), minimum tick size, ATR-based minimum gap.
Smart fill logic: Distinguishes between first touch, partial fill (≥ %), full fill (100%); alarms per event.
Statistics overlay (optional): Hit rate/expectancy per TF & session for fine-tuning the filters.
How it works (conceptually)
FVG definition (3-candle pattern): Bullish if High < Low (bearish analog). Size = gap span in points.
Quality score:Score = w1*(|Body|/ATR) + w2*(Range/ATR) + w3*(Volume-Z), normalized to 0–100.
MTF scan: List of higher TFs: (customizable). Findings are merged, ranked, and displayed as zones with priority (color/opacity).
Context filter: Only FVGs that emerge after BOS/CHOCH in the direction of the current trend; optional exclusion in premium/discount areas.
Invalidation & alerts: A zone is considered active until the invalidation rule takes effect. Alerts are triggered upon: initial contact, partial/full filling, invalidation.
Important inputs
Min. FVG size: × ATRor ticks/points
Min. displacement score: (0–100)
MTF list:
BOS/CHOCH filter: On/Off (Lookback candles)
Session filter: NY/LDN/Asia (local time, weekend toggle)
Invalidation: maxBars = , Opposite BOS = On/Off, Session End = On/Off
Fill definitions: Partial fill ≥ % of the gap; Full fill = 100%
Overlay options: Zone color/transparency, HTF label, statistics overlay On/Off
Alerts (names & triggers)
FVG Suite – First Touch: Price touches an active FVG zone for the first time.
FVG Suite – Partial Fill: Partial fill ≥ configured threshold.
FVG Suite – Full Fill: Gap completely filled.
FVG Suite – Invalidated: Zone invalidated by rules. (Alert message contains: symbol, TF of the zone, direction, score, size, trigger rule.)
Use (best practices)
Trade in the trend direction with BOS/CHOCH filter; target counter-imbalances/liquidity pools.
Use session filters to avoid news spikes/illiquid periods.
Calibrate parameters for each market/TF (ATR/volume profiles differ).
Limitations
Structure labels can be reevaluated for new highs/lows (repainting of labels, not of FVG finds).
Spreads/news can generate “pseudo fills.”
Backtests/statistics are sample-dependent; no guarantee of results.
Changelog
v1.0 – First release (score model, MTF aggregator, BOS/CHOCH filter, fill alerts).
Credits
FVG concept: public ICT/SMC literature (general idea). Implementation/scoring, MTF ranking, smart fill logic: own development.
Note/disclaimer
No financial advice. For educational purposes only. Trading involves high risk; use stop losses and a fixed risk budget.
Fairvaluegap
Fair Value Gap Suite Adrian V1.0.0Brief description
The “FVG Suite” identifies fair value gaps across multiple time units, evaluates them with a displacement score, optionally filters them according to market structure events (BOS/CHOCH), and provides context-based alerts for first touch, partial and full fills, and invalidation. The aim is to show only high-quality imbalances and trade them based on rules.
What makes the script unique (originality/added value)
Displacement score: Strength of the impulse movement as a combination of (body/ATR, range/ATR, volume Z-score).
MTF aggregator: FVGs from higher timeframes are collected, ranked, and displayed as zones on the active chart (including overlap clustering).
Structure context: Optionally, only FVGs after confirmed BOS/CHOCH in the trend direction, including premium/discount evaluation relative to the HTF range.
Adaptive invalidation: FVG expires after candles, opposing BOS or defined time (e.g., end of session).
Session/instrument filter: Time window (e.g., NY/LDN), minimum tick size, ATR-based minimum gap.
Smart fill logic: Distinguishes between first touch, partial fill (≥ %), full fill (100%); alarms per event.
Statistics overlay (optional): Hit rate/expectancy per TF & session for fine-tuning the filters.
How it works (conceptually)
FVG definition (3-candle pattern): Bullish if High < Low (bearish analog). Size = gap span in points.
Quality score:Score = w1*(|Body|/ATR) + w2*(Range/ATR) + w3*(Volume-Z), normalized to 0–100.
MTF scan: List of higher TFs: (customizable). Findings are merged, ranked, and displayed as zones with priority (color/opacity).
Context filter: Only FVGs that emerge after BOS/CHOCH in the direction of the current trend; optional exclusion in premium/discount areas.
Invalidation & alerts: A zone is considered active until the invalidation rule takes effect. Alerts are triggered upon: initial contact, partial/full filling, invalidation.
Important inputs
Min. FVG size: × ATRor ticks/points
Min. displacement score: (0–100)
MTF list:
BOS/CHOCH filter: On/Off (Lookback candles)
Session filter: NY/LDN/Asia (local time, weekend toggle)
Invalidation: maxBars = , Opposite BOS = On/Off, Session End = On/Off
Fill definitions: Partial fill ≥ % of the gap; Full fill = 100%
Overlay options: Zone color/transparency, HTF label, statistics overlay On/Off
Alerts (names & triggers)
FVG Suite – First Touch: Price touches an active FVG zone for the first time.
FVG Suite – Partial Fill: Partial fill ≥ configured threshold.
FVG Suite – Full Fill: Gap completely filled.
FVG Suite – Invalidated: Zone invalidated by rules. (Alert message contains: symbol, TF of the zone, direction, score, size, trigger rule.)
Use (best practices)
Trade in the trend direction with BOS/CHOCH filter; target counter-imbalances/liquidity pools.
Use session filters to avoid news spikes/illiquid periods.
Calibrate parameters for each market/TF (ATR/volume profiles differ).
Limitations
Structure labels can be reevaluated for new highs/lows (repainting of labels, not of FVG finds).
Spreads/news can generate “pseudo fills.”
Backtests/statistics are sample-dependent; no guarantee of results.
Changelog
v1.0 – First release (score model, MTF aggregator, BOS/CHOCH filter, fill alerts).
Credits
FVG concept: public ICT/SMC literature (general idea). Implementation/scoring, MTF ranking, smart fill logic: own development.
Note/disclaimer
No financial advice. For educational purposes only. Trading involves high risk; use stop losses and a fixed risk budget.
Multi Timeframe Fair Value Gap Indicator ProMulti Timeframe Fair Value Gap Indicator Pro | MTF FVG Imbalance Zones | Institutional Supply Demand Levels
🎯 The Most Comprehensive Multi-Timeframe Fair Value Gap (FVG) Indicator on TradingView
Transform Your Trading with Institutional-Grade Multi-Timeframe FVG Analysis
Keywords: Multi Timeframe Indicator, MTF FVG, Fair Value Gap, Imbalance Zones, Supply and Demand, Institutional Trading, Order Flow Imbalance, Price Inefficiency, Smart Money Concepts, ICT Concepts, Volume Imbalance, Liquidity Voids, Multi Timeframe Analysis
📊 WHAT IS THIS INDICATOR?
The Multi Timeframe Fair Value Gap Indicator Pro is the most advanced FVG detection system on TradingView, designed to identify high-probability institutional supply and demand zones across multiple timeframes simultaneously. This professional-grade tool automatically detects Fair Value Gaps (FVGs), also known as imbalance zones, liquidity voids, or inefficiency gaps - the exact areas where institutional traders enter and exit positions.
🔍 What Are Fair Value Gaps (FVGs)?
Fair Value Gaps are three-candle price formations that create imbalances in the market structure. These gaps represent areas where buying or selling was so aggressive that price moved too quickly, leaving behind an inefficient zone that price often returns to "fill" or "mitigate." Professional traders use these zones as high-probability entry points.
Bullish FVG: When the low of candle 3 is higher than the high of candle 1
Bearish FVG: When the high of candle 3 is lower than the low of candle 1
⚡ KEY FEATURES
📈 Multi-Timeframe Analysis (MTF)
- 12 Timeframes Simultaneously: 1m, 3m, 5m, 15m, 30m, 45m, 1H, 2H, 3H, 4H, Daily, Weekly
- Real-Time Detection: Instantly identifies FVGs as they form across all selected timeframes
- Customizable Timeframe Selection: Choose which timeframes to display based on your trading style
- Higher Timeframe Confluence: See when multiple timeframes align for stronger signals
🎨 Three Professional Visual Themes
1. Dark Intergalactic: Futuristic neon colors with high contrast for dark mode traders
2. Light Minimal: Clean, professional appearance for traditional charting
3. Pro Modern: Low-saturation colors for extended screen time comfort
📊 Advanced FVG Dashboard
- Live FVG Counter: Real-time count of active bullish and bearish gaps
- Total Zone Tracking: Monitor all active imbalance zones at a glance
- Theme-Adaptive Display: Dashboard automatically adjusts to your selected visual theme
- Strategic Positioning: Optimally placed to not interfere with price action
🔧 Smart Zone Management
- Dynamic Zone Updates: FVG boxes automatically adjust when price touches them
- Mitigation Detection: Visual feedback when zones are tested or filled
- Color-Coded Status: Instantly see untested vs tested zones
- Extended Projection: Option to extend boxes to the right for future reference
- Timeframe Labels: Optional labels showing which timeframe each FVG originated from
💡 Intelligent Features
- Automatic Zone Cleanup: Removes fully mitigated FVGs to keep charts clean
- Touch-Based Level Adjustment: Zones adapt to partial fills
- Maximum Box Management: Optimized to handle 500 simultaneous FVG zones
- Performance Optimized: Efficient code ensures smooth operation even with multiple timeframes
🎯 TRADING APPLICATIONS
Day Trading & Scalping
- Use 1m, 3m, 5m FVGs for quick scalp entries
- Combine with higher timeframe FVGs for directional bias
- Perfect for futures (ES, NQ, MNQ), forex, and crypto scalping
Swing Trading
- Focus on 1H, 4H, and Daily FVGs for swing positions
- Identify major support/resistance zones
- Plan entries at untested higher timeframe gaps
Position Trading
- Utilize Daily and Weekly FVGs for long-term positions
- Identify institutional accumulation/distribution zones
- Major reversal points at significant imbalance areas
Multi-Timeframe Confluence Trading
- Stack multiple timeframe FVGs for high-probability zones
- Confirm entries when lower and higher timeframe FVGs align
- Professional edge through timeframe confluence
📚 HOW TO USE THIS INDICATOR
Step 1: Add to Your Chart
Click "Add to Favorites" and apply to any trading instrument - works on all markets including stocks, forex, crypto, futures, and indices.
Step 2: Configure Your Timeframes
In settings, select which timeframes you want to monitor. Day traders might focus on 1m-15m, while swing traders might use 1H-Weekly.
Step 3: Choose Your Visual Theme
Select from three professional themes based on your preference and trading environment.
Step 4: Identify Trading Opportunities
For Long Entries:
- Look for Bullish FVGs (green/cyan zones)
- Wait for price to return to untested zones
- Enter when price shows rejection from the FVG zone
- Higher timeframe FVGs provide stronger support
For Short Entries:
- Look for Bearish FVGs (red/pink zones)
- Wait for price to return to untested zones
- Enter when price shows rejection from the FVG zone
- Higher timeframe FVGs provide stronger resistance
Step 5: Manage Risk
- Place stops beyond the FVG zone
- Use partially filled FVGs as trailing stop levels
- Exit when opposite FVGs form (reversal signal)
🏆 WHY THIS IS THE BEST MTF FVG INDICATOR
✅ Most Comprehensive
- More timeframes than any other FVG indicator
- Advanced features not found elsewhere
- Professional-grade visual presentation
✅ Institutional-Grade
- Based on smart money concepts (SMC)
- ICT (Inner Circle Trader) methodology compatible
- Used by professional prop traders
✅ User-Friendly
- Clean, intuitive interface
- Detailed tooltips and descriptions
- Works out-of-the-box with optimal defaults
✅ Continuously Updated
- Regular improvements and optimizations
- Community feedback incorporated
- Professional development by PineProfits
🔥 PERFECT FOR
- Scalpers seeking quick FVG fills
- Day Traders using multi-timeframe analysis
- Swing Traders identifying major zones
- ICT/SMC Traders following smart money
- Prop Firm Traders needing reliable setups
- Algorithmic Traders building systematic strategies
- Technical Analysts studying market structure
- All Experience Levels from beginners to professionals
💎 ADVANCED TIPS
1. Confluence is Key: The strongest signals occur when multiple timeframe FVGs align at the same price level
2. Fresh vs Tested: Untested FVGs (original color) are stronger than tested ones (gray/muted color)
3. Time of Day: FVGs formed during high-volume sessions (London/NY) are more reliable
4. Trend Alignment: Trade FVGs in the direction of the higher timeframe trend for best results
5. Volume Confirmation: Combine with volume indicators for enhanced reliability
📈 INDICATOR SETTINGS
Visual Settings
- Visual Theme: Choose between Dark Intergalactic, Light Minimal, or Pro Modern
- Show Branding: Toggle PineProfits branding on/off
General Settings
- Move box levels with price touch: Dynamically adjust FVG zones
- Change box color with price touch: Visual feedback for tested zones
- Extend boxes to the right: Project zones into the future
- Plot Timeframe Label: Show origin timeframe on each FVG
- Show FVG Dashboard: Toggle the summary dashboard
Timeframe Selection
Select any combination of 12 available timeframes (1m to Weekly)
🚀 GET STARTED NOW
1. Click "Add to Favorites" to save this indicator
2. Apply to your chart - works on any instrument
3. Join thousands of traders already using this professional tool
4. Follow PineProfits for more institutional-grade indicators
⚖️ DISCLAIMER
This indicator is for educational and informational purposes only. It should not be considered financial advice. Always do your own research and practice proper risk management. Past performance does not guarantee future results. Trade responsibly.
© PineProfits - Professional Trading Tools for Modern Markets
If you find this indicator valuable, please leave a like and comment. Your support helps me create more professional-grade tools for the TradingView community!

ICT Confirmed FVG Indicator ICT FVG Indicator (Confirmed by Swings)
Summary
This indicator is designed to identify high-probability Fair Value Gaps (FVGs) by confirming them with market structure. It filters out random imbalances and only highlights the FVGs that are created at the same time as a confirmed ICT Swing High or Swing Low.
The core principle is to connect price imbalances directly to significant shifts in market structure, providing a cleaner and more powerful signal.
What It Does
Identifies Swing Points: Automatically detects and draws confirmed swing highs (resistance) and swing lows (support) on your chart based on the settings you choose.
Finds Fair Value Gaps: It scans the chart for the classic 3-candle FVG pattern (also known as a BISI or SIBI).
Confirms FVGs with Swings: This is the most important feature. The indicator will only draw an FVG box if one of the three candles that created the FVG is also a confirmed swing point. This ensures you are only seeing imbalances that are directly related to a break in market structure.
Invalidates Old FVGs: To keep the chart clean, the indicator will automatically remove an FVG box after the price has fully passed through it a certain number of times (customizable in the settings).
Settings Explained
ICT Swings Settings
Left/Right Strength: Controls the sensitivity of the swing detection. Higher numbers require a more significant, obvious swing point to be confirmed. Lower numbers will identify more minor swings.
Max Swing Lines: Sets the maximum number of swing high and swing low lines to display on the chart at one time.
Swing High/Low Color: Customize the color of the swing point lines.
FVG Settings
Show Bullish/Bearish FVG: Use these checkboxes to turn the bullish (green) or bearish (red) FVG boxes on or off.
Bullish/Bearish FVG Color: Customize the color of the FVG boxes.
FVG Invalidation Threshold: This sets how many times the price can fully close on the other side of an FVG before the box is automatically removed.
Max Active FVGs to Show: Sets the maximum number of FVG boxes to keep on the chart to prevent clutter.
Key Features
High-Probability Signals: Filters out noise by focusing only on FVGs that are confirmed by a shift in market structure.
Clean Visuals: Automatically draws and removes swing lines and FVG boxes to keep your chart uncluttered.
Fully Customizable: Adjust the sensitivity of the swing detection and the appearance of the FVGs to fit your trading style.
Pure ICT Concepts: Built strictly on the principles of Inner Circle Trader for a method-consistent analysis.

FVG + IFVG Gap (ULTRA) by Aditya NejeThis Indicator shows Fair Value Gap and Inverse Fair Value gaps

FVG-Bully BearsFVG-Bully Bears Indicator
The FVG-Bully Bears indicator is a powerful tool designed to identify Fair Value Gaps (FVGs) on your TradingView charts. FVGs are price gaps that occur when the market moves sharply, leaving areas where little to no trading activity took place. These gaps often act as key support or resistance zones, making them valuable for traders looking to spot potential reversal or continuation points.
This indicator highlights Bullish FVGs (potential support zones) and Bearish FVGs (potential resistance zones) with customizable boxes and labels, helping you visualize these critical price levels with ease.
Features
Bullish and Bearish FVGs: Detects gaps where price has left untested areas, marking bullish (green) and bearish (red) FVGs.
Customizable Display: Choose to show or hide bullish/bearish FVGs, adjust colors, and control box visibility.
FVG Labels: Optional labels on each FVG box to clearly identify bullish or bearish gaps, with adjustable text size.
Delete Filled FVGs: Automatically removes FVGs once price revisits and fills the gap, keeping your chart clean.
Box Extension: Extend FVG boxes into the future (up to 100 bars) to track unfilled gaps over time.
Performance Optimization: Limits the number of displayed FVG boxes (default: 50) to ensure smooth chart performance.
How It Works
Bullish FVG: Identified when the high of a candle two bars ago is lower than the low of the current candle, indicating a sharp upward move.
Bearish FVG: Identified when the low of a candle two bars ago is higher than the high of the current candle, indicating a sharp downward move.
FVGs are drawn as colored boxes (green for bullish, red for bearish) and can include labels for easy identification.
If enabled, filled FVGs (where price revisits the gap) are deleted to reduce chart clutter.
Settings
FVG Settings
Show Bullish FVGs: Enable/disable bullish FVG boxes (default: enabled).
Show Bearish FVGs: Enable/disable bearish FVG boxes (default: enabled).
Bullish FVG Color: Customize the color and transparency of bullish FVG boxes (default: light green).
Bearish FVG Color: Customize the color and transparency of bearish FVG boxes (default: light red).
Max FVG Boxes: Set the maximum number of FVG boxes displayed (default: 50, range: 1–500).
Extend FVG Boxes (Bars): Extend FVG boxes into the future by a specified number of bars (default: 8, range: 0–100).
Show FVG Labels: Enable/disable text labels on FVG boxes (default: enabled).
Label Size: Choose the size of FVG labels (options: Tiny, Small, Normal, Large, Huge; default: Small).
Delete Filled FVGs: Automatically remove FVGs when price fills the gap (default: enabled).
How to Use
Add the FVG-Bully Bears indicator to your TradingView chart.
Customize the settings to match your trading style (e.g., adjust colors, toggle labels, or change box extensions).
Watch for green (bullish) and red (bearish) FVG boxes:
Bullish FVGs: Potential support zones where price may bounce or consolidate.
Bearish FVGs: Potential resistance zones where price may reverse or stall.
Use FVGs in combination with other indicators (e.g., support/resistance, trendlines) for better trade decisions.
If “Delete Filled FVGs” is enabled, filled gaps will disappear, keeping your chart focused on active FVGs.
Ideal For
Swing Traders: Identify key price zones for entries or exits.
Day Traders: Spot intraday support/resistance levels created by rapid price moves.
Price Action Traders: Use FVGs to confirm market structure and potential reversal points.
Notes
For best performance, keep “Max FVG Boxes” at a reasonable value (e.g., 50) to avoid chart lag.
FVGs are most effective on lower timeframes (e.g., 5m, 15m, 1H) but can be used on any timeframe.
Combine with other tools like volume or trend indicators for a complete trading strategy.
Enjoy trading with FVG-Bully Bears and take advantage of Fair Valu

[MAD] FVG with LTF-POC/TPOOverview
The Fair Value Gap (FVG) Detector is a precision tool designed to automatically identify, draw, and track market inefficiencies. These gaps, also known as imbalances, often act as powerful magnets for future price action.
This indicator handles the entire lifecycle of an FVG: from its creation and extension, to the moment it is first touched, and through its entire mitigation process. To add an even deeper layer of analysis, it can now optionally plot two types of micro-analysis lines for the middle candle of the FVG pattern: a volume-based Point of Control (LTF-POC) and a time-based Time Price Opportunity (LTF-TPO). These high-precision lines pinpoint the most significant price levels within the imbalance itself.
By providing a clean and objective visualization of these critical price zones, the FVG Detector gives traders a clear framework for spotting high-probability setups and understanding how the market returns to areas of inefficiency to become balanced once again.
█ How It Works
The indicator’s logic is built on precise detection, dynamic visualization, and intelligent state tracking to provide a comprehensive view of market imbalances.
⚪ The FVG Detection Engine
At its core, the indicator uses a classic three-candle pattern to identify FVGs. This mechanical definition removes all subjectivity:
Bullish FVG: A gap is identified when the high of the first candle is lower than the low of the third candle. The space between these two prices creates the bullish FVG.
Bearish FVG: A gap is identified when the low of the first candle is higher than the high of the third candle. The space between these two prices creates the bearish FVG.
⚪ Dynamic Drawing and Mitigation
Once an FVG is detected, the indicator automatically draws a colored box to represent the gap. This box is then managed through its entire lifecycle:
Extension: If enabled, the FVG box extends forward in time with each new candle, acting as a visible, forward-looking zone of interest.
Partial Mitigation Trigger: The moment price first "touches" the gap, the box changes color to signal that it is no longer a fresh, unmitigated zone. The statistics table counts this as a "Partially Mitigated" event.
Shrinking FVG: As price moves further into the gap, the colored box dynamically shrinks, providing a real-time visual of how much of the imbalance has been filled.
Historical Outline: An optional secondary outline box is drawn to preserve the FVG's original size. This outline stops extending when the FVG is first touched, leaving a permanent historical marker.
⚪ Optional LTF Analysis for Added Precision
The indicator can look "inside" the FVG's middle candle to find its most significant price levels.
LTF-POC (Volume-Based): Using data from a lower timeframe, it analyzes the volume profile of the FVG-creating candle to find the single price level from the lower-timeframe bar with the highest trading volume.
LTF-TPO (Time-Based): It also identifies the Time Price Opportunity by dividing the candle's price range into distinct "bins." The script counts how many lower-timeframe price ticks occurred in each bin, and the TPO line is drawn at the center of the busiest bin.
Visual Confluence: These are drawn as distinct horizontal lines (defaulting to orange for POC and yellow for TPO) that extend and are managed alongside the FVG's historical outline, serving as precise levels of interest within the broader FVG zone.
█ Why This Indicator is Different
While many traders can spot FVGs manually, this indicator offers a significant edge through the possibility of the lowertimeframe analysis and showing the syntetic TPO or POCs for the relevant candles.
⚪ Automated and Objective
The market moves fast, and manually drawing FVGs is impractical and prone to error. This tool automates the entire process.
Never Miss a Gap: The detector impartially scans every three-candle sequence, ensuring no FVG is missed.
No Subjectivity: The rules for detection, mitigation, and LTF analysis are based on fixed mathematical models, removing subjective judgment.
Multi-Timeframe Clarity: The indicator works flawlessly on any timeframe, allowing you to maintain a consistent view of market structure.
⚪ Visualizing Market Memory
This tool does more than just draw boxes; it tells a story. Watching a box change color and shrink provides a visual of market dynamics in action. The optional historical outlines and LTF analysis lines build a "map" on your chart, showing where significant reactions and high-liquidity zones occurred in the past, which provides invaluable context for future price movements.
█ How to Use
⚪ Identifying High-Probability Zones
The primary use of the FVG Detector is to identify high-probability zones where price may react.
Entries: Unmitigated (fresh) FVGs can serve as powerful entry zones. Traders may look for price to return to a bullish FVG to take a long position, or to a bearish FVG to take a short position.
Targets: An FVG in your path can also act as a logical profit target. For example, if you are in a long position, you might take profit as price fills a nearby bearish FVG above you.
⚪ Confluence and Confirmation
FVGs are most powerful when they align with other forms of technical analysis. Look for FVGs that have "confluence" with:
Market Structure: A bullish FVG found at a key support level or after a bullish break of structure is a higher-probability setup.
Order Blocks: An FVG that overlaps with a bullish or bearish order block creates a very potent point of interest.
Premium/Discount Zones: FVGs found deep in a premium (for shorts) or discount (for longs) area of a trading range often yield strong reactions.
The LTF Lines (POC & TPO): Use these lines as a source of internal confluence. While the FVG gives you a zone, the POC and TPO give you precise levels within that zone. The POC shows where the highest volume was traded, while the TPO shows where price spent the most time. Confluence between these two lines can signal an extremely strong level.
█ Settings
Max Number of FVGs to Display: Controls how many active FVGs are kept on the chart to prevent clutter and maintain performance.
Extend Unmitigated FVGs: When enabled, FVG boxes will extend to the right until price touches them.
Show Bullish/Bearish FVGs: Toggles the visibility of bullish or bearish FVGs.
Show FVG Labels: Toggles the visibility of the "FVG" text labels.
Keep Mitigated Outlines: If checked, the historical outline box (and its associated POC/TPO lines) will remain on the chart even after the FVG is completely filled.
Show Statistics: Toggles the visibility of the statistics table, which tracks total, partly mitigated, and fully mitigated FVGs.
Show LTF-TPO (Time-Based): Toggles the calculation and display of the Time Price Opportunity line.
Show LTF-POC (Volume-Based): Toggles the calculation and display of the Point of Control line.
Use Custom LTF for Analysis: Check this to manually select a timeframe for the POC/TPO calculation. If unchecked, the script auto-selects a lower timeframe.
Lower Timeframe: The specific lower timeframe to use when the "Custom LTF" box is checked.
Magnifier (Bars per Slice): Controls how the script auto-selects a lower timeframe (higher number = lower timeframe). Only active when "Custom LTF" is unchecked.
█ The Logic Explained
This indicator uses a clear, rules-based system based on mathematical and conditional principles.
The 3-Candle FVG Pattern
The detection engine precisely identifies FVGs by comparing the price extremes of a three-candle sequence. For a bullish FVG, it confirms that the high of the first candle is strictly below the low of the third candle. For a bearish FVG, the low of the first candle must be strictly above the high of the third. This leaves an objective, unfilled gap in the market.
The Mitigation and Shrinking Process
Once an FVG is created, the indicator monitors it on every subsequent bar. The moment a candle's price action enters the FVG's zone, it's flagged as "partially mitigated," and its color changes. The script then continues to track how far price pushes into the gap, dynamically shrinking the box to visually represent the remaining imbalance.
Lower-Timeframe (LTF) Analysis Explained
To add precision, the indicator performs a micro-analysis of the middle candle of the FVG pattern. This is achieved by mathematically deconstructing that single candle using data from a smaller timeframe.
The lower timeframe is determined either manually or automatically via the Magnifier. The Magnifier works by dividing the chart's current timeframe. For example, on a 60-minute chart, a Magnifier of 60 tells the indicator to perform its analysis using 1-minute data (60÷60=1).
Once the LTF data is obtained, two calculations are performed:
LTF Point of Control (Volume-Based): This method seeks the price of maximum commitment. The indicator analyzes the volume of every single lower-timeframe bar within the main candle and identifies the one bar with the highest trading volume. The closing price of that specific high-volume bar is designated as the POC.
LTF Time Price Opportunity (Time-Based): This method finds the price where the market spent the most time trading. The process is a form of price distribution analysis:
The total price range (high to low) of the main candle is measured.
This range is divided into 40 equal price zones, or "bins". For a candle with a $2 range, each bin would represent a price slice of 5 cents
The indicator then counts how many of the lower-timeframe closing prices fall within each of the 40 bins.
The TPO line is drawn at the midpoint of the single bin that contained the most prices, representing the "busiest" price level.
Time-Based Drawing for Accuracy
To ensure perfect alignment across all historical data and chart reloads, all drawings are anchored to the precise timestamp of the bar, not its sequential position on the chart. This robust method guarantees that all zones remain fixed and accurate regardless of how much historical data is loaded.
█ Disclaimer
Investors are fully responsible for any investment decisions they make.
Have fun trading :-)
Fair Value MSThis indicator introduces rigid rules to familiar concepts to better capture and visualize Market Structure and Areas of Support and Resistance in a way that is both rule-based and reactive to market movements.
Typical "Market Structure" or "Zig-Zag" methods determine swing points based on fixed thresholds (length or percentage). While this does provide rigid structure, the results may be lagging or confusing due to the timing, since it is fixed to static parameters.
I believe the concept of Fair Value Gaps can solve this problem.
As you will notice, there are no length settings in this indicator.
> FVG Market Structure
Fair Value Gaps are a well known concept used to indicate directional intent, forming when price moves aggressively in one direction, leaving behind an imbalance between buyers and sellers. While the term FVG was popularized by ICT, the underlying concept predates them, known historically as imbalances, inefficiencies, or liquidity voids in institutional trading.
Note: For simplicity, in this indicator they'll be called FVGs.
By reading into this, we are able to clearly and rigidly define market structure simply by "looking" at the chart, using objective price events rather than subjective interpretation, or lengths.
By using FVGs to determine structure direction, the length, and speed of identification lies entirely on the market. If an FVG Down occurs immediately after a New Higher High forms, it is reasonable to assume there was a seller at that point, so the script would indicate a New Swing High.
The script is NOT stuck, waiting for a % retrace, or # bars to pass to identify it as such.
Sometimes the market is in a steady trend in a single direction and no FVGs form; therefore, no structure forms. -> Why would we try to impose structure on a clear trend?
Ultimately, the FVG Structure Method uses real reactions from the market to determine Market structure, and is not fixed to specific parameters.
As with other market structure indicators, "Market Structure Breaks" are still identifiable when price moves outside the most recent swing points.
These are helpful to indicate larger direction. In the following section you will see how these help us determine when we should start the search for an "Area of Interest (AOI)".
> Areas of Interest (AOIs)
"Area of Interest (AOI)" is a generalized term, and could refer to many types of zones you might recognize under different names. While the AOIs in this indicator are specialized in their own way, I have chosen to simply use the term "Area of Interest" because it’s more important to understand how they behave and why they exist than to focus on what they’re called.
The goal of an AOI is to point out reasonable areas where buyers or sellers may be staging, as is typical with support and resistance.
In order to reasonably identify these areas, we look for cause and effect relationships. When considering these relationships, it's easier to understand the placement of the points to define each zone.
(Buyer Examples)
Cause: Strong Buyers step in at Swing Low
Effect: Fair Value Gap Forms
Cause: Sustained Buying Pressure
Effect: Market Structure Breaks
In this example, The zone is drawn from the Swing Low, to the Bottom of the FVG closest to the swing point.
In theory, the participation at the swing point was strong and aggressive enough to create the FVG imbalance. Which then found acceptance and continued into a Market Structure Break. So with these AOIs, we are trying to locate the aggressive Buyers or Sellers which were positioned BEFORE the FVG.
These Zones are intended to act as areas to look for reactions from market participants, to judge where price may be going. When revisiting these zones, we look for a reaction or a break, to further provide us information to if the buyers or sellers are still there.
As seen in the screenshot above, The information we gain is not from the creation of these zones, but from the behavior we witness when these zones are revisited.
Technical Note: In this indicator, Market Structure Breaks are only considered when price closes outside the recent swing points. Wicks are not considered as confirmation, therefore are not used to detect structural breaks.
Inside each AOI you can optionally display a readout of the volume which accumulated during the time starting at the swing point and going until the closing bar of the FVG.
Note: We are counting volume until the closing bar of the FVG since the FVG is a 3 bar formation, and aggressive volume is required throughout to create the imbalance.
There are multiple FVGs that typically occur in a single direction, but we do not look to every single one to be indicative of structure, only the first FVG in the opposite direction of the previous direction (which is determined by previous FVGs)
You will probably notice, the AOIs do not form from the closest swing or FVG to the break, this is because we are targeting larger directional changes to draw these AOIs from.
Since they do not always happen perfectly every time, the AOI formation waits for an FVG to occur AND a Market structure break to happen. One without the other will result in no Zone displaying.
> Reflection Lines
While they may seem slightly redundant, Reflection Lines serve as reminders of previous support and resistance pivots. They are drawn at the same Pivots where and AOI is formed, and extend beyond the mitigation of the AOI.
These lines are often points of price to look for "Support Flips", a re-test pattern where price trades through previous support (or resistance) then returns to it and rejects, continuing into a larger move or trend.
Their namesake is based on the behavior of price, "reflecting" at these levels.
The Reflection lines are simple and change color based on price's location.
If price is above, we would typically look to a reflection line in with support in mind.
As a basic filter, these lines use an average price to determine their color, this way they will not change their color as frequently in choppy situations.
> Session Start/End Lines
For analysis purposes and trade review, it is helpful to analyze with context.
For that reason, I have implemented start and end session lines into the indicator, these are helpful when reviewing historical charts to not provide additional context.
By default, they are set to the NYSE Session, but can be changed to fit any needs.
These lines are not advanced, and simply draw a line as the chart passes the start and end of the sessions. It's very likely that you may need to adjust the session for your specific needs.
Note: The Timezone can be adjusted within the code if needed. By Default, the indicator uses "America/New_York" Timezone.
> Conclusion
If you’ve ever felt like your structure tools were confusing or lagging, drawing zones too late, or zones that simply don't make sense, this should feel like a breath of fresh air.
By removing arbitrary length settings and instead using FVGs to define structure and as a basis for AOIs, you're getting a more accurate look at what price is doing and where it's reacting from.
This indicator is rule-based, reactive, and aims to keep things logical without fluff or false confidence.
Enjoy!

Ultimate Market Structure [Alpha Extract]Ultimate Market Structure
A comprehensive market structure analysis tool that combines advanced swing point detection, imbalance zone identification, and intelligent break analysis to identify high-probability trading opportunities.Utilizing a sophisticated trend scoring system, this indicator classifies market conditions and provides clear signals for structure breaks, directional changes, and fair value gap detection with institutional-grade precision.
🔶 Advanced Swing Point Detection
Identifies pivot highs and lows using configurable lookback periods with optional close-based analysis for cleaner signals. The system automatically labels swing points as Higher Highs (HH), Lower Highs (LH), Higher Lows (HL), and Lower Lows (LL) while providing advanced classifications including "rising_high", "falling_high", "rising_low", "falling_low", "peak_high", and "valley_low" for nuanced market analysis.
swingHighPrice = useClosesForStructure ? ta.pivothigh(close, swingLength, swingLength) : ta.pivothigh(high, swingLength, swingLength)
swingLowPrice = useClosesForStructure ? ta.pivotlow(close, swingLength, swingLength) : ta.pivotlow(low, swingLength, swingLength)
classification = classifyStructurePoint(structureHighPrice, upperStructure, true)
significance = calculateSignificance(structureHighPrice, upperStructure, true)
🔶 Significance Scoring System
Each structure point receives a significance level on a 1-5 scale based on its distance from previous points, helping prioritize the most important levels. This intelligent scoring system ensures traders focus on the most meaningful structure breaks while filtering out minor noise.
🔶 Comprehensive Trend Analysis
Calculates momentum, strength, direction, and confidence levels using volatility-normalized price changes and multi-timeframe correlation. The system provides real-time trend state tracking with bullish (+1), bearish (-1), or neutral (0) direction assessment and 0-100 confidence scoring.
// Calculate trend momentum using rate of change and volatility
calculateTrendMomentum(lookback) =>
priceChange = (close - close ) / close * 100
avgVolatility = ta.atr(lookback) / close * 100
momentum = priceChange / (avgVolatility + 0.0001)
momentum
// Calculate trend strength using multiple timeframe correlation
calculateTrendStrength(shortPeriod, longPeriod) =>
shortMA = ta.sma(close, shortPeriod)
longMA = ta.sma(close, longPeriod)
separation = math.abs(shortMA - longMA) / longMA * 100
strength = separation * slopeAlignment
❓How It Works
🔶 Imbalance Zone Detection
Identifies Fair Value Gaps (FVGs) between consecutive candles where price gaps create unfilled areas. These zones are displayed as semi-transparent boxes with optional center line mitigation tracking, highlighting potential support and resistance levels where institutional players often react.
// Detect Fair Value Gaps
detectPriceImbalance() =>
currentHigh = high
currentLow = low
refHigh = high
refLow = low
if currentOpen > currentClose
if currentHigh - refLow < 0
upperBound = currentClose - (currentClose - refLow)
lowerBound = currentClose - (currentClose - currentHigh)
centerPoint = (upperBound + lowerBound) / 2
newZone = ImbalanceZone.new(
zoneBox = box.new(bar_index, upperBound, rightEdge, lowerBound,
bgcolor=bullishImbalanceColor, border_color=hiddenColor)
)
🔶 Structure Break Analysis
Determines Break of Structure (BOS) for trend continuation and Directional Change (DC) for trend reversals with advanced classification as "continuation", "reversal", or "neutral". The system compares pre-trend and post-trend states for each break, providing comprehensive trend change momentum analysis.
🔶 Intelligent Zone Management
Features partial mitigation tracking when price enters but doesn't fully fill zones, with automatic zone boundary adjustment during partial fills. Smart array management keeps only recent structure points for optimal performance while preventing duplicate signals from the same level.
🔶 Liquidity Zone Detection
Automatically identifies potential liquidity zones at key structure points for institutional trading analysis. The system tracks broken structure points and provides adaptive zone extension with configurable time-based limits for imbalance areas.
🔶 Visual Structure Mapping
Provides clear visual indicators including swing labels with color-coded significance levels, dashed lines connecting break points with BOS/DC labels, and break signals for continuation and reversal patterns. The adaptive zones feature smart management with automatic mitigation tracking.
🔶 Market Structure Interpretation
HH/HL patterns indicate bullish market structure with trend continuation likelihood, while LH/LL patterns signal bearish structure with downtrend continuation expected. BOS signals represent structure breaks in trend direction for continuation opportunities, while DC signals warn of potential reversals.
🔶 Performance Optimization
Automatic cleanup of old structure points (keeps last 8 points), recent break tracking (keeps last 5 break events), and efficient array management ensure smooth performance across all timeframes and market conditions.
Why Choose Ultimate Market Structure ?
This indicator provides traders with institutional-grade market structure analysis, combining multiple analytical approaches into one comprehensive tool. By identifying key structure levels, imbalance zones, and break patterns with advanced significance scoring, it helps traders understand market dynamics and position themselves for high-probability trade setups in alignment with smart money concepts. The sophisticated trend scoring system and intelligent zone management make it an essential tool for any serious trader looking to decode market structure with precision and confidence.

Fair Value Gap MTF [by Oberlunar]Fair Value Gap MTF is a multi-timeframe indicator designed to detect and display Fair Value Gaps (FVGs) across up to five customizable timeframes. Fair Value Gaps are price inefficiencies—zones where the market moved too quickly, leaving unfilled areas between candles. These gaps are often used by traders as reference points for future price retracements, as they tend to be revisited or “mitigated” over time.
This indicator extends the traditional FVG concept by introducing dynamic multi-timeframe tracking. Each timeframe has its own visual layer, with distinct user-defined colors for bullish and bearish gaps. The script not only highlights newly formed FVGs but also updates them visually when they are touched by price. Mitigated FVGs are recolored in real time, and an optional setting allows the size of these zones to shrink progressively, reflecting only the remaining untested portion.
Labels at the center of each box display the originating timeframe, offering clear visual context. All calculations are properly aligned with the display chart, ensuring that each FVG is correctly projected into the current view, regardless of its timeframe of origin.
Fair Value Gaps often act as support or resistance levels. Bullish FVGs can serve as areas where price may find support, while bearish FVGs can signal potential resistance. When these zones are mitigated repeatedly, it typically reflects areas of institutional interest, liquidity pools, or zones of accumulation and distribution. Such behavior makes them particularly significant in breakout and reversal strategies.
— Oberlunar 👁️★
Fair Value Gap Profiles [AlgoAlpha]🟠 OVERVIEW
This script draws and manages Fair Value Gap (FVG) zones by detecting unfilled gaps in price action and then augmenting them with intra-gap volume profiles from a lower timeframe. It is designed to help traders find potential areas where price may return to fill liquidity voids, and to provide extra detail about volume distribution inside each gap to assess strength and likely mitigation. The script automatically tracks each gap, updates its state over time, and can show which gaps are still unfilled or have been mitigated.
🟠 CONCEPTS
A Fair Value Gap is a zone between candles where no trades occurred, often seen as an inefficiency that price later revisits. The script checks each bar to see if a bullish (low above 2-bars-ago high) or bearish (high below 2-bars-ago low) gap has formed, and measures whether the gap’s size exceeds a threshold defined by a volatility-adjusted multiplier of past gap widths (to only detect significantly large gaps). Once a qualified gap is found, it gets recorded and visualized with a box that can stretch forward in time until filled. To add more context, a mini volume profile is built from a lower timeframe’s price and volume data, showing how volume is distributed inside the gap. The lowest-volume subzone is also highlighted using a sliding window scan method to visualise the true gap (area with least trading activity)
🟠 FEATURES
Visual gap boxes that appear automatically when bullish or bearish fair value gaps are detected on the chart.
Color-coded zones showing bullish gaps in one color and bearish gaps in another so you can easily see which side the gap favors.
Volume profile histograms plotted inside each gap using data from a lower timeframe, helping you see where volume concentrated inside the gap area.
Highlight of the lowest-volume subzone within each gap so you can spot areas price may target when filling the gap.
Dynamic extension of the gap boxes across the chart until price comes back and fills them, marking them as mitigated.
Customizable colors and transparency settings for gap boxes, profiles, and low-volume highlights to match your chart style.
Alerts that notify you when a new gap is created or when price fills an existing gap.
🟠 USAGE
This indicator helps you find and track unfilled price gaps that often act as magnets for price to revisit. You can use it to spot areas where liquidity may rest and plan entries or exits around these zones.
The colored gap boxes show you exactly where a fair value gap starts and ends, so you can anticipate potential pullbacks or continuations when price approaches them.
The intra-gap volume profile lets you gauge whether the gap was created on strong or thin participation, which can help judge how likely it is to be filled. The highlighted lowest-volume subzone shows where price might accelerate once inside the gap.
Traders often look for entries when price returns to a gap, aiming for a reaction or reversal in that area. You can also combine the mitigation alerts with your trade management to track when gaps have been closed and adjust your bias accordingly. Overall, the tool gives a clear visual reference for imbalance zones that can help structure trades around supply and demand dynamics.

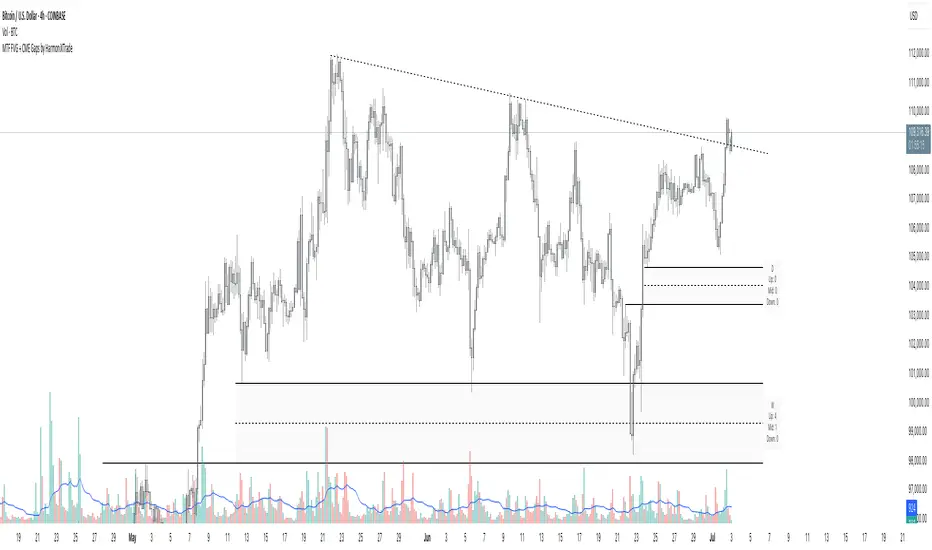
MTF FVG with Hit Counter HarmoniXTradeMain Purpose of the Indicator:
This indicator is designed to automatically identify Fair Value Gaps (FVG) across three different timeframes simultaneously. The primary goal is to display these key zones on the chart and provide detailed information about price interaction with these levels, enabling traders to make more informed decisions.
Key Features:
Multi-Timeframe FVG Identification:
By default, the indicator identifies and displays FVGs on the Weekly (W), Daily (D), and 4-Hour (240) timeframes.
Users can customize these timeframes in the settings to fit their preferences.
Detailed Hit Counter:
This indicator goes beyond simply showing FVGs; it accurately counts the number of times the price has touched each of the three key FVG levels:
Up: The top line of the FVG
Mid: The midline (equilibrium) of the FVG
Down: The bottom line of the FVG
This information is displayed in a clear label next to each FVG zone, helping traders assess the strength and validity of each level.
Extensive Customization:
Appearance: You can change the colors for bullish and bearish FVGs for each timeframe individually, modify the style of the main and mid lines, and adjust the label size.
Detection Logic: Users can define the minimum size of an FVG for detection based on a percentage or point value.
Mitigation Logic: Two methods are provided for FVG invalidation:
Percentage Mitigation: The FVG is considered mitigated after the price has penetrated it by a specific percentage (e.g., 50%).
Full Fill: The FVG remains valid until the price has completely filled the gap and closed beyond it.
Extend Lines Capability:
To prevent chart clutter and get a better view of future price action, you can extend the FVG lines and labels to the right by a specified number of bars, creating distance from the current candle.
How to Use This Indicator:
Identifying Support and Resistance Zones: FVG areas can act as strong support and resistance levels.
Confirming Entry Points: A price touch and reaction to one of the FVG levels (especially the midline) can be used as a confirmation for entering a trade.
Assessing Level Strength: The number of hits on each level (Up, Mid, Down) indicates which price point within the zone has been more attractive to the market. For example, repeated reactions to the top line of a bearish FVG might suggest strong selling pressure at that level.
Your Feedback for Improvement:
You are invited to use this indicator and share any suggestions, ideas for improvement, or reports of potential issues. Your feedback will be valuable for implementation in future versions.
FVG Trailing Stop [LuxAlgo]The FVG Trailing Stop indicator tracks unmitigated Fair Value Gaps (FVG) data to produce a Trailing Stop indicator able to determine if the market is uptrending or downtrending easily.
🔶 USAGE
The FVG Trailing Stop is intended to identify trend directions through its position relative to the closing price:
Bullish: Price is located above the Trailing Stop, indicating that all Bearish FVGs have been mitigated and the trend is anticipated to continue upwards.
Bearish State: Price is located below the Trailing Stop, indicating that all Bullish FVGs have been mitigated and the trend is anticipated to continue downwards.
The Trailing Stop originates from two extremities obtained from the average of respective unmitigated FVGs. The specific directional average is also displayed as a more transparent secondary line, however, the trailing stop is derived from this value and a new trend will not be detected until the opposite directional average is crossed.
Price reaching the Trailing Stop is caused by retracements and can lead to the following scenarios:
Outcome 1: The directional average is crossed next, indicating a new trend direction.
Outcome 2: The directional average is held as support or resistance, leading to a new impulse and a continuation of the trend.
🔹 Reset on Cross
While price crossing the Trailing Stop should be considered as a sign of an upcoming trend change; it is possible for the price to still evolve outside it.
As a solution, we have included the "Reset on Cross" feature, which (as the name suggests) hides and resets the Trailing Stop each time it is crossed, leading to a "Neutral" state.
This opens the opportunity for the Trailing Stop to be displayed again once the price moves again in the direction of the pre-established trend. A trader might use this to accumulate positions within a specific trend.
🔶 DETAILS
The script uses a typical identification method for FVGs. Once identified, the script collects the point of the FVG farthest from the current price when formed.
For Upwards FVGs this is the bottom of the FVG.
For Downwards FVGs this is the top of the FVG.
The data is managed only to use the last input lookback of FVGs. If an FVG is mitigated, it frees up a spot in the memory for a new FVG, however, if the lookback is full, the oldest will be deleted.
From there, it uses a "trailing" logic only to move the Trailing Stop in one direction until the trailing stop resets or the direction flips.
The extremities used to calculate the Trailing Stop are created from 2 calculation steps, the first step involves taking the raw average of the FVG mitigation levels, and the second step applies a simple moving average (SMA) smoothing of the precedent-obtained averages.
🔶 SETTINGS
Unmitigated FVG Lookback: Sets the maximum number of Unmitigated FVGs that the script will use.
Smoothing Length: Sets the smoothing length for the Trailing Stop to reduce erratic results.
Reset on Cross: When enabled, hide and reset the Trailing Stop until the price starts moving in the pre-established trend direction again.

FVG Premium [no1x]█ OVERVIEW
This indicator provides a comprehensive toolkit for identifying, visualizing, and tracking Fair Value Gaps (FVGs) across three distinct timeframes (current chart, a user-defined Medium Timeframe - MTF, and a user-defined High Timeframe - HTF). It is designed to offer traders enhanced insight into FVG dynamics through detailed state monitoring (formation, partial fill, full mitigation, midline touch), extensive visual customization for FVG representation, and a rich alert system for timely notifications on FVG-related events.
█ CONCEPTS
This indicator is built upon the core concept of Fair Value Gaps (FVGs) and their significance in price action analysis, offering a multi-layered approach to their detection and interpretation across different timeframes.
Fair Value Gaps (FVGs)
A Fair Value Gap (FVG), also known as an imbalance, represents a range in price delivery where one side of the market (buying or selling) was more aggressive, leaving an inefficiency or an "imbalance" in the price action. This concept is prominently featured within Smart Money Concepts (SMC) and Inner Circle Trader (ICT) methodologies, where such gaps are often interpreted as footprints left by "smart money" due to rapid, forceful price movements. These methodologies suggest that price may later revisit these FVG zones to rebalance a prior inefficiency or to seek liquidity before continuing its path. These gaps are typically identified by a three-bar pattern:
Bullish FVG : This is a three-candle formation where the second candle shows a strong upward move. The FVG is the space created between the high of the first candle (bottom of FVG) and the low of the third candle (top of FVG). This indicates a strong upward impulsive move.
Bearish FVG : This is a three-candle formation where the second candle shows a strong downward move. The FVG is the space created between the low of the first candle (top of FVG) and the high of the third candle (bottom of FVG). This indicates a strong downward impulsive move.
FVGs are often watched by traders as potential areas where price might return to "rebalance" or find support/resistance.
Multi-Timeframe (MTF) Analysis
The indicator extends FVG detection beyond the current chart's timeframe (Low Timeframe - LTF) to two higher user-defined timeframes: Medium Timeframe (MTF) and High Timeframe (HTF). This allows traders to:
Identify FVGs that might be significant on a broader market structure.
Observe how FVGs from different timeframes align or interact.
Gain a more comprehensive perspective on potential support and resistance zones.
FVG State and Lifecycle Management
The indicator actively tracks the lifecycle of each detected FVG:
Formation : The initial identification of an FVG.
Partial Fill (Entry) : When price enters but does not completely pass through the FVG. The indicator updates the "current" top/bottom of the FVG to reflect the filled portion.
Midline (Equilibrium) Touch : When price touches the 50% level of the FVG.
Full Mitigation : When price completely trades through the FVG, effectively "filling" or "rebalancing" the gap. The indicator records the mitigation time.
This state tracking is crucial for understanding how price interacts with these zones.
FVG Classification (Large FVG)
FVGs can be optionally classified as "Large FVGs" (LV) if their size (top to bottom range) exceeds a user-defined multiple of the Average True Range (ATR) for that FVG's timeframe. This helps distinguish FVGs that are significantly larger relative to recent volatility.
Visual Customization and Information Delivery
A key concept is providing extensive control over how FVGs are displayed. This control is achieved through a centralized set of visual parameters within the indicator, allowing users to configure numerous aspects (colors, line styles, visibility of boxes, midlines, mitigation lines, labels, etc.) for each timeframe. Additionally, an on-chart information panel summarizes the nearest unmitigated bullish and bearish FVG levels for each active timeframe, providing a quick glance at key price points.
█ FEATURES
This indicator offers a rich set of features designed to provide a highly customizable and comprehensive Fair Value Gap (FVG) analysis experience. Users can tailor the FVG detection, visual representation, and alerting mechanisms across three distinct timeframes: the current chart (Low Timeframe - LTF), a user-defined Medium Timeframe (MTF), and a user-defined High Timeframe (HTF).
Multi-Timeframe FVG Detection and Display
The core strength of this indicator lies in its ability to identify and display FVGs from not only the current chart's timeframe (LTF) but also from two higher, user-selectable timeframes (MTF and HTF).
Timeframe Selection: Users can specify the exact MTF (e.g., "60", "240") and HTF (e.g., "D", "W") through dedicated inputs in the "MTF (Medium Timeframe)" and "HTF (High Timeframe)" settings groups. The visibility of FVGs from these higher timeframes can be toggled independently using the "Show MTF FVGs" and "Show HTF FVGs" checkboxes.
Consistent Detection Logic: The FVG detection logic, based on the classic three-bar imbalance pattern detailed in the 'Concepts' section, is applied consistently across all selected timeframes (LTF, MTF, HTF)
Timeframe-Specific Visuals: Each timeframe's FVGs (LTF, MTF, HTF) can be customized with unique colors for bullish/bearish states and their mitigated counterparts. This allows for easy visual differentiation of FVGs originating from different market perspectives.
Comprehensive FVG Visualization Options
The indicator provides extensive control over how FVGs are visually represented on the chart for each timeframe (LTF, MTF, HTF).
FVG Boxes:
Visibility: Main FVG boxes can be shown or hidden per timeframe using the "Show FVG Boxes" (for LTF), "Show Boxes" (for MTF/HTF) inputs.
Color Customization: Colors for bullish, bearish, active, and mitigated FVG boxes (including Large FVGs, if classified) are fully customizable for each timeframe.
Box Extension & Length: FVG boxes can either be extended to the right indefinitely ("Extend Boxes Right") or set to a fixed length in bars ("Short Box Length" or "Box Length" equivalent inputs).
Box Labels: Optional labels can display the FVG's timeframe and fill percentage on the box. These labels are configurable for all timeframes (LTF, MTF, and HTF). Please note: If FVGs are positioned very close to each other on the chart, their respective labels may overlap. This can potentially lead to visual clutter, and it is a known behavior in the current version of the indicator.
Box Borders: Visibility, width, style (solid, dashed, dotted), and color of FVG box borders are customizable per timeframe.
Midlines (Equilibrium/EQ):
Visibility: The 50% level (midline or EQ) of FVGs can be shown or hidden for each timeframe.
Style Customization: Width, style, and color of the midline are customizable per timeframe. The indicator tracks if this midline has been touched by price.
Mitigation Lines:
Visibility: Mitigation lines (representing the FVG's opening level that needs to be breached for full mitigation) can be shown or hidden for each timeframe. If shown, these lines are always extended to the right.
Style Customization: Width, style, and color of the mitigation line are customizable per timeframe.
Mitigation Line Labels: Optional price labels can be displayed on mitigation lines, with a customizable horizontal bar offset for positioning. For optimal label placement, the following horizontal bar offsets are recommended: 4 for LTF, 8 for MTF, and 12 for HTF.
Persistence After Mitigation: Users can choose to keep mitigation lines visible even after an FVG is fully mitigated, with a distinct color for such lines. Importantly, this option is only effective if the general setting 'Hide Fully Mitigated FVGs' is disabled, as otherwise, the entire FVG and its lines will be removed upon mitigation.
FVG State Management and Behavior
The indicator tracks and visually responds to changes in FVG states.
Hide Fully Mitigated FVGs: This option, typically found in the indicator's general settings, allows users to automatically remove all visual elements of an FVG from the chart once price has fully mitigated it. This helps maintain chart clarity by focusing on active FVGs.
Partial Fill Visualization: When price enters an FVG, the indicator offers a dynamic visual representation: the portion of the FVG that has been filled is shown as a "mitigated box" (typically with a distinct color), while the original FVG box shrinks to clearly highlight the remaining, unfilled portion. This two-part display provides an immediate visual cue about how much of the FVG's imbalance has been addressed and what potential remains within the gap.
Visual Filtering by ATR Proximity: To help users focus on the most relevant price action, FVGs can be dynamically hidden if they are located further from the current price than a user-defined multiple of the Average True Range (ATR). This behavior is controlled by the "Filter Band Width (ATR Multiple)" input; setting this to zero disables the filter entirely, ensuring all detected FVGs remain visible regardless of their proximity to price.
Alternative Usage Example: Mitigation Lines as Key Support/Resistance Levels
For traders preferring a minimalist chart focused on key Fair Value Gap (FVG) levels, the indicator's visualization settings can be customized to display only FVG mitigation lines. This approach leverages these lines as potential support and resistance zones, reflecting areas where price might revisit to address imbalances.
To configure this view:
Disable FVG Boxes: Turn off "Show FVG Boxes" (for LTF) or "Show Boxes" (for MTF/HTF) for the desired timeframes.
Hide Midlines: Disable the visibility of the 50% FVG Midlines (Equilibrium/EQ).
Ensure Mitigation Lines are Visible: Keep "Mitigation Lines" enabled.
Retain All Mitigation Lines:
Disable the "Hide Fully Mitigated FVGs" option in the general settings.
Enable the feature to "keep mitigation lines visible even after an FVG is fully mitigated". This ensures lines from all FVGs (active or fully mitigated) remain on the chart, which is only effective if "Hide Fully Mitigated FVGs" is disabled.
This setup offers:
A Decluttered Chart: Focuses solely on the FVG opening levels.
Precise S/R Zones: Treats mitigation lines as specific points for potential price reactions.
Historical Level Analysis: Includes lines from past, fully mitigated FVGs for a comprehensive view of significant price levels.
For enhanced usability with this focused view, consider these optional additions:
The on-chart Information Panel can be activated to display a quick summary of the nearest unmitigated FVG levels.
Mitigation Line Labels can also be activated for clear price level identification. A customizable horizontal bar offset is available for positioning these labels; for example, offsets of 4 for LTF, 8 for MTF, and 12 for HTF can be effective.
FVG Classification (Large FVG)
This feature allows for distinguishing FVGs based on their size relative to market volatility.
Enable Classification: Users can enable "Classify FVG (Large FVG)" to identify FVGs that are significantly larger than average.
ATR-Based Threshold: An FVG is classified as "Large" if its height (price range) is greater than or equal to the Average True Range (ATR) of its timeframe multiplied by a user-defined "Large FVG Threshold (ATR Multiple)". The ATR period for this calculation is also configurable.
Dedicated Colors: Large FVGs (both bullish/bearish and active/mitigated) can be assigned unique colors, making them easily distinguishable on the chart.
Panel Icon: Large FVGs are marked with a special icon in the Info Panel.
Information Panel
An on-chart panel provides a quick summary of the nearest unmitigated FVG levels.
Visibility and Position: The panel can be shown/hidden and positioned in any of the nine standard locations on the chart (e.g., Top Right, Middle Center).
Content: It displays the price levels of the nearest unmitigated bullish and bearish FVGs for LTF, MTF (if active), and HTF (if active). It also indicates if these nearest FVGs are Large FVGs (if classification is enabled) using a selectable icon.
Styling: Text size, border color, header background/text colors, default text color, and "N/A" cell background color are customizable.
Highlighting: Background and text colors for the cells displaying the overall nearest bullish and bearish FVG levels (across all active timeframes) can be customized to draw attention to the most proximate FVG.
Comprehensive Alert System
The indicator offers a granular alert system for various FVG-related events, configurable for each timeframe (LTF, MTF, HTF) independently. Users can enable alerts for:
New FVG Formation: Separate alerts for new bullish and new bearish FVG formations.
FVG Entry/Partial Fill: Separate alerts for price entering a bullish FVG or a bearish FVG.
FVG Full Mitigation: Separate alerts for full mitigation of bullish and bearish FVGs.
FVG Midline (EQ) Touch: Separate alerts for price touching the midline of a bullish or bearish FVG.
Alert messages are detailed, providing information such as the timeframe, FVG type (bull/bear, Large FVG), relevant price levels, and timestamps.
█ NOTES
This section provides additional information regarding the indicator's usage, performance considerations, and potential interactions with the TradingView platform. Understanding these points can help users optimize their experience and troubleshoot effectively.
Performance and Resource Management
Maximum FVGs to Track : The "Max FVGs to Track" input (defaulting to 25) limits the number of FVG objects processed for each category (e.g., LTF Bullish, MTF Bearish). Increasing this value significantly can impact performance due to more objects being iterated over and potentially drawn, especially when multiple timeframes are active.
Drawing Object Limits : To manage performance, this script sets its own internal limits on the number of drawing objects it displays. While it allows for up to approximately 500 lines (max_lines_count=500) and 500 labels (max_labels_count=500), the number of FVG boxes is deliberately restricted to a maximum of 150 (max_boxes_count=150). This specific limit for boxes is a key performance consideration: displaying too many boxes can significantly slow down the indicator, and a very high number is often not essential for analysis. Enabling all visual elements for many FVGs across all three timeframes can cause the indicator to reach these internal limits, especially the stricter box limit
Optimization Strategies : To help you manage performance, reduce visual clutter, and avoid exceeding drawing limits when using this indicator, I recommend the following strategies:
Maintain or Lower FVG Tracking Count: The "Max FVGs to Track" input defaults to 25. I find this value generally sufficient for effective analysis and balanced performance. You can keep this default or consider reducing it further if you experience performance issues or prefer a less dense FVG display.
Utilize Proximity Filtering: I suggest activating the "Filter Band Width (ATR Multiple)" option (found under "General Settings") to display only those FVGs closer to the current price. From my experience, a value of 5 for the ATR multiple often provides a good starting point for balanced performance, but you should feel free to adjust this based on market volatility and your specific trading needs.
Hide Fully Mitigated FVGs: I strongly recommend enabling the "Hide Fully Mitigated FVGs" option. This setting automatically removes all visual elements of an FVG from the chart once it has been fully mitigated by price. Doing so significantly reduces the number of active drawing objects, lessens computational load, and helps maintain chart clarity by focusing only on active, relevant FVGs.
Disable FVG Display for Unused Timeframes: If you are not actively monitoring certain higher timeframes (MTF or HTF) for FVG analysis, I advise disabling their display by unchecking "Show MTF FVGs" or "Show HTF FVGs" respectively. This can provide a significant performance boost.
Simplify Visual Elements: For active FVGs, consider hiding less critical visual elements if they are not essential for your specific analysis. This could include box labels, borders, or even entire FVG boxes if, for example, only the mitigation lines are of interest for a particular timeframe.
Settings Changes and Platform Limits : This indicator is comprehensive and involves numerous calculations and drawings. When multiple settings are changed rapidly in quick succession, it is possible, on occasion, for TradingView to issue a "Runtime error: modify_study_limit_exceeding" or similar. This can cause the indicator to temporarily stop updating or display errors.
Recommended Approach : When adjusting settings, it is advisable to wait a brief moment (a few seconds) after each significant change. This allows the indicator to reprocess and update on the chart before another change is made
Error Recovery : Should such a runtime error occur, making a minor, different adjustment in the settings (e.g., toggling a checkbox off and then on again) and waiting briefly will typically allow the indicator to recover and resume correct operation. This behavior is related to platform limitations when handling complex scripts with many inputs and drawing objects.
Multi-Timeframe (MTF/HTF) Data and Behavior
HTF FVG Confirmation is Essential: : For an FVG from a higher timeframe (MTF or HTF) to be identified and displayed on your current chart (LTF), the three-bar pattern forming the FVG on that higher timeframe must consist of fully closed bars. The indicator does not draw speculative FVGs based on incomplete/forming bars from higher timeframes.
Data Retrieval and LTF Processing: The indicator may use techniques like lookahead = barmerge.lookahead_on for timely data retrieval from higher timeframes. However, the actual detection of an FVG occurs after all its constituent bars on the HTF have closed.
Appearance Timing on LTF (1 LTF Candle Delay): As a natural consequence of this, an FVG that is confirmed on an HTF (i.e., its third bar closes) will typically become visible on your LTF chart one LTF bar after its confirmation on the HTF.
Example: Assume an FVG forms on a 30-minute chart at 15:30 (i.e., with the close of the 30-minute bar that covers the 15:00-15:30 period). If you are monitoring this FVG on a 15-minute chart, the indicator will detect this newly formed 30-minute FVG while processing the data for the 15-minute bar that starts at 15:30 and closes at 15:45. Therefore, the 30-minute FVG will become visible on your 15-minute chart at the earliest by 15:45 (i.e., with the close of that relevant 15-minute LTF candle). This means the HTF FVG is reflected on the LTF chart with a delay equivalent to one LTF candle.
FVG Detection and Display Logic
Fair Value Gaps (FVGs) on the current chart timeframe (LTF) are detected based on barstate.isconfirmed. This means the three-bar pattern must be complete with closed bars before an FVG is identified. This confirmation method prevents FVGs from being prematurely identified on the forming bar.
Alerts
Alert Setup : To receive alerts from this indicator, you must first ensure you have enabled the specific alert conditions you are interested in within the indicator's own settings (see 'Comprehensive Alert System' under the 'FEATURES' section). Once configured, open TradingView's 'Create Alert' dialog. In the 'Condition' tab, select this indicator's name, and crucially, choose the 'Any alert() function call' option from the dropdown list. This setup allows the indicator to trigger alerts based on the precise event conditions you have activated in its settings
Alert Frequency : Alerts are designed to trigger once per bar close (alert.freq_once_per_bar_close) for the specific event.
User Interface (UI) Tips
Settings Group Icons: In the indicator settings menu, timeframe-specific groups are marked with star icons for easier navigation: 🌟 for LTF (Current Chart Timeframe), 🌟🌟 for MTF (Medium Timeframe), and 🌟🌟🌟 for HTF (High Timeframe).
Dependent Inputs: Some input settings are dependent on others being enabled. These dependencies are visually indicated in the settings menu using symbols like "↳" (dependent setting on the next line), "⟷" (mutually exclusive inline options), or "➜" (directly dependent inline option).
Settings Layout Overview: The indicator settings are organized into logical groups for ease of use. Key global display controls – such as toggles for MTF FVGs, HTF FVGs (along with their respective timeframe selectors), and the Information Panel – are conveniently located at the very top within the '⚙️ General Settings' group. This placement allows for quick access to frequently adjusted settings. Other sections provide detailed customization options for each timeframe (LTF, MTF, HTF), specific FVG components, and alert configurations.
█ FOR Pine Script® CODERS
This section provides a high-level overview of the FVG Premium indicator's internal architecture, data flow, and the interaction between its various library components. It is intended for Pine Script™ programmers who wish to understand the indicator's design, potentially extend its functionality, or learn from its structure.
System Architecture and Modular Design
The indicator is architected moduarly, leveraging several custom libraries to separate concerns and enhance code organization and reusability. Each library has a distinct responsibility:
FvgTypes: Serves as the foundational data definition layer. It defines core User-Defined Types (UDTs) like fvgObject (for storing all attributes of an FVG) and drawSettings (for visual configurations), along with enumerations like tfType.
CommonUtils: Provides utility functions for common tasks like mapping user string inputs (e.g., "Dashed" for line style) to their corresponding Pine Script™ constants (e.g., line.style_dashed) and formatting timeframe strings for display.
FvgCalculations: Contains the core logic for FVG detection (both LTF and MTF/HTF via requestMultiTFBarData), FVG classification (Large FVGs based on ATR), and checking FVG interactions with price (mitigation, partial fill).
FvgObject: Implements an object-oriented approach by attaching methods to the fvgObject UDT. These methods manage the entire visual lifecycle of an FVG on the chart, including drawing, updating based on state changes (e.g., mitigation), and deleting drawing objects. It's responsible for applying the visual configurations defined in drawSettings.
FvgPanel: Manages the creation and dynamic updates of the on-chart information panel, which displays key FVG levels.
The main indicator script acts as the orchestrator, initializing these libraries, managing user inputs, processing data flow between libraries, and handling the main event loop (bar updates) for FVG state management and alerts.
Core Data Flow and FVG Lifecycle Management
The general data flow and FVG lifecycle can be summarized as follows:
Input Processing: User inputs from the "Settings" dialog are read by the main indicator script. Visual style inputs (colors, line styles, etc.) are consolidated into a types.drawSettings object (defined in FvgTypes). Other inputs (timeframes, filter settings, alert toggles) control the behavior of different modules. CommonUtils assists in mapping some string inputs to Pine constants.
FVG Detection:
For the current chart timeframe (LTF), FvgCalculations.detectFvg() identifies potential FVGs based on bar patterns.
For MTF/HTF, the main indicator script calls FvgCalculations.requestMultiTFBarData() to fetch necessary bar data from higher timeframes, then FvgCalculations.detectMultiTFFvg() identifies FVGs.
Newly detected FVGs are instantiated as types.fvgObject and stored in arrays within the main script. These objects also undergo classification (e.g., Large FVG) by FvgCalculations.
State Update & Interaction: On each bar, the main indicator script iterates through active FVG objects to manage their state based on price interaction:
Initially, the main script calls FvgCalculations.fvgInteractionCheck() to efficiently determine if the current bar's price might be interacting with a given FVG.
If a potential interaction is flagged, the main script then invokes methods directly on the fvgObject instance (e.g., updateMitigation(), updatePartialFill(), checkMidlineTouch(), which are part of FvgObject).
These fvgObject methods are responsible for the detailed condition checking and the actual modification of the FVG's state. For instance, the updateMitigation() and updatePartialFill() methods internally utilize specific helper functions from FvgCalculations (like checkMitigation() and checkPartialMitigation()) to confirm the precise nature of the interaction before updating the fvgObject’s state fields (such as isMitigated, currentTop, currentBottom, or isMidlineTouched).
Visual Rendering:
The FvgObject.updateDrawings() method is called for each fvgObject. This method is central to drawing management; it creates, updates, or deletes chart drawings (boxes, lines, labels) based on the FVG's current state, its prev_* (previous bar state) fields for optimization, and the visual settings passed via the drawSettings object.
Information Panel Update: The main indicator script determines the nearest FVG levels, populates a panelData object (defined in FvgPanelLib), and calls FvgPanel.updatePanel() to refresh the on-chart display.
Alert Generation: Based on the updated FVG states and user-enabled alert settings, the main indicator script constructs and triggers alerts using Pine Script's alert() function."
Key Design Considerations
UDT-Centric Design: The fvgObject UDT is pivotal, acting as a stateful container for all information related to a single FVG. Most operations revolve around creating, updating, or querying these objects.
State Management: To optimize drawing updates and manage FVG lifecycles, fvgObject instances store their previous bar's state (e.g., prevIsVisible, prevCurrentTop). The FvgObject.updateDrawings() method uses this to determine if a redraw is necessary, minimizing redundant drawing calls.
Settings Object: A drawSettings object is populated once (or when inputs change) and passed to drawing functions. This avoids repeatedly reading numerous input() values on every bar or within loops, improving performance.
Dynamic Arrays for FVG Storage: Arrays are used to store collections of fvgObject instances, allowing for dynamic management (adding new FVGs, iterating for updates).

FvgCalculations█ OVERVIEW
This library provides the core calculation engine for identifying Fair Value Gaps (FVGs) across different timeframes and for processing their interaction with price. It includes functions to detect FVGs on both the current chart and higher timeframes, as well as to check for their full or partial mitigation.
█ CONCEPTS
The library's primary functions revolve around the concept of Fair Value Gaps and their lifecycle.
Fair Value Gap (FVG) Identification
An FVG, or imbalance, represents a price range where buying or selling pressure was significant enough to cause a rapid price movement, leaving an "inefficiency" in the market. This library identifies FVGs based on three-bar patterns:
Bullish FVG: Forms when the low of the current bar (bar 3) is higher than the high of the bar two periods prior (bar 1). The FVG is the space between the high of bar 1 and the low of bar 3.
Bearish FVG: Forms when the high of the current bar (bar 3) is lower than the low of the bar two periods prior (bar 1). The FVG is the space between the low of bar 1 and the high of bar 3.
The library provides distinct functions for detecting FVGs on the current (Low Timeframe - LTF) and specified higher timeframes (Medium Timeframe - MTF / High Timeframe - HTF).
FVG Mitigation
Mitigation refers to price revisiting an FVG.
Full Mitigation: An FVG is considered fully mitigated when price completely closes the gap. For a bullish FVG, this occurs if the current low price moves below or touches the FVG's bottom. For a bearish FVG, it occurs if the current high price moves above or touches the FVG's top.
Partial Mitigation (Entry/Fill): An FVG is partially mitigated when price enters the FVG's range but does not fully close it. The library tracks the extent of this fill. For a bullish FVG, if the current low price enters the FVG from above, that low becomes the new effective top of the remaining FVG. For a bearish FVG, if the current high price enters the FVG from below, that high becomes the new effective bottom of the remaining FVG.
FVG Interaction
This refers to any instance where the current bar's price range (high to low) touches or crosses into the currently unfilled portion of an active (visible and not fully mitigated) FVG.
Multi-Timeframe Data Acquisition
To detect FVGs on higher timeframes, specific historical bar data (high, low, and time of bars at indices and relative to the higher timeframe's last completed bar) is required. The requestMultiTFBarData function is designed to fetch this data efficiently.
█ CALCULATIONS AND USE
The functions in this library are typically used in a sequence to manage FVGs:
1. Data Retrieval (for MTF/HTF FVGs):
Call requestMultiTFBarData() with the desired higher timeframe string (e.g., "60", "D").
This returns a tuple of htfHigh1, htfLow1, htfTime1, htfHigh3, htfLow3, htfTime3.
2. FVG Detection:
For LTF FVGs: Call detectFvg() on each confirmed bar. It uses high , low, low , and high along with barstate.isconfirmed.
For MTF/HTF FVGs: Call detectMultiTFFvg() using the data obtained from requestMultiTFBarData().
Both detection functions return an fvgObject (defined in FvgTypes) if an FVG is found, otherwise na. They also can classify FVGs as "Large Volume" (LV) if classifyLV is true and the FVG size (top - bottom) relative to the tfAtr (Average True Range of the respective timeframe) meets the lvAtrMultiplier.
3. FVG State Updates (on each new bar for existing FVGs):
First, check for overall price interaction using fvgInteractionCheck(). This function determines if the current bar's high/low has touched or entered the FVG's currentTop or currentBottom.
If interaction occurs and the FVG is not already mitigated:
Call checkMitigation() to determine if the FVG has been fully mitigated by the current bar's currentHigh and currentLow. If true, the FVG's isMitigated status is updated.
If not fully mitigated, call checkPartialMitigation() to see if the price has further entered the FVG. This function returns the newLevel to which the FVG has been filled (e.g., currentLow for a bullish FVG, currentHigh for bearish). This newLevel is then used to update the FVG's currentTop or currentBottom.
The calling script (e.g., fvgMain.c) is responsible for storing and managing the array of fvgObject instances and passing them to these update functions.
█ NOTES
Bar State for LTF Detection: The detectFvg() function relies on barstate.isconfirmed to ensure FVG detection is based on closed bars, preventing FVGs from being detected prematurely on the currently forming bar.
Higher Timeframe Data (lookahead): The requestMultiTFBarData() function uses lookahead = barmerge.lookahead_on. This means it can access historical data from the higher timeframe that corresponds to the current bar on the chart, even if the higher timeframe bar has not officially closed. This is standard for multi-timeframe analysis aiming to plot historical HTF data accurately on a lower timeframe chart.
Parameter Typing: Functions like detectMultiTFFvg and detectFvg infer the type for boolean (classifyLV) and numeric (lvAtrMultiplier) parameters passed from the main script, while explicitly typed series parameters (like htfHigh1, currentAtr) expect series data.
fvgObject Dependency: The FVG detection functions return fvgObject instances, and fvgInteractionCheck takes an fvgObject as a parameter. This UDT is defined in the FvgTypes library, making it a dependency for using FvgCalculations.
ATR for LV Classification: The tfAtr (for MTF/HTF) and currentAtr (for LTF) parameters are expected to be the Average True Range values for the respective timeframes. These are used, if classifyLV is enabled, to determine if an FVG's size qualifies it as a "Large Volume" FVG based on the lvAtrMultiplier.
MTF/HTF FVG Appearance Timing: When displaying FVGs from a higher timeframe (MTF/HTF) on a lower timeframe (LTF) chart, users might observe that the most recent MTF/HTF FVG appears one LTF bar later compared to its appearance on a native MTF/HTF chart. This is an expected behavior due to the detection mechanism in `detectMultiTFFvg`. This function uses historical bar data from the MTF/HTF (specifically, data equivalent to `HTF_bar ` and `HTF_bar `) to identify an FVG. Therefore, all three bars forming the FVG on the MTF/HTF must be fully closed and have shifted into these historical index positions relative to the `request.security` call from the LTF chart before the FVG can be detected and displayed on the LTF. This ensures that the MTF/HTF FVG is identified based on confirmed, closed bars from the higher timeframe.
█ EXPORTED FUNCTIONS
requestMultiTFBarData(timeframe)
Requests historical bar data for specific previous bars from a specified higher timeframe.
It fetches H , L , T (for the bar before last) and H , L , T (for the bar three periods prior)
from the requested timeframe.
This is typically used to identify FVG patterns on MTF/HTF.
Parameters:
timeframe (simple string) : The higher timeframe to request data from (e.g., "60" for 1-hour, "D" for Daily).
Returns: A tuple containing: .
- htfHigh1 (series float): High of the bar at index 1 (one bar before the last completed bar on timeframe).
- htfLow1 (series float): Low of the bar at index 1.
- htfTime1 (series int) : Time of the bar at index 1.
- htfHigh3 (series float): High of the bar at index 3 (three bars before the last completed bar on timeframe).
- htfLow3 (series float): Low of the bar at index 3.
- htfTime3 (series int) : Time of the bar at index 3.
detectMultiTFFvg(htfHigh1, htfLow1, htfTime1, htfHigh3, htfLow3, htfTime3, tfAtr, classifyLV, lvAtrMultiplier, tfType)
Detects a Fair Value Gap (FVG) on a higher timeframe (MTF/HTF) using pre-fetched bar data.
Parameters:
htfHigh1 (float) : High of the first relevant bar (typically high ) from the higher timeframe.
htfLow1 (float) : Low of the first relevant bar (typically low ) from the higher timeframe.
htfTime1 (int) : Time of the first relevant bar (typically time ) from the higher timeframe.
htfHigh3 (float) : High of the third relevant bar (typically high ) from the higher timeframe.
htfLow3 (float) : Low of the third relevant bar (typically low ) from the higher timeframe.
htfTime3 (int) : Time of the third relevant bar (typically time ) from the higher timeframe.
tfAtr (float) : ATR value for the higher timeframe, used for Large Volume (LV) FVG classification.
classifyLV (bool) : If true, FVGs will be assessed to see if they qualify as Large Volume.
lvAtrMultiplier (float) : The ATR multiplier used to define if an FVG is Large Volume.
tfType (series tfType enum from no1x/FvgTypes/1) : The timeframe type (e.g., types.tfType.MTF, types.tfType.HTF) of the FVG being detected.
Returns: An fvgObject instance if an FVG is detected, otherwise na.
detectFvg(classifyLV, lvAtrMultiplier, currentAtr)
Detects a Fair Value Gap (FVG) on the current (LTF - Low Timeframe) chart.
Parameters:
classifyLV (bool) : If true, FVGs will be assessed to see if they qualify as Large Volume.
lvAtrMultiplier (float) : The ATR multiplier used to define if an FVG is Large Volume.
currentAtr (float) : ATR value for the current timeframe, used for LV FVG classification.
Returns: An fvgObject instance if an FVG is detected, otherwise na.
checkMitigation(isBullish, fvgTop, fvgBottom, currentHigh, currentLow)
Checks if an FVG has been fully mitigated by the current bar's price action.
Parameters:
isBullish (bool) : True if the FVG being checked is bullish, false if bearish.
fvgTop (float) : The top price level of the FVG.
fvgBottom (float) : The bottom price level of the FVG.
currentHigh (float) : The high price of the current bar.
currentLow (float) : The low price of the current bar.
Returns: True if the FVG is considered fully mitigated, false otherwise.
checkPartialMitigation(isBullish, currentBoxTop, currentBoxBottom, currentHigh, currentLow)
Checks for partial mitigation of an FVG by the current bar's price action.
It determines if the price has entered the FVG and returns the new fill level.
Parameters:
isBullish (bool) : True if the FVG being checked is bullish, false if bearish.
currentBoxTop (float) : The current top of the FVG box (this might have been adjusted by previous partial fills).
currentBoxBottom (float) : The current bottom of the FVG box (similarly, might be adjusted).
currentHigh (float) : The high price of the current bar.
currentLow (float) : The low price of the current bar.
Returns: The new price level to which the FVG has been filled (e.g., currentLow for a bullish FVG).
Returns na if no new partial fill occurred on this bar.
fvgInteractionCheck(fvg, highVal, lowVal)
Checks if the current bar's price interacts with the given FVG.
Interaction means the price touches or crosses into the FVG's
current (possibly partially filled) range.
Parameters:
fvg (fvgObject type from no1x/FvgTypes/1) : The FVG object to check.
Its isMitigated, isVisible, isBullish, currentTop, and currentBottom fields are used.
highVal (float) : The high price of the current bar.
lowVal (float) : The low price of the current bar.
Returns: True if price interacts with the FVG, false otherwise.

Balanced Price Range | Flux Charts💎 GENERAL OVERVIEW
Introducing our new Balanced Price Range (BPR) indicator! A Balanced Price Range is a trading concept used by price action traders. It is detected by finding overlapping area between two contrary Fair Value Gaps (FVGs). These areas can be used as entry points during market pullbacks. For more information about the process, please check the "HOW DOES IT WORK ?" section.
Balanced Price Range Features :
Balanced Price Range Detection : Identifies areas where bullish and bearish FVGs overlap, suggesting a zone of price equilibrium.
Customizable FVG & BPR Detection : You can fine-tune FVG detection and sensitivity for BPR detection to your liking.
Retest Labels : Bullish & Bearish retest labels will be rendered for BPRs.
Alerts : You can set alerts for Bullish & Bearish BPR detection and their retests.
🚩 UNIQUENESS
This indicator doesn't just detect standard FVGs but specifically looks for areas where bullish and bearish IFVGs (Invalidated Fair Value Gaps) overlap, defining a Balanced Price Range. It also actively manages and updates identified BPR zones, removing them when they are invalidated or remain untouched for a specified period. It highlights and alerts users to retests of established BPR zones, signaling potential trading opportunities. Users can tailor the appearance of the BPR zones and retest markers, as well as configure specific alerts for new BPR formations and retests.
📌 HOW DOES IT WORK ?
A Fair Value Gap generally occur when there is an imbalance in the market. They can be detected by specific formations within the chart. The indicator first detects bullish & bearish FVG zones according to their formations on chart. Then, they are dynamically tracked and flagged as invalidated if the price crosses them, turning them into IFVGs. When a FVG & IFVG of the same type overlaps, the indicator combines them into a single BPR of corresponding type. The detected BPR is updated as new data comes in, and renders retests labels as they occur. A bullish BPR can be used to find long trade entry opportunities, while a bearish BPR can be used to find short trade entry opportunities. Retests can also indicate potential movements in the corresponding direction of the BPR. Users can set-up alerts for BPR detection & BPR retests and will get notified as they occur.
⚙️ SETTINGS
Show Historic Zones: If enabled, invalidated or expired BPR zones will remain visible on the chart.
Balanced Price Range:
FVG Detection Method: Determines the criteria for the bar types forming the initial FVG.
Same: All three bars forming the FVG must be of the same type (all bullish or all bearish).
Mixed: The bar types must vary (a mix of bullish and bearish bars).
All: Bar types can vary or be the same.
FVG Invalidation Method: Determines which part of the candle (wick or close) invalidates the initial FVG.
BPR Invalidation Method: Determines which part of the candle (wick or close) invalidates the Balanced Price Range.
Sensitivity: Adjusts the sensitivity of FVG detection. Higher values may identify fewer, larger BPRs, while lower values may detect more, smaller BPRs.
Labels: Toggles the display of text labels on the identified zones.
Retests: Enables or disables the detection and visualization of BPR retests.

Time-Based Fair Value Gaps (FVG) with Inversions (iFVG)Overview
The Time-Based Fair Value Gaps (FVG) with Inversions (iFVG) (ICT/SMT) indicator is a specialized tool designed for traders using Inner Circle Trader (ICT) methodologies. Inspired by LuxAlgo's Fair Value Gap indicator, this script introduces significant enhancements by integrating ICT principles, focusing on precise time-based FVG detection, inversion tracking, and retest signals tailored for institutional trading strategies. Unlike LuxAlgo’s general FVG approach, this indicator filters FVGs within customizable 10-minute windows aligned with ICT’s macro timeframes and incorporates ICT-specific concepts like mitigation, liquidity grabs, and session-based gap prioritization.
This tool is optimized for 1–5 minute charts, though probably best for 1 minute charts, identifying bullish and bearish FVGs, tracking their mitigation into inverted FVGs (iFVGs) as key support/resistance zones, and generating retest signals with customizable “Close” or “Wick” confirmation. Features like ATR-based filtering, optional FVG labels, mitigation removal, and session-specific FVG detection (e.g., first FVG in AM/PM sessions) make it a powerful tool for ICT traders.
Originality and Improvements
While inspired by LuxAlgo’s FVG indicator (credit to LuxAlgo for their foundational work), this script significantly extends the original concept by:
1. Time-Based FVG Detection: Unlike LuxAlgo’s continuous FVG identification, this script filters FVGs within user-defined 10-minute windows each hour (:00–:10, :10–:20, etc.), aligning with ICT’s emphasis on specific periods of institutional activity, such as hourly opens/closes or kill zones (e.g., New York 7:00–11:00 AM EST). This ensures FVGs are relevant to high-probability ICT setups.
2. Session-Specific First FVG Option: A unique feature allows traders to display only the first FVG in ICT-defined AM (9:30–10:00 AM EST) or PM (1:30–2:00 PM EST) sessions, reflecting ICT’s focus on initial market imbalances during key liquidity events.
3. ICT-Driven Mitigation and Inversion Logic: The script tracks FVG mitigation (when price closes through a gap) and converts mitigated FVGs into iFVGs, which serve as ICT-style support/resistance zones. This aligns with ICT’s view that mitigated gaps become critical reversal points, unlike LuxAlgo’s simpler gap display.
4. Customizable Retest Signals: Retest signals for iFVGs are configurable for “Close” (conservative, requiring candle body confirmation) or “Wick” (faster, using highs/lows), catering to ICT traders’ need for precise entry timing during liquidity grabs or Judas swings.
5. ATR Filtering and Mitigation Removal: An optional ATR filter ensures only significant FVGs are displayed, reducing noise, while mitigation removal declutters the chart by removing filled gaps, aligning with ICT’s principle that mitigated gaps lose relevance unless inverted.
6. Timezone and Timeframe Safeguards: A timezone offset setting aligns FVG detection with EST for ICT’s New York-centric strategies, and a timeframe warning alerts users to avoid ≥1-hour charts, ensuring accuracy in time-based filtering.
These enhancements make the script a distinct tool that builds on LuxAlgo’s foundation while offering ICT traders a tailored, high-precision solution.
How It Works
FVG Detection
FVGs are identified when a candle’s low is higher than the high of two candles prior (bullish FVG) or a candle’s high is lower than the low of two candles prior (bearish FVG). Detection is restricted to:
• User-selected 10-minute windows (e.g., :00–:10, :50–:60) to capture ICT-relevant periods like hourly transitions.
• AM/PM session first FVGs (if enabled), focusing on 9:30–10:00 AM or 1:30–2:00 PM EST for key market opens.
An optional ATR filter (default: 0.25× ATR) ensures only gaps larger than the threshold are displayed, prioritizing significant imbalances.
Mitigation and Inversion
When price closes through an FVG (e.g., below a bullish FVG’s bottom), the FVG is mitigated and becomes an iFVG, plotted as a support/resistance zone. iFVGs are critical in ICT for identifying reversal points where institutional orders accumulate.
Retest Signals
The script generates signals when price retests an iFVG:
• Close: Triggers when the candle body confirms the retest (conservative, lower noise).
• Wick: Triggers when the candle’s high/low touches the iFVG (faster, higher sensitivity). Signals are visualized with triangular markers (▲ for bullish, ▼ for bearish) and can trigger alerts.
Visualization
• FVGs: Displayed as colored boxes (green for bullish, red for bearish) with optional “Bull FVG”/“Bear FVG” labels.
• iFVGs: Shown as extended boxes with dashed midlines, limited to the user-defined number of recent zones (default: 5).
• Mitigation Removal: Mitigated FVGs/iFVGs are removed (if enabled) to keep the chart clean.
How to Use
Recommended Settings
• Timeframe: Use 1–5 minute charts for precision, avoiding ≥1-hour timeframes (a warning label appears if misconfigured).
• Time Windows: Enable :00–:10 and :50–:60 for hourly open/close FVGs, or use the “Show only 1st presented FVG” option for AM/PM session focus.
• ATR Filter: Keep enabled (multiplier 0.25–0.5) for significant gaps; disable on 1-minute charts for more FVGs during volatility.
• Signal Preference: Use “Close” for conservative entries, “Wick” for aggressive setups.
• Timezone Offset: Set to -5 for EST (or -4 for EDT) to align with ICT’s New York session.
Trading Strategy
1. Macro Timeframes: Focus on New York (7:00–11:00 AM EST) or London (2:00–5:00 AM EST) kill zones for high institutional activity.
2. FVG Entries: Trade bullish FVGs as support in uptrends or bearish FVGs as resistance in downtrends, especially in :00–:10 or :50–:60 windows.
3. iFVG Retests: Enter on retest signals (▲/▼) during liquidity grabs or Judas swings, using “Close” for confirmation or “Wick” for speed.
4. Session FVGs: Use the “Show only 1st presented FVG” option to target the first gap in AM/PM sessions, often tied to ICT’s market maker algorithms.
5. Risk Management: Combine with ICT concepts like order blocks or breaker blocks for confluence, and set stops beyond FVG/iFVG boundaries.
Alerts
Set alerts for:
• “Bullish FVG Detected”/“Bearish FVG Detected”: New FVGs in selected windows.
• “Bullish Signal”/“Bearish Signal”: iFVG retest confirmations.
Settings Description
• Show Last (1–100, default: 5): Number of recent iFVGs to display. Lower values reduce clutter.
• Show only 1st presented FVG : Limits FVGs to the first in 9:30–10:00 AM or 1:30–2:00 PM EST sessions (overrides time window checkboxes).
• Time Window Checkboxes: Enable/disable FVG detection in 10-minute windows (:00–:10, :10–:20, etc.). All enabled by default.
• Signal Preference: “Close” (default) or “Wick” for iFVG retest signals.
• Use ATR Filter: Enables ATR-based size filtering (default: true).
• ATR Multiplier (0–∞, default: 0.25): Sets FVG size threshold (higher values = larger gaps).
• Remove Mitigated FVGs: Removes filled FVGs/iFVGs (default: true).
• Show FVG Labels: Displays “Bull FVG”/“Bear FVG” labels (default: true).
• Timezone Offset (-12 to 12, default: -5): Aligns time windows with EST.
• Colors: Customize bullish (green), bearish (red), and midline (gray) colors.
Why Use This Indicator?
This indicator empowers ICT traders with a tool that goes beyond generic FVG detection, offering precise, time-filtered gaps and inversion tracking aligned with institutional trading principles. By focusing on ICT’s macro timeframes, session-specific imbalances, and customizable signal logic, it provides a clear edge for scalping, swing trading, or reversal setups in high-liquidity markets.

Smarter Money Concepts - MTF IFVGs [PhenLabs]📊 Smarter Money Concepts - MTF IFVG
Version: PineScript™ v6
📌 Description
This multi-timeframe indicator identifies Inverse Fair Value Gaps (IFVGs) and their inversions across simultaneous chart intervals, helping traders spot liquidity voids and potential reversal zones. By analyzing price action through the lens of institutional order flow patterns, it solves the problem of manual gap tracking across timeframes while incorporating volatility-adjusted parameters and psychological level analysis for higher-probability setups.
🚀 Points of Innovation
• Multi-Timeframe Engine - Simultaneous analysis of 3 higher timeframes
• Adaptive Parameters - Auto-adjusts to market volatility conditions
• Quality Scoring System - Ranks gaps using RVI strength and size metrics
• Inversion Tracking - Monitors failed gaps for counter-trend signals
• Render Optimization - Prevents chart clutter with smart gap management
🔧 Core Components
FVG Detection Logic: Identifies gaps using customizable price source (Close/Wick)
Inversion Tracker: Manages failed gaps and generates counter signals
Multi-Timeframe Engine: Processes 3 independent higher timeframe analyses
Dashboard System: Real-time display of active gaps across all timeframes
🔥 Key Features
• Volatility-adjusted gap size filters (ATR-based)
• Customizable timeframe confluence analysis
• Color-coded quality scoring
• Non-repainting inversion signals
• Mobile-optimized visual rendering
🎨 Visualization
• Colored Boxes: Translucent zones show active gaps (green/bullish, red/bearish)
• Midline Plot: Dashed gray line marks gap midpoint for price targets
• Inversion Markers: Intense colors show failed gaps (dark red/bullish failure, bright green/bearish failure)
• HTF Differentiation: Higher timeframe gaps shown in blue/teal hues
📖 Usage Guidelines
Multi-Timeframe Settings
• Higher Timeframe 1
Default: 30 | Range: Any > Chart TF | Controls primary confluence timeframe
• Show All Timeframes
Default: True | Toggles multi-TF gap displays
Gap Settings
• Source
Default: Close | Options: | Determines gap measurement method
• RVI Period
Default: 14 | Range: 1-50 | Sets momentum confirmation sensitivity
• RVI Value
Default 0.1 | 0 to see all IFVGs | Increase min RVI to see the most powerful IFVGs
✅ Best Use Cases
• Identifying confluence across timeframes
• Spotting institutional order blocks
• High-probability reversal trading
• Trend continuation confirmation
• Volatility breakout setups
⚠️ Limitations
• Repaints historical gap zones
• Requires understanding of FVG concepts
• Higher timeframe data latency
• Quality scores rely on RVI/ATR settings
💡 What Makes This Unique
First FVG indicator with true multi-timeframe processing
Adaptive parameters that auto-adjust to volatility
Quantifiable quality scoring system
Professional-grade dashboard with HTF tracking
🔬 How It Works
Gap Detection: Identifies FVGs using price relationships and RVI confirmation
Inversion Tracking: Monitors price breaches to flag failed gaps
Quality Assessment: Scores gaps based on size, momentum, and location
Adaptive Filtering: Adjusts parameters using ATR-based volatility analysis
Multi-TF Synthesis: Correlates gaps across user-selected timeframes
Visual Rendering: Displays only relevant, active gaps to prevent clutter
💡 Note:
Start with default settings and gradually adjust parameters after observing market interactions. Focus on gaps with quality scores above 7 that align with higher timeframe trends. Combine with price action at psychological levels for highest-probability setups. Remember that higher timeframe gaps generally carry more significance than current chart gaps.

FVG# Fair Value Gap (FVG) Indicator
## Overview
The Fair Value Gap (FVG) indicator is a technical analysis tool designed to identify potential areas of price imbalance in the market. These imbalances, known as "fair value gaps," represent discontinuities in price movement where supply and demand were significantly imbalanced, potentially creating zones that price may return to in the future. This indicator was developed by Michele Amori for TradingView and operates as an overlay on price charts.
## Core Concept
Fair Value Gaps occur when price makes a significant move in one direction, leaving behind an area where no trading occurred. Specifically:
- **Bullish FVG**: Forms when the low of the current candle is higher than the high of the candle two positions back, creating an upward gap in price movement.
- **Bearish FVG**: Forms when the high of the current candle is lower than the low of the candle two positions back, creating a downward gap in price movement.
These gaps represent potential "fair value" areas that price may revisit to establish equilibrium between buyers and sellers.
## Visual Representation
The indicator displays FVGs in the following manner:
1. **Bullish FVGs**:
- Represented by semi-transparent green boxes
- Extend from the high of the candle two positions back to the low of the current candle
- Include a dashed green center line representing the middle point of the gap
2. **Bearish FVGs**:
- Represented by semi-transparent red boxes
- Extend from the low of the candle two positions back to the high of the current candle
- Include a dashed red center line representing the middle point of the gap
All FVG boxes and their center lines are extended to the right of the chart, making them visible until they are filled or invalidated.
## Invalidation Logic
The indicator automatically removes FVGs when they are considered filled or invalidated:
- **Bullish FVGs**: Removed when the closing price falls below the bottom of the FVG box, indicating that the upward gap has been filled.
- **Bearish FVGs**: Removed when the closing price rises above the top of the FVG box, indicating that the downward gap has been filled.
This removal only occurs after a candle is confirmed (fully formed), ensuring that premature invalidation doesn't occur during candle formation.
## Technical Implementation
The indicator uses arrays to store and manage the FVG boxes and their center lines. Key features of the implementation include:
- Creation of new FVGs only after candle confirmation
- Dynamic addition and removal of visual elements
- Transparent coloring (75% transparency) for better chart visibility
- Dashed center lines with less transparency (25%) to highlight the middle point of gaps

Multitimeframe Fair Value Gap – FVG (Zeiierman)█ Overview
The Multitimeframe Fair Value Gap – FVG (Zeiierman) indicator provides a dynamic and customizable visualization of institutional imbalances (Fair Value Gaps) across multiple timeframes. Built for traders who seek to analyze price inefficiencies, this tool helps highlight potential entry points, unmitigated gaps, and directional bias using smart volume logic and adaptive visual elements.
A Fair Value Gap (FVG) forms when there's a three-candle sequence in which a market imbalance leaves a "gap" between the wicks of candle 1 and candle 3. These areas are often considered footprints of institutional activity, and this indicator gives you the tools to track them with surgical precision across any timeframe you choose—regardless of the one you're viewing.
This indicator also includes a trend filter powered by a low-pass Butterworth filter, enabling traders to distinguish between countertrend vs. trend-aligned FVGs for more intelligent decision-making. On top of that, it features a dynamic FVG table for live tracking and bull/bear volume power visualization inside each gap, adding powerful clarity to market intent.
█ How It Works
The indicator analyzes the open, high, low, close, and volume of candles from a user-selected timeframe. It identifies Fair Value Gaps based on wick logic and only confirms those that meet customizable strength criteria. Once detected, the indicator visualizes each FVG with dynamically extending boxes, optional buy/sell volume bars, and a real-time mitigation check.
⚪ Multitimeframe Logic
Users can analyze FVGs from a higher or lower timeframe regardless of their current chart.
This is achieved using request.security() to fetch OHLCV data from the chosen timeframe.
⚪ Wick Sensitivity & Impulse Filter
The script measures the wick size of potential FVG candles and compares them to a running average. Only FVGs with wick sizes above a certain sensitivity threshold (user-controlled) are plotted. This ensures only meaningful price dislocations (e.g., strong impulsive moves) are shown, reducing noise.
⚪ Midpoint Mitigation Logic
FVGs are marked as "mitigated" when the price revisits the gap area. Traders can choose whether full gap closure or just a midpoint touch is required. This allows faster reactivity in real-time trading environments.
⚪ Bull & Bear Power – Volume-Weighted Visualization
Every Fair Value Gap box includes sub-bars representing the estimated buy and sell effort that created the gap. These are calculated using the candle's close in relation to its high/low range and volume:
Buy Volume % ≈ effort from low to close
Sell Volume % ≈ effort from high to close
Each sub-bar inside the FVG:
Is color-coded (UpCol for bullish, DnCol for bearish)
Is drawn proportionally to the strength of buyers or sellers
Visually displays who was in control during the imbalance
⚪ FVG Table – Dynamic On-Chart Overview
The indicator includes an optional on-chart table that displays all currently active (unmitigated) FVGs in a side panel format:
Automatic updates as gaps are formed and mitigated
Color-coded rows to show bullish vs. bearish FVGs
Timestamps to know precisely when the gap formed
User-controlled position via Table Left and Table Right
This is a gap watchlist overlay, giving traders a concise view of current inefficiencies without manually scanning the chart.
⚪ FVG Trend Filter (Butterworth Smoother)
Using a two-pole Butterworth low-pass filter, the indicator computes a trendline based on average FVG values, offering a smooth but responsive directional signal.
Passband Ripple (dB): Controls sensitivity and overshoot tolerance
Cutoff Frequency (0–0.5): Sets how quickly the trendline reacts
The trendline helps categorize each FVG:
Trend up → favor bullish FVGs
Trend down → favor bearish FVGs
It adds an extra dimension to FVG entries, helping distinguish between trend-aligned and countertrend signals.
█ How to Use
⚪ Identify Institutional Gaps
Use this tool to identify areas where institutions may have left imbalances behind quickly.
These areas often become:
Strong support/resistance zones
Areas where price might react sharply
Targets for liquidity sweeps or retracements
⚪ React to Trend or Countertrend
The built-in trendline helps categorize each FVG:
Trend up → Bullish FVGs have higher validity
Trend down → Bearish FVGs have higher validity
⚪ Volume Context via Bull/Bear Power
Each Fair Value Gap is more than just a price imbalance — it’s a story of effort and intent. The Bull/Bear Power feature visualizes the buy and sell pressure behind each FVG, helping you understand how the gap was formed and who was in control.
A bullish FVG with a strong buy effort suggests continuation potential — buyers dominated the move.
A bullish FVG with a dominant sell effort could signal a trap or reversal — sellers may have overwhelmed the breakout.
These insights allow you to confirm imbalance strength, spot traps early, and add confidence to entries based on dominant volume profiles.
Instead of viewing gaps as static zones, this feature turns each into a live volume map — a visual breakdown of who moved the market and whether that move had conviction.
⚪ Plan with the FVG Table
The FVG Table acts as your on-chart control center for tracking active imbalances. When enabled, it provides a clear summary of all unmitigated Fair Value Gaps, helping you stay organized and focused during fast-moving sessions.
Track live and historical gaps: See exactly when and where each FVG formed.
Monitor older, still-valid zones: Gaps off-screen but not mitigated remain in play — perfect for anticipating future reactions.
Gauge market bias at a glance: The balance of bullish vs. bearish FVGs helps you understand overall directional pressure.
Plan entries confidently: Use the table to reference all zones for risk management, confluence stacking, or layered execution strategies.
Instead of manually scanning your chart, the FVG Table offers a clean, at-a-glance overview of the market’s inefficiencies — giving you the structure needed to act with precision.
█ Settings
FVG Timeframe
Select any timeframe to source FVGs independent of your current chart.
Sensitivity
Filter FVGs by how impulsive the move is — it helps you eliminate weak gaps.
Mitigated on Mid
Control whether gaps are removed at midpoint touch or full fill.
Table Settings
Control the table position and width. Cleanly view all active FVGs.
FVG Style
Customize gap box colors, length, and bullish/bearish overlays.
Trend Filter
Enable or disable the smoothed FVG-based trendline with customizable smoothing controls.
-----------------
Disclaimer
The content provided in my scripts, indicators, ideas, algorithms, and systems is for educational and informational purposes only. It does not constitute financial advice, investment recommendations, or a solicitation to buy or sell any financial instruments. I will not accept liability for any loss or damage, including without limitation any loss of profit, which may arise directly or indirectly from the use of or reliance on such information.
All investments involve risk, and the past performance of a security, industry, sector, market, financial product, trading strategy, backtest, or individual's trading does not guarantee future results or returns. Investors are fully responsible for any investment decisions they make. Such decisions should be based solely on an evaluation of their financial circumstances, investment objectives, risk tolerance, and liquidity needs.

Radi IQ [TradingIQ]Introducing "Radi IQ".
Radi IQ is a comprehensive market structure indicator designed to provide traders with a detailed view of key price levels and market behavior. It combines several analytical methods—including internal and external structure analysis, fair value gaps, order blocks, breaker blocks, rejection blocks, premium discount zones, equal levels, directional liquidity grabs, and trend meters —to help users better understand areas of support and resistance, potential turning points, and liquidity events in the market.
Key Components and Their Functions
Market Structure Analysis
Internal and External Structure : The indicator evaluates market structure on two levels. The internal analysis focuses on immediate price action (e.g., recent support/resistance and swing points), while the external analysis uses a higher timeframe to provide context. This dual approach helps to confirm the strength of key levels by comparing short-term moves with the broader market trend.
Break of Structure (BoS) and Change of Character (CHoCH) : These signals highlight moments when the market shifts its behavior. A BoS indicates that a previous level of support or resistance has been overcome, while a CHoCH signals a change in the market’s character. Both are marked clearly on the chart using distinct color codes.
Break of Structure + (BoS+) and Change of Character + (CHoCH+) : These signals highlight moments when the market shifts its behavior and is confirmed by prior price action. A BoS + indicates that a previous level of support or resistance has been overcome, while price action achieves higher highs and higher lows (resistance break) or lower highs and lower lows (support break). CHoCH + signals a change in the market’s character when supported by prior price action - lower highs for a support break and higher lows for a resistance break.
BoS and CHoCH
The image above shows BoS and CHoCH identified on the price chart, and explains what each signifies.
A Break Of Structure (BoS) occurs when price decisively moves beyond a previously established support or resistance level. It indicates that the current trend or market pattern is being challenged, and the market may be ready to change direction.
A Change of Character (CHoCH) describes a shift in how the market behaves. A CHoCH occurs when, in an uptrend, a previously established support level breaks, or in a downtrend, a previously established resistance level breaks.
This break indicates that the market's typical structure is shifting, suggesting that the current trend may be losing its strength and that a reversal or a new trend could be developing.
CHoCH+
The image above explains CHoCH+ and how it forms, while highlighting an instance where a downside CHoCH+ formed following lower highs.
A Change of Character + (CHoCH+) describes a shift in how the market behaves that is supported by prior price action. For support breaks, price must form lower highs before breaking support.
The image above explains CHoCH+ for resistance breaks, while highlighting an instance where a resistance point broke that was supported by prior price action.
BoS+
The image above explains BoS+ and how it forms, while highlighting an instance where an upside BoS+ formed following higher highs and higher lows.
A BoS+ resistance break requires higher highs and higher lows prior to the resistance point being closed over.
The image above explains BoS+ support break, while highlighting an instance where a downside BoS+ formed following lower highs and lower lows.
A BoS+ support break requires lower highs and lower lows prior to the support point being closed under.
Future BoS and CHoCH
Radi IQ also displays where the next BoS and CHoCH points are located.
The image above shows the feature in action. With this, traders will always know where the next key support/resistance breakpoints are before they actually occur.
Fair Value Gaps (FVG)
The indicator identifies gaps in the price where little or no trading occurred—known as fair value gaps. These gaps can act as temporary support or resistance and may indicate areas where the market is likely to correct. FVGs are displayed with clear color gradients that differentiate between upward and downward gaps.
The image above shows an identified upside FVG. In the image, the identified upside FVG acted as a support point for price.
The image above shows an identified downside FVG. In the image, the identified downside FVG acted as a resistance point for price.
Low Volume FVG
In addition to identifying trading FVGs - Radi IQ can also specifically detect low volume fair value gaps. Ideally, these fair value gaps will form inside a low volume node on a volume profile.
Low volume node FVGs are important because these are areas where very little trading occurred and is confirmable, indicating an imbalance in supply and demand. Since few trades took place there, the market often moves quickly through these zones when revisited, which can lead to rapid price changes. This "gap" in trading activity can serve as a signal for potential reversals or fast moves, offering opportunities to enter or exit positions based on expected market behavior.
The image above shows identified FVGs that formed on low volume.
Large Area FVGs
Radi IQ is also capable of filtering out “inconsequential” FVGs. With this, Radi IQ can be enabled to only mark FVGs that cover a wide price range.
The image above shows the feature enabled, and all identified FVGs formed with a wide price range.
Large Area FVGs and Low Volume FVGs Combined
Traders can also enable Radi IQ to only mark FVGs that form on low volume and have a wide price range - allowing traders to only identify the highest quality FVGs on the chart.
Order Blocks and Premium Discount Zones
Order Blocks: Radi IQ detects areas where large orders have previously been placed by institutional traders. These blocks can act as strong levels of support or resistance, and the indicator marks bullish and bearish order blocks with dedicated colors.
What is an order block?
Order blocks are clusters of orders that institutions have executed to enter or exit a market position. They typically form when there is a period of consolidation before a significant move. For example, the last bullish candle before a strong down move may indicate a supply order block, while the last bearish candle before a sharp rally might be considered a demand order block.
Why They Form:
Institutions don’t trade in small, sporadic amounts; they accumulate or distribute large volumes of an asset. To avoid slippage and minimize market impact, they execute these orders over a zone rather than at a single price point. This creates a recognizable “block” on the chart.
Order Block Identification Types
Strength Score
The “Strength Score” order block detection mode is a TradingIQ proprietary ranking system for identified order blocks.
Purpose
The purpose of the “Strength Score” ranking system is to determine the “strength” or significance of an order block and rate the zone’s likelihood to act as support/resistance when retested in the future.
The scoring system ranks from 0 - 10, with “0” indicating a “weak” score or low likelihood of acting as a key support/resistance level when retested in the future.
A rating of “5” indicates a “moderate” score, indicating that the order block has a moderate likelihood of acting as a key support/resistance level when retested in the future.
A rating of “10” indicates a “strong” score, indicating that the order block has a strong likelihood of acting as a key support/resistance level when retested in the future.
How It Works
The score is calculated by examining the price move following the formation of an order block. The stronger the price move after an order block forms - the higher the Strength Score.
The image above shows a bearish order block with a score of “5” identified on the chart. The order block successfully operates as a resistance point when retested.
The image above shows a bullish order block with a score of “5” identified on the chart. The order block successfully operates as a resistance point when retested.
Volume-Based
The volume-based order block detection method detects traditional order blocks, but goes one step further by identifying the highest concentration point of volume for the bar and drawing the order block around this concentration point.
Key features when using the volume-based order block detection method:
The top of the order block is anchored to the top of the highest volume concentration point of the bar
The bottom of the order block is anchored to the bottom of the highest volume concentration point of the bar
The total volume that went into creation of the order block is displayed on the chart
The total volume of the order block is recorded as a percentage relative to the total volume for all order blocks on the chart
The image above shows the detection method in action.
Breaker Blocks
A breaker block is a specific type of order block that gains significance when price breaks through it and then often retests the level as a new area of support or resistance. Essentially, it’s a zone where, after the initial break, the previous level (which once acted as strong support or resistance) flips roles. For example, in an uptrend, if the price falls below a key support level, that level can become a breaker block and act as resistance if the price tries to move back up. Conversely, in a downtrend, a broken resistance level can serve as new support. Traders monitor breaker blocks because they often mark a shift in market sentiment and can provide potential entry or exit points once the market re-engages with these levels.
The image above shows a breaker block above price acting as resistance.
The image above shows a breaker block below price acting as support.
Rejection Blocks
A rejection block is a price area where the market shows a strong unwillingness to move beyond a certain level. This typically happens when price approaches a specific level but then is quickly rejected, leading to a bounce in the opposite direction. In other words, a rejection block forms when traders' orders create a barrier, causing the price to reverse rather than break through. Traders watch these areas closely, as they often signal a strong concentration of supply or demand that could provide potential entry or exit points for trades.
The image above shows both a verified upside rejection block acting as resistance, and an untested downside rejection block.
Rejection blocks are expected to function as strong support/resistance points when retested in the future.
Premium Discount Zones
Premium Discount Zones : These zones reflect areas where price is trading above (premium) or below (discount) a fair value range. They help traders gauge whether the current market price is relatively high or low compared to historical averages.
Premium Discount Zones account for recent swing highs and lows to calculate a fair value along with discount and premium prices over an intermediate time window.
The image above shows the premium and discount price zones in action.
Equal Levels
The indicator also tracks and highlights equal levels, which occur when the market repeatedly tests the same price levels. Equal levels can reinforce the significance of a support or resistance area and are represented by their own set of color markers.
The image above shows Radi IQ distinguishing equal highs and equal lows.
Equal Highs
When you see two or more highs that are approximately the same, it suggests that the market is repeatedly rejecting attempts to push higher. This signals a strong resistance level where sellers (or stop-hunters) are active.
Equal Lows
Similarly, consecutive lows at the same level indicate strong support, where buyers step in consistently, preventing further decline.
Strong Highs and Lows
Strong High
A strong high is a price level where the market repeatedly fails to push higher. Typically, it’s characterized by:
Rejection: Price approaches the high but then reverses sharply, often leaving long upper wicks on the candlestick chart.
Consolidation: Multiple bars might show highs that are very close in value (often termed "equal highs"), indicating a well-established resistance zone.
Market Sentiment: This pattern suggests that sellers are actively defending that level, preventing further upward movement.
Strong Lows
Conversely, a strong low is a price level where the market repeatedly fails to break lower. It is identified by:
Bounce Back: Price touches the low and then rebounds sharply, often leaving long lower wicks.
Consistency: Multiple lows occur around the same level (sometimes referred to as "equal lows"), marking a solid support area.
Market Sentiment: This indicates that buyers are stepping in at that level, absorbing selling pressure and supporting the price.
The image above shows Radi IQ detecting both a strong high and strong low, while the detected strong low acts as support when retested.
Liquidity Grabs
Liquidity grabs occur when the market temporarily moves to absorb liquidity, often triggering stop-loss orders and leading to rapid price movements. Radi IQ flags these events by identifying conditions where price moves against recent pivots, helping traders spot potential liquidity-related reversals or breakouts.
The image above shows Radi IQ identifying both an upside liquidity grab and a downside liquidity grab.
Upside Liquidity Grab (Bearish)
An upside liquidity grab happens when the price moves above a well-known resistance area or recent high. This move is often short-lived.
Many traders place stop-loss orders or pending buy orders just above resistance levels. Institutional players may intentionally push price upward to trigger these orders, thereby “grabbing” the liquidity available at that level.
Downside Liquidity Grab (Bullish)
A downside liquidity grab is the mirror image: the price briefly dips below a key support level or recent low.
Traders often place stop-loss orders or pending sell orders just below support levels. An intentional drop below this support can trigger these stops, allowing institutional players to capture liquidity.
Multi-Timeframe Analysis and Swings
By using data from different timeframes, Radi IQ offers a broader perspective on market trends. It highlights significant swing highs and swing lows, providing visual cues that indicate the market’s directional bias. This feature assists traders in identifying both short-term opportunities and long-term trends.
The image above shows Radi IQ detecting higher swings and lower swings.
IQ Meters / Fibometer
IQ Meters (Fibometers) are a proprietary TradingIQ tool that allows traders to easily identify the highs and lows of the current trend and where current price is relative to these points.
The image above depicts the IQ Meters—an exclusive TradingIQ tool designed to help traders evaluate trend strength and retracement opportunities.
When the lower timeframe Zig Zag IQ and the higher timeframe Zig Zag IQ are out of sync (i.e., one is uptrending while the other is downtrending, with no active positions), the meters display a neutral color as shown in the image.
The key to using these meters is to identify trend unison and pinpoint key trend retracement entry opportunities. Fibonacci retracement levels for the current trend are interlaced along each meter, and the current price is converted to a retracement ratio of the trend.
These meters can mathematically determine where price stands relative to the larger and smaller trends, aiding in identifying entry opportunities.
The top of each meter indicates the highest price achieved during the current price move.
The bottom of each meter indicates the lowest price achieved during the current price move.
When both the larger and smaller trends are in sync and uptrending, or when a long position is active, the IQ meters turn green, indicating uptrend strength.
When both meters are green, it indicates uptrend strength as both the higher timeframe trend and lower timeframe trend are in unison. Look for price to retrace to key fibonacci retracement levels during this time period.
When both trends are in sync and downtrending, or when a short position is active, the IQ meters turn red, indicating downtrend strength.
When both meters are red, it indicates downtrend strength as both the higher timeframe trend and lower timeframe trend are in unison. Look for price to retrace to key fibonacci retracement levels during this time period.
Summary
Radi IQ serves as a robust, data-driven tool for traders who seek a deeper understanding of market structure. By integrating internal and external analysis, fair value gap detection, order block identification, premium discount zoning, equal level tracking, liquidity grabs and much more into one indicator, it offers a multi-layered view of the market. This helps traders not only recognize potential turning points and areas of market stress but also manage risk more effectively and plan their trades with greater precision. The indicator’s clear visual representation and dynamic updates make it a practical addition to any trader’s toolkit.
Skrip berbayar
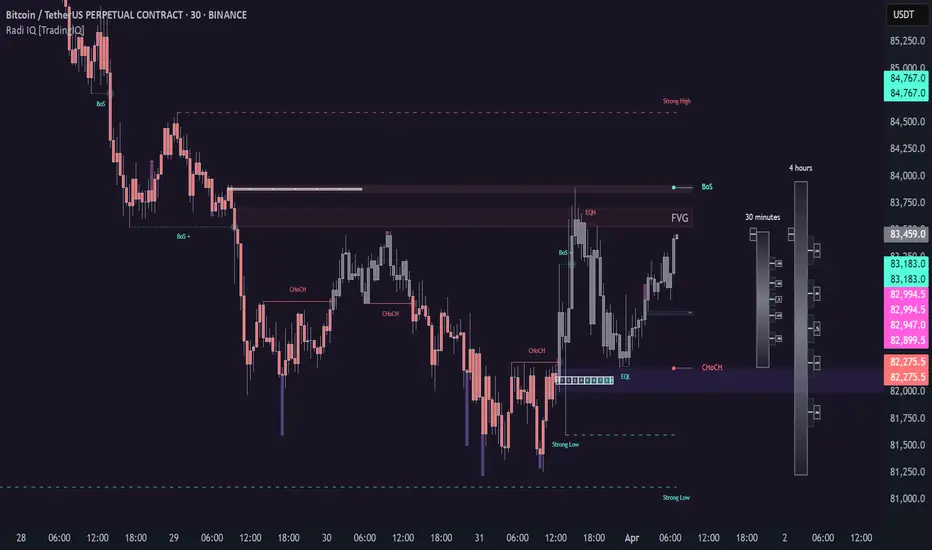
Fair Value Gap Finder [Find Better Trades]Fair Value Gap Finder (FVG) – Spot Institutional Imbalances
📈 Identify Key Market Imbalances
The Fair Value Gap Finder automatically detects price inefficiencies where aggressive buying or selling has created an imbalance in liquidity. These gaps, often left by institutional traders, can serve as key areas for price to revisit before continuing its trend.
🔍 How It Works:
Highlights bullish Fair Value Gaps (FVGs) in green, signaling potential support zones.
Highlights bearish Fair Value Gaps (FVGs) in red, signaling potential resistance zones.
Uses ATR-based filtering to eliminate small, insignificant gaps, focusing only on high-probability setups.
Alerts included! Get notified when a valid Fair Value Gap is detected.
📊 How to Trade Using FVGs:
✅ For Buy Trades: Wait for price to return to a bullish FVG and confirm support before entering long.
✅ For Sell Trades: Wait for price to revisit a bearish FVG and confirm resistance before entering short.
✅ Use with candlestick patterns, trend analysis, or volume for additional confirmation.
⚙️ Customizable Settings:
Adjust the ATR Multiplier to control how large a gap must be before triggering a signal.
Enable alerts to stay informed in real time when new FVGs appear.
💡 Why Use This Indicator?
Fair Value Gaps are widely used by professional traders to spot areas of liquidity, making them valuable for scalping, swing trading, and institutional-style trading.
🚀 Add it to your TradingView chart and start trading with precision!

Fair Value Gap FinderFunctionality
Detection of Fair Value Gaps:
A bullish Fair Value Gap (FVG Up) is identified when the low of two candles before the current bar (low ) is greater than the high of the current bar (high ).
A bearish Fair Value Gap (FVG Down) is identified when the high of two candles before the current bar (high ) is lower than the low of the current bar (low ).
Color Coding:
Bullish Fair Value Gaps are highlighted in green to indicate potential areas of support.
Bearish Fair Value Gaps are highlighted in red to indicate potential areas of resistance.
Visualization Using Rectangles:
If an FVG is detected, the script creates a rectangle spanning a fixed number of bars (right=bar_index+5) to visualize the price inefficiency.
The rectangle extends from the upper to the lower boundary of the gap and has a semi-transparent fill (bgcolor=color.new(color, 90)) for better readability.
Implementation Details
Variable Initialization: The script defines floating-point variables (fvgUpTop, fvgUpBottom, fvgDownTop, fvgDownBottom) to store the price levels of identified gaps.
Conditional Assignments: When an FVG is detected, the corresponding top and bottom boundaries are assigned to the respective variables.
Box Creation: The box.new function is used to draw a rectangle on the chart, marking the FVG zones for better visualization.
