True Breakout Pattern [TradingFinder] Breakout Signal Indicator🔵 Introduction
In many market conditions, what initially appears to be a decisive breakout often turns out to be nothing more than a false breakout or fake breakout. Price breaks through a key swing level or an important support and resistance zone, only to quickly return to its previous range.
These failed breakouts, which are often the result of liquidity traps or market manipulation, serve more as a warning sign of structural weakness than confirmation of a new trend.
This indicator is designed around the concept of the fake breakout.
The logic is simple but precise : when price breaks a swing level and returns to that level within a maximum of five candles, the move is considered a false breakout. At this point, a Fibonacci retracement is applied to the recent price swing to evaluate the pullback area.
If price, within ten candles after the return to the breakout level, enters the Fibonacci zone between 0.618 and 1.0, the setup becomes valid for a potential entry. This area is identified as a long entry zone, with the stop loss placed just beyond the 1.0 level and the take profit defined based on the desired risk-to-reward ratio.
By combining accurate detection of false breakouts, analysis of price reaction to swing levels, and alignment with Fibonacci retracement logic, this framework allows traders to identify opportunities often missed by others. In a market where failed breakouts are a common and recurring phenomenon, this indicator aims to transform these traps into measurable trading opportunities.
Long Setup :
Short Setup :
🔵 How to Use
This indicator operates based on the recognition of false breakouts from structural levels in the market, specifically swing levels, and combines that with Fibonacci retracement analysis.
In this strategy, trades are only considered when price returns to the broken level within a defined time window and reacts appropriately inside a predefined Fibonacci range. Depending on the direction of the initial breakout, the system outlines two scenarios for long and short setups.
🟣 Long Setup
In the long setup, price initially breaks below a support level or swing low. If the price returns to the broken level within a maximum of five candles, the move is identified as a fake breakout.
At this stage, a Fibonacci retracement is drawn from the recent high to the low. If price, within ten candles of returning to the level, moves into the 0.618 to 1.0 Fibonacci zone, the conditions for a long entry are met.
The stop loss is placed slightly below the 1.0 level, while the take profit is set based on the trader’s preferred risk-reward ratio. This setup aims to capture deeply discounted entries at low risk, aligned with smart money reversals.
🟣 Short Setup
In the short setup, the price breaks above a resistance level or swing high. If the price returns to that level within five candles, the move is again treated as a false breakout. Fibonacci is then drawn from the recent low to the high to observe the retracement area.
Should price enter the 0.618 to 1.0 Fibonacci range within ten candles of returning, a short entry is considered valid. In this case, the stop loss is placed just above the 1.0 level, and the take profit is adjusted based on the intended risk-reward target. This method allows traders to identify high-probability short setups by focusing on failed breakouts and deep pullbacks.
🔵 Settings
🟣 Logical settings
Swing period : You can set the swing detection period.
Valid After Trigger Bars : Limits how many candles after a fake breakout the entry zone remains valid.
Max Swing Back Method : It is in two modes "All" and "Custom". If it is in "All" mode, it will check all swings, and if it is in "Custom" mode, it will check the swings to the extent you determine.
Max Swing Back : You can set the number of swings that will go back for checking.
🟣 Display settings
Displaying or not displaying swings and setting the color of labels and lines.
🟣 Alert Settings
Alert False Breakout : Enables alerts for Breakout.
Message Frequency : Determines the frequency of alerts. Options include 'All' (every function call), 'Once Per Bar' (first call within the bar), and 'Once Per Bar Close' (final script execution of the real-time bar). Default is 'Once per Bar'.
Show Alert Time by Time Zone : Configures the time zone for alert messages. Default is 'UTC'.
🔵 Conclusion
A sound understanding of the false breakout phenomenon and its relationship to structural price behavior is essential for technical traders aiming to improve precision and consistency. Many poor trading decisions stem from misinterpreting failed breakouts and entering too early into weak signals.
A structured approach, grounded in the analysis of swing levels and validated through specific price action and timing rules, can turn these misleading moves into valuable trade opportunities.
This indicator, by combining fake breakout detection with time filters and Fibonacci-based retracement zones, helps traders only engage with the market when multiple confirming factors are in alignment. The result is a strategy that emphasizes probability, risk control, and clarity in decision-making, offering a solid edge in navigating today’s volatile markets.
Fakeout

Real Time Swing Trap DetectorThe Real Time Swing Trap Detector is a minimalist, pro-grade tool for instantly spotting classic “bull traps” and “bear traps” on any chart.
This indicator identifies swing traps in real time by tracking significant swing highs and lows, then watching for fast, false breakouts (bull traps) and breakdowns (bear traps) within a user-defined window.
How it works:
Detects when price breaks a major swing high/low (using configurable lookback).
If price quickly reclaims the broken level within X bars (trap window), a trap is confirmed and a subtle icon (🐂 for bull, 🐻 for bear) is displayed on the chart—no labels, no clutter.
You can enable/disable alerts for bull/bear traps individually or together, and receive notifications the moment a trap is detected.
Use cases:
Spot and avoid classic market “fakeouts” that trap breakout traders.
Confirm SMC/ICT “Judas swing” setups, or filter for high-probability reversals.
Works on all timeframes and assets: stocks, crypto, forex, indices.
Inputs:
Swing Lookback Bars: How far back to define swing points (default: 50)
Major Swing Filter: Additional filter for only the most significant highs/lows (default: 200)
Trap Bars (Look Ahead): Window in which a trap must be confirmed (default: 10)
Enable Bull/Bear Trap Alerts: Toggle real-time alerts for each trap type.
Visuals:
🐻 icon below bar for bear trap (short squeeze/reversal)
🐂 icon above bar for bull trap (long squeeze/reversal)
How to set up alerts:
Add the indicator to your chart, open TradingView’s Alerts panel, and choose “Bear Trap Alert,” “Bull Trap Alert,” or “Any Trap Alert” for instant notifications.
Price Step Channel [BigBeluga]Price Step Channel is designed to provide a structured look at price trends through a dynamic step line channel, highlighting trend direction and volatility boundaries.
🔵 Key Features:
Step Line with Boundaries: The central step line adjusts with price movements, creating upper and lower boundaries based on price volatility. The channel is green during uptrends and red during downtrends, visually signaling the trend’s direction.
Fakeout Markers: "✖" markers identify potential fakeouts—moments when the price breaches the channel boundary without confirming a trend change. These markers help you spot possible mean reversion points.
Dynamic Boundary Labels: Labels at the end of the channel show the price levels of the upper and lower boundaries. In uptrends, the upper label turns green; in downtrends, the lower label turns red, providing an instant read on the trend's direction.
Customizable Display: You can toggle off the boundaries and labels for a cleaner view, focusing only on the step line and its color-coded trend signals.
🔵 When to Use:
Price Step Channel is ideal for traders looking to follow structured trends with defined volatility boundaries. The step line and color-coded channel provide clear trend insights, while the fakeout markers and customizable display options enhance flexibility in different market conditions. Whether you’re focusing on clean trend signals or detailed boundary interactions, this tool adapts to your style.

Half-Trend Channel [BigBeluga]Half Trend Channel is a powerful trend-following indicator designed to identify trend direction, fakeouts, and potential reversal points. The combination of upper/lower bands, midline coloring, and specific signals makes it ideal for spotting trend continuation and market reversals.
The base of the channel is calculated using smoothed half-trend logic.
// Initialize half trend on the first bar
if barstate.isfirst
hl_t := close
// Update half trend value based on conditions
switch
closeMA < hl_t and highestHigh < hl_t => hl_t := highestHigh
closeMA > hl_t and lowestLow > hl_t => hl_t := lowestLow
=> hl_t := hl_t
// Smooth
float s_hlt = ta.hma(hl_t, len)
🔵 Key Features:
Upper and Lower Bands:
The bands adapt dynamically to market volatility.
Price movements toward the bands help identify areas of overextension and potential reversal points.
Midline Trend Signal:
The midline changes color to reflect the current trend:
Green Midline: Indicates an uptrend.
Purple Midline: Signals a downtrend.
Fakeout Signals ("X"):
"X" markers appear when price briefly breaches the outer bands but fails to sustain the move.
Fakeouts help traders identify areas where price momentum weakens.
Reversal Signals (Triangles):
Triangles (▲ and ▼) mark potential tops and bottoms:
▲ Up Triangles: Suggest a potential bottom and a reversal to the upside.
▼ Down Triangles: Indicate a potential top and a reversal to the downside.
Dynamic Trend Labels:
At the last bar, the indicator displays labels like "Trend Up" or "Trend Dn" , reflecting the current trend direction.
🔵 Usage:
Use the colored midline to determine the overall trend direction.
Monitor "X" fakeout signals to spot failed breakouts or momentum exhaustion near the bands.
Watch for reversal triangles (▲ and ▼) to identify potential trend reversals at tops or bottoms.
Combine the bands and midline signals to confirm trade entries and exits:
Enter long trades when price bounces off the lower band with a green midline.
Consider short trades when price reverses from the upper band with a purple midline.
Use the trend label (e.g., "Trend Up" or "Trend Dn") for quick confirmation of the current market state.
The Half Trend Channel is an essential tool for traders who want to follow trends, avoid fakeouts, and identify reliable tops and bottoms to optimize their trading decisions.

[EmreKb] Supertrend FakeoutSupertrend Fakeout
This script is an enhanced version of the classic Supertrend indicator. It incorporates an additional feature that ensures trend reversals are more reliable by introducing a Fakeout Index Limit and a Fakeout ATR Mult. This helps avoid false trend changes that could occur due to short-term price fluctuations or market noise.
How It Works:
The Supertrend indicator uses Average True Range (ATR) and a multiplier to determine the direction of the trend. When the price is above the Supertrend line, it indicates an uptrend; when the price is below the Supertrend line, it signals a downtrend.
This version goes a step further by adding the following checks before confirming a trend reversal:
The script will monitor if the price moves "Fakeout ATR Mult" ATR away from the Supertrend line after a potential breach. This distance helps ensure that the trend change is significant and not just a minor fluctuation.
In addition, the script checks the price action for a specific number of bars, which is controlled by the Fakeout Index Limit. This limit determines how many bars the price must remain below (for a downtrend) or above (for an uptrend) the Supertrend line before the trend is officially reversed.

Fake BreakoutThis indicator detect fake breakout on previous day high/low and option previous swing high and low
Rule Detect Fake Breakout On Previous Day High/Low Or Swing high low Fake Breakout -
1) Detect previous day high/low or swing high/low
2)
A) If price revisit on previous day high/swing high look for upside breakout after input
number of candle (1-5) price came back to previous high and breakout happen downside
it show sell because its fake breakout of previous day high or swing high
B) If price revisit on previous day low/swing low look for downside breakout after input
number of candle (1-5) price came back to previous low and breakout upside of previous
day low it show Buy because its fake breakout of previous day low or swing low
Disclaimer -Traders can use this script as a starting point for further customization or as a reference for developing their own trading strategies. It's important to note that past performance is not indicative of future results, and thorough testing and validation are recommended before deploying any trading strategy.

Daily Pivots with Fakeout Protection█ OVERVIEW
The "Daily Pivots with Fakeout Protection" indicator is a powerful tool designed to help traders identify potential price breakouts and pivot levels on daily charts. This indicator calculates and displays daily pivot points along with breakout lines that are adjusted to provide a certain level of protection against fakeouts, which are false price movements that can mislead traders.
█ FEATURES
• Pivot Timeframe Selection: You can choose the timeframe for the pivot calculations. The default is set to daily (D), but you have the flexibility to select other timeframes as well.
• Fakeout Protection: A percentage-based parameter allows you to define the amount of protection you want against fakeouts. This helps filter out potentially unreliable breakouts.
• Bullish and Bearish Signals: The indicator distinguishes between bullish and bearish conditions by comparing the closing price to the daily high and low.
• Breakout Signals: Triangular symbols (upward and downward) appear below and above bars to signal potential breakout points. These are based on the closing price crossing the adjusted breakout lines.
• Visual Representation: Pivot points, daily high, and daily low are plotted on the chart, with distinctive line styles and colors for easy identification.
• Background Highlighting: The background color of the chart changes when a new period begins, helping you quickly recognize the start of a new trading day.
• Color-Coded Zones: The indicator colors the background around the closing price differently based on whether the market is bullish (green) or bearish (red).
█ HOW TO USE
1 — Apply the "Daily Pivots with Fakeout Protection" indicator to your TradingView chart.
2 — Customize the parameters like pivot timeframe and fakeout protection percentage according to your trading preferences.
3 — Watch for the triangular breakout symbols that appear above and below bars, indicating potential breakout points.
4 — Keep an eye on the pivot points, daily high, and daily low lines to understand price levels relevant to the current trading day.
5 — Use the background color changes to quickly identify the beginning of a new trading day and any potential shifts in market sentiment.
Note:
• This indicator is designed for daily charts but can be adjusted to work with other timeframes as well.
• Be cautious of relying solely on breakout signals; consider using additional technical and fundamental analysis for confirmation.
Start integrating the "Daily Pivots with Fakeout Protection" indicator into your trading strategy to enhance your ability to identify breakouts and pivot levels more effectively.

Dodge Trend [MyTradingCoder]Introducing the "Dodge Trend" indicator, an innovative variant of the Supertrend indicator designed to help traders better avoid fakeouts and maintain positions in established trends.
Like the Supertrend, the Dodge Trend uses Average True Range (ATR) but incorporates a unique adaptive adjustment feature that differentiates it from its counterparts. While the conventional Supertrend rises with the trend and only descends when the price crosses it, the Dodge Trend is designed to 'dodge' potential fakeouts.
This 'dodging' mechanism works by allowing the Dodge Trend to fall slightly during pullbacks, reducing the risk of a premature exit due to a temporary price drop. The recovery rate after the pullback is quicker but is slightly lower than the rate at which a new Dodge Trend high would be established in an uptrend. This unique adjustment feature allows the Dodge Trend to chase price action in an exponential fashion, potentially enabling a quicker exit when the trend shifts.
Key Settings:
Length: Adjust how much price action is taken into consideration for the ATR average. Lower values yield higher responsiveness to recent price action.
Size: Determines the initial deviation of the Dodge Trend when it resets after every flip/break.
Source: Specifies the data point (close, high, open, low, hl2, etc.) used for the Dodge Trend.
Dodge Intensity: Adjusts the intensity of the pullback effect. Higher values result in more intense pullbacks. Range is limited between 0 and 99, with 95 as the recommended default.
Bullish Color Setting: Sets the color for the uptrend Dodge Trend.
Bearish Color Setting: Sets the color for the downtrend Dodge Trend.
Dodge Trend is a powerful tool for traders looking to ride trends and avoid unnecessary exits due to short-term price fluctuations. While it offers a unique feature that may potentially improve trading outcomes, it should be used in conjunction with other indicators and analysis methods for a comprehensive trading strategy. As with all tools, it does not guarantee profitable trades but aims to give traders more actionable and precise information to base their decisions on.
Experience trend-following in a more adaptive and efficient manner with the Dodge Trend indicator, a tool designed to help you 'dodge' false exits and stay in line with the overall trend.

Fake breakHi Traders,
I've developed an indicator which can detect fake-breaks on the chart.
In the following you'll find the definition of the fake break candles and also you will find how to recognize it on the chart with practical examples.
What is the fake break pattern?
Sometimes support and resistance lines broke with a full body and strong candles that gives us the idea of sharp movements on the chart but suddenly the next candle returns all the path of the previous candle. in this case we can say fake break is happening on the chart.
This indicator detect fake break patterns based on two criteria:
1. It uses AverageTrueRange indicator to measure the strength of the pattern.
2. The returning candle should engulf minimum 75% of the break candle.
This indicator plot 2 terms in the name of "FB-D" and "FB-U" that are abbreviations of the "Fake Break Down" and "Fake Break Up".
You can also set alerts to get notified when fake breakout happens on the chart.
Notice: This pattern is only acceptable in valid support and resistance zones and you can not rely on it everywhere on the chart (specially in the middle of the waves).
Notice: The source code of this indicator is open and you are allowed to use it on your scripts by mentioning the name of author.
Disclaimer: This is not a financial advice or any signal to buy or sell, the goal of developing such an indicator is to use for educational purposes.

Matze BreakoutShows 2 different states of breakout:
Arrow = unusual volume, raising volume, positiv rate of change, standard deviation breakout
Bolt = very unusual volume, very high standard deviation breakout

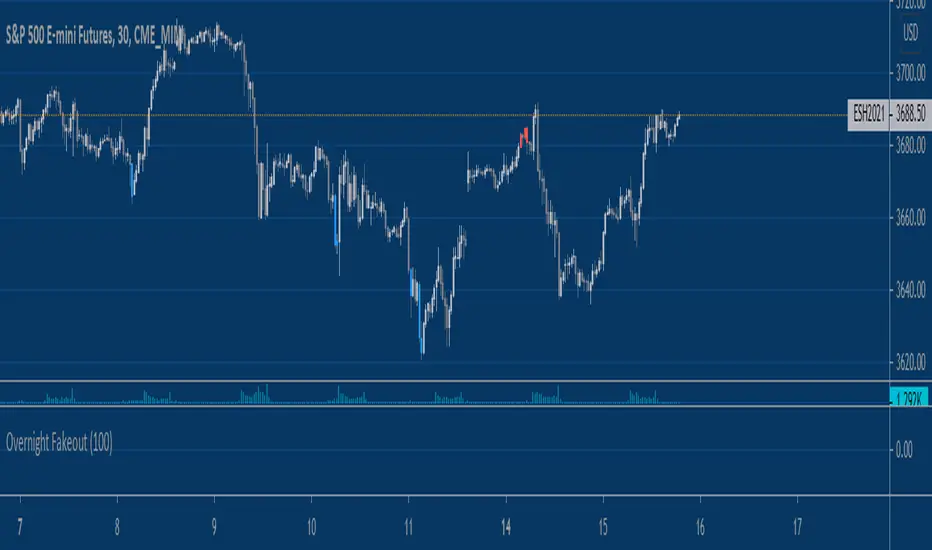
Equity Index Overnight FakeoutThis script highlights when price violates the highest high or lowest low within the user's selected lookback period, with the caveat that it occurs during the GLOBEX session. The script is designed to work exclusively with the trading hours for CME and CBOT Equity Index futures. I'm planning to make a more customizable version down the line.
My reasoning behind this very simple script is that the low liquidity and participation of the overnight session creates a tendency for moves at extremes to mean revert. Let me know what you think.
Vision VolumeAfter reading an article on how to trade volume I felt that I needed some kind of indicator using price action and volume together.
More precisely I tried to build two indicators. Bear in mind this indactor is very simple because it only evaluates each bar with its previous bar and an average.
Nr.1 Weak/fake push: Price suddenly goes up/down a lot more but without much volume being traded -> sign of a fake move or low interest
Nr 2 Price action resistance: After an up or down move price suddenly stops moving but high volumes are being traded. This means high resistance from sellers in a rally or buyers in a decline.
This is very simple and as you can see it is often not a clear signal. I will try to improve it further. If a fake move bar (purple) has a close near its new high we don't know if the fake push will continue. As you can see on the chart. some reversal signs come a little to early.
You can re-color labels and turn them off optionally.
This is built for educational purposes only. I hope you find it useful.
Design by Hook
