Retail Forex Sentiment Fear/Greed CurrencyPairsRetail Forex Sentiment Fear/Greed CurrencyPairs
Overview
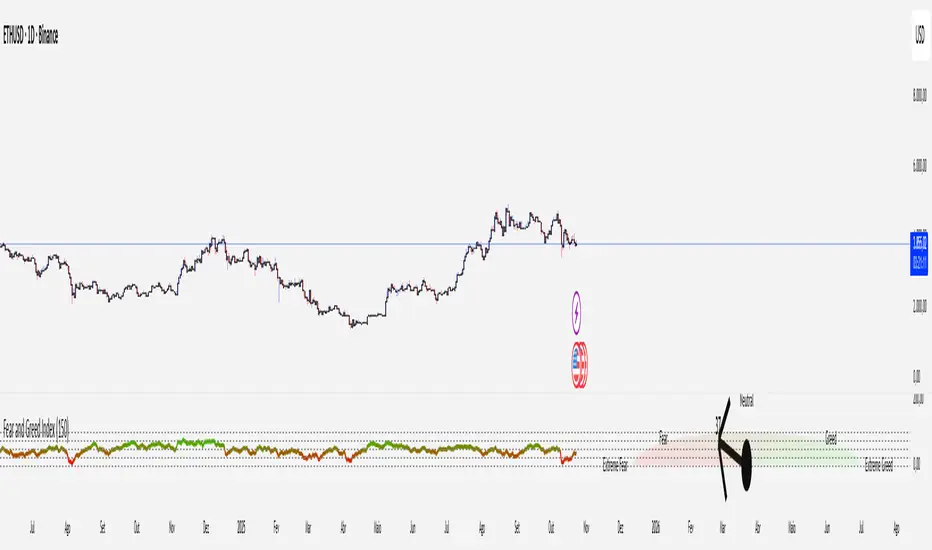
The Retail Forex Sentiment Indicator provides sentiment data for major and cross currency pairs. This indicator displays retail trader positioning using retail brokers data, showing what percentage of retail traders are long or short on each forex pair.
Important: Indicator Split Notice
---------------------------------
Due to TradingView's limitation of 40 data requests per indicator, the original Retail Sentiment Indicator has been split into TWO separate indicators you will find on TradingView:
1. This indicator - Specialized for Forex currency pairs (30+ pairs)
[2. Retail Sentiment Indicator - Multi-Asset CFD & Fear/Greed Index - For indices, commodities, cryptocurrencies, and Fear/Greed indices
Please look at both indicators to access all available sentiment data.
Methodology and Scale Calculation
---------------------------------
This indicator operates on a **-50 to +50 scale** with zero representing perfect market equilibrium.
Scale Interpretation:
- **Zero (0)**: Market balance - exactly 50% of traders long, 50% short
- **Positive values**: Majority long (buying) pressure
- Example: If 63% of traders are long, the indicator shows +13 (63 - 50 = +13)
- **Negative values**: Majority short (selling) pressure
- Example: If 92% of traders are short, the indicator shows -42 (50 - 92 = -42)
Features
--------
- **Auto-Detection**: Automatically loads sentiment data based on the current chart symbol
- **Manual Selection**: Choose from 30+ supported currency pairs when auto-detection is unavailable
- **Visual Zones**: Clear greed/fear zones with color-coded backgrounds (green for fear zone, red for greed zone - contrarian colors)
- **Daily Updates**: Live sentiment data from retail CFD providers
Supported Currency Pairs
========================
Major Pairs
-----------
- EURUSD (most traded pair globally)
- GBPUSD (Cable)
USD Pairs
---------
- USDJPY, USDCHF, USDCAD
- USDPLN
PLN (Polish Zloty) Pairs
------------------------
- USDPLN, EURPLN, GBPPLN, CHFPLN
EUR Cross Pairs
---------------
- EURJPY, EURCHF, EURCAD, EURAUD, EURNZD, EURGBP
GBP Cross Pairs
---------------
- GBPJPY, GBPCHF, GBPCAD, GBPAUD, GBPNZD
AUD (Australian Dollar) Pairs
-----------------------------
- AUDUSD, AUDJPY, AUDCHF, AUDNZD, AUDCAD
NZD (New Zealand Dollar) Pairs
------------------------------
- NZDUSD, NZDJPY, NZDCHF, NZDCAD
CAD Cross Pairs
---------------
- CADJPY, CADCHF
CHF Cross Pairs
---------------
- CHFJPY
How to Use
----------
1. **Auto Mode** (Default): Enable "Auto-load Sentiment Data" checkbox to automatically display sentiment for the current chart's currency pair
2. **Manual Mode**: Disable auto-load and select from the dropdown menu for specific currency pairs
3. **Interpretation**:
- Values above 0 (green line) indicate retail traders are net long (greed/bullish sentiment)
- Values below 0 (red line) indicate retail traders are net short (fear/bearish sentiment)
- Extreme zones (+35 to +50 and -35 to -50) indicate strong positioning
Trading Strategy & Market Philosophy
====================================
Contrarian Trading Approach
---------------------------
The primary purpose of this indicator is based on the fundamental market principle that **the majority of retail forex traders are wrong most of the time**, and currency pairs typically move opposite to the positions held by the majority of retail participants.
Key Strategy Guidelines:
- **Contrarian Signal**: When the majority of retail traders are positioned on one side, consider opportunities in the opposite direction
- **Trend Exhaustion Signal**: When retail traders finally flip to trade WITH an established trend after being wrong for extended period, this often signals trend exhaustion
Interpretation Examples:
- High greed readings (majority long) -> Consider short opportunities
- High fear readings (majority short) -> Consider long opportunities
- Sudden sentiment flip during established trends -> Potential trend reversal signal
Forex-Specific Notes
====================
Currency Correlations
---------------------
When analyzing forex sentiment, consider that:
- USD pairs often move together (if retail is long EURUSD, they're often short USDJPY)
- Cross pairs can provide confirmation signals
- Comparing sentiment across related pairs can reveal broader positioning
Auto-Detection Support
----------------------
The indicator supports automatic detection of various broker ticker formats including:
- Standard pairs (EURUSD, GBPUSD, etc.)
- CME Futures symbols (6E, 6B, JY, etc.)
- Micro futures (M6E, M6B, MJY, etc.)
This functionality is powered by regex pattern matching. However, for some CME futures pairs—particularly those involving JPY, CAD, and CHF—auto-detection may not work properly. In such cases, disable the auto-load checkbox and manually select the ticker from the dropdown menu.
Technical Notes
---------------
- Built with PineScript v6
- Dynamic symbol detection with fallback options
- Optimized for performance with minimal resource usage
- Color-coded visualization with customizable zones
Data Sources
------------
This indicator uses curated sentiment data from retail CFD providers. Data is updated regularly and sourced from reputable financial data providers.
Data Infrastructure Status
--------------------------
Current Data Upload Process:
Please note that sentiment data uploads may occasionally experience minor interruptions. However, this should not pose significant issues as sentiment data typically changes gradually rather than rapidly.
Acknowledgments
---------------
We extend our gratitude to **TradingView** for enabling the use of custom data feeds based on GitHub repositories, making this comprehensive forex sentiment analysis possible.
Disclaimer
----------
This indicator is for educational and informational purposes only. Sentiment data should be used as part of a comprehensive trading strategy and not as the sole basis for trading decisions. Past performance does not guarantee future results. The contrarian approach described is a market theory and may not always produce profitable results. Forex trading involves significant risk of loss.
Penunjuk Pine Script®