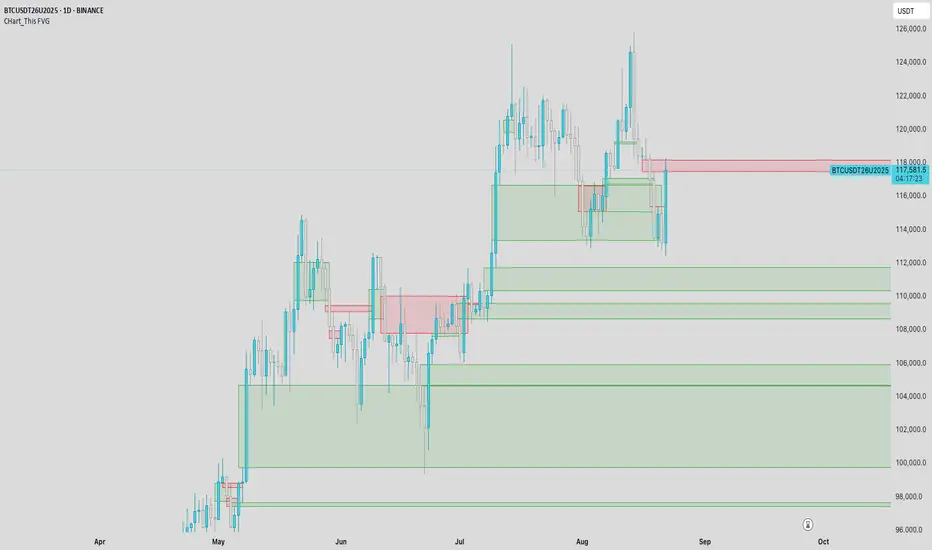
CHart_This FVGThis script will work on any time frame, and auto plots the classic ICT "fair value gaps", or imbalances, that result from a three candle formation wherein the middle candle body extends beyond the highs and lows of the end candles, leaving no overlap of the first and last candle wicks. Bullish imbalances are green, and bearish are red. Plotted zones will automatically close once a candle closure fully violates the imbalance zone with a close beyond its borders.
Finder
Imbalance Scanner [Afnan]Identify the most aggressive candles on any chart—instantly or historically—and act before the crowd notices.
🔥 What It Does
Four-tier detection system: 🟡 Low → 🟠 Mild → 🔴 Explosive → 💥 Super Explosive
Smart filtering: Detects abnormal candle bodies and ranges that signal market imbalances
Volume confirmation: Optional filter ensures moves are backed by institutional-level activity
Directional control: Choose All, Bullish, or Bearish candles to match your trading bias
Pine Scanner optimized: Scan entire watchlists in real-time or historically.
Clean interface: Minimal emoji labels with background highlighting—no chart clutter
⚡ Quick Setup
1. Load & Configure: Add to chart and open indicator settings
2. Set Detection Level: Choose minimum imbalance strength (Low/Mild/Explosive/Super)
3. Optional Volume Filter: Enable for higher-quality signals with volume confirmation
4. Pine Scanner Setup: Set "Days Back" (0 for live scanning, >0 for historical analysis)
5. Create Alerts: Pre-built alert conditions for each explosive level
🎯 Primary Use Cases
Smart Money Detection: Spot where big players are active through explosive price movements
Market Inefficiencies: Find supply/demand imbalances as they develop
Breakout Confirmation: Validate genuine breakouts using explosive candle analysis
Identify momentum acceleration points for optimal timing
📊 Pine Scanner Ready
Fully compatible with TradingView's Pine Scanner for real-time watchlist monitoring and historical analysis.
💼 Professional Edge
Built by @AfnanTAjuddin for active traders who need reliable, fast imbalance detection across any market or timeframe. Perfect for day trading, swing trading, and institutional activity tracking.

Consecutive CandlesSummary
This indicator helps visualize short-term momentum by automatically drawing boxes around sequences of consecutive same-colored candles (bullish or bearish). It's designed to quickly highlight periods of sustained buying or selling pressure directly on your chart.
How it Works
Consecutive Candle Detection: The script monitors the chart bar by bar, tracking consecutive candles where close > open (bullish) or close < open (bearish).
Box Drawing: When a sequence of same-colored candles reaches a user-defined minimum length (default is 3) and this sequence is then broken by an opposite-colored candle or a doji, a box is drawn.
Box Boundaries:
The top of the box is set to the highest high price reached during the sequence.
The bottom of the box is set to the lowest low price reached during the sequence.
The left edge of the box aligns with the start time of the first candle in the sequence.
The right edge of the box aligns with the end time of the last candle in the sequence.
Stability: Uses xloc = xloc.bar_time to ensure boxes remain accurately anchored to the price bars when zooming or panning the chart.
Real-time Extension: For active sequences meeting the minimum length on the latest developing bar, the box is optionally extended to the right.
Features
Automatically identifies and boxes sequences of 3 or more (customizable) consecutive bullish candles.
Automatically identifies and boxes sequences of 3 or more (customizable) consecutive bearish candles.
Extends box in real-time for active qualifying sequences.
Customizable minimum candle count (>= 2).
Customizable colors for bullish/bearish boxes and borders.
Settings
You can customize the indicator via the Settings menu (gear icon):
Minimum Consecutive Candles: Define how many candles in a row are needed to draw a box (Default: 3).
Bullish Box Color: Set the fill color for boxes around bullish sequences.
Bearish Box Color: Set the fill color for boxes around bearish sequences.
Box Border Color: Set the color for the border of all boxes.
Potential Use Cases
Momentum Identification: Quickly spot periods of strong, uninterrupted buying or selling.
Exhaustion/Reversal Signals: Very long sequences might indicate potential exhaustion, setting up reversal opportunities.
Consolidation Breakouts: A box forming after a period of tight consolidation can highlight the range just before a potential breakout.
Confirmation: Use the boxes as confirmation for entries or exits based on momentum shifts.
Disclaimer: This indicator provides visual aids based on price action. It should not be used as a standalone trading system. Always use indicators in conjunction with your own analysis and risk management rules.

Best MA Pair Finder (Crossover Strategy)This indicator automatically identifies the optimal pair of moving averages (MAs) for a crossover strategy using all available historical data. It offers several MA options—including SMA, EMA, and TEMA—allowing users to select the desired type in the settings. The indicator supports two strategy modes: “Long Only” and “Buy & Sell”, which can be chosen via the options.
For each MA pair combination, the indicator performs a backtest and calculates the profit factor, considering only those pairs where the total number of trades meets or exceeds the user-defined "Minimum Trades" threshold. This parameter ensures that the selected optimal pair is based on a statistically meaningful sample rather than on a limited number of trades.
The results provided by this indicator are based on historical data and backtests, which may not guarantee future performance. Users should conduct their own analysis and use proper risk management before making trading decisions.

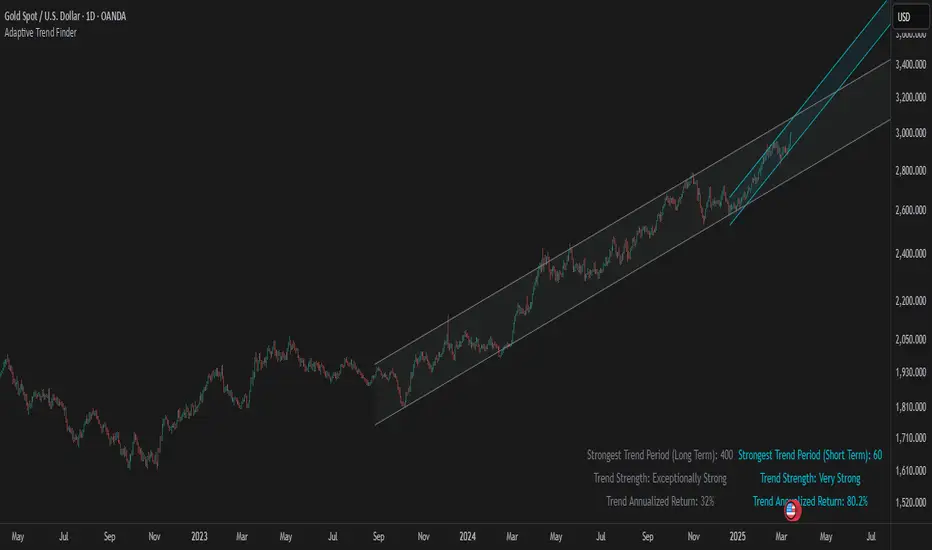
Adaptive Trend FinderAdaptive Trend Finder - The Ultimate Trend Detection Tool
Introducing Adaptive Trend Finder, the next evolution of trend analysis on TradingView. This powerful indicator is an enhanced and refined version of Adaptive Trend Finder (Log), designed to offer even greater flexibility, accuracy, and ease of use.
What’s New?
Unlike the previous version, Adaptive Trend Finder allows users to fully configure and adjust settings directly within the indicator menu, eliminating the need to modify chart settings manually. A major improvement is that users no longer need to adjust the chart's logarithmic scale manually in the chart settings; this can now be done directly within the indicator options, ensuring a smoother and more efficient experience. This makes it easier to switch between linear and logarithmic scaling without disrupting the analysis. This provides a seamless user experience where traders can instantly adapt the indicator to their needs without extra steps.
One of the most significant improvements is the complete code overhaul, which now enables simultaneous visualization of both long-term and short-term trend channels without needing to add the indicator twice. This not only improves workflow efficiency but also enhances chart readability by allowing traders to monitor multiple trend perspectives at once.
The interface has been entirely redesigned for a more intuitive user experience. Menus are now clearer, better structured, and offer more customization options, making it easier than ever to fine-tune the indicator to fit any trading strategy.
Key Features & Benefits
Automatic Trend Period Selection: The indicator dynamically identifies and applies the strongest trend period, ensuring optimal trend detection with no manual adjustments required. By analyzing historical price correlations, it selects the most statistically relevant trend duration automatically.
Dual Channel Display: Traders can view both long-term and short-term trend channels simultaneously, offering a broader perspective of market movements. This feature eliminates the need to apply the indicator twice, reducing screen clutter and improving efficiency.
Fully Adjustable Settings: Users can customize trend detection parameters directly within the indicator settings. No more switching chart settings – everything is accessible in one place.
Trend Strength & Confidence Metrics: The indicator calculates and displays a confidence score for each detected trend using Pearson correlation values. This helps traders gauge the reliability of a given trend before making decisions.
Midline & Channel Transparency Options: Users can fine-tune the visibility of trend channels, adjusting transparency levels to fit their personal charting style without overwhelming the price chart.
Annualized Return Calculation: For daily and weekly timeframes, the indicator provides an estimate of the trend’s performance over a year, helping traders evaluate potential long-term profitability.
Logarithmic Adjustment Support: Adaptive Trend Finder is compatible with both logarithmic and linear charts. Traders who analyze assets like cryptocurrencies, where log scaling is common, can enable this feature to refine trend calculations.
Intuitive & User-Friendly Interface: The updated menu structure is designed for ease of use, allowing quick and efficient modifications to settings, reducing the learning curve for new users.
Why is this the Best Trend Indicator?
Adaptive Trend Finder stands out as one of the most advanced trend analysis tools available on TradingView. Unlike conventional trend indicators, which rely on fixed parameters or lagging signals, Adaptive Trend Finder dynamically adjusts its settings based on real-time market conditions. By combining automatic trend detection, dual-channel visualization, real-time performance metrics, and an intuitive user interface, this indicator offers an unparalleled edge in trend identification and trading decision-making.
Traders no longer have to rely on guesswork or manually tweak settings to identify trends. Adaptive Trend Finder does the heavy lifting, ensuring that users are always working with the strongest and most reliable trends. The ability to simultaneously display both short-term and long-term trends allows for a more comprehensive market overview, making it ideal for scalpers, swing traders, and long-term investors alike.
With its state-of-the-art algorithms, fully customizable interface, and professional-grade accuracy, Adaptive Trend Finder is undoubtedly one of the most powerful trend indicators available.
Try it today and experience the future of trend analysis.
This indicator is a technical analysis tool designed to assist traders in identifying trends. It does not guarantee future performance or profitability. Users should conduct their own research and apply proper risk management before making trading decisions.
// Created by Julien Eche - @Julien_Eche
Lost Bar Locator v1 [Yaphott]Lost Bar Locator v1 helps you locate missing data on your chart.
It does this by looking for consecutive bars that have a delta time greater than the current interval.
Two lines are drawn for each group of one or more missing bars:
Bar before the missing bar(s).
Bar after the missing bar(s).

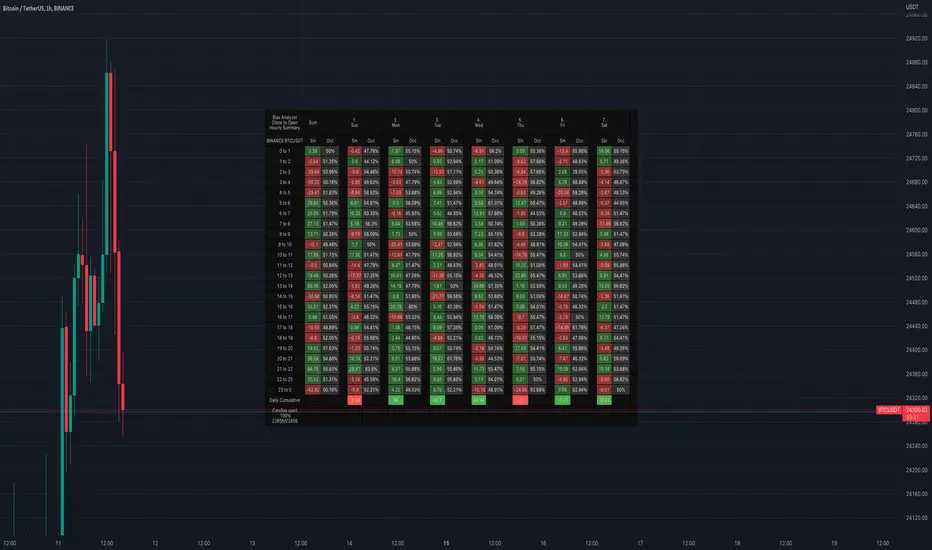
Bias AnalyzerName: Bias Analyzer
Category: Market Analyzer
Timeframe: 1H and 1D, depending on the Analysis type.
Technical Analysis: Usually when we think about a Trading System we start from an idea. This idea comes normally from observation and the study of the market.
Have we ever observed a market - for example Bitcoin - and thought that it increases at the start of a USA session? Great, this is a well-known category of Trading System and the purpose of the Bias Analyzer is to study these phenomena.
There are different types of Trading System that we can classify considering the market in-efficiency that we use to our advantage. In this case we make the Bias. Literally "inclination" or "presupposition" or precisely "tendency" of the price to go up or down in a temporal way.
The characteristics of the Bias depend on how much the Bias is persistent on the market since the analysed period. therefore we can consider:
Hourly Bias : analysing the hourly behaviours during the week. Trades normally last from a few hours to a few days.
Seasonal Bias : analysing the behaviour of the weeks in the monthly or annual context, evaluating the seasons.
Suggested usage: The possibilities of the tool are infinite, these are some scenarios of use:
Development of Intraday Trading Systems based on Hourly Bias with possible filters for specific days of the week.
Development of a Multi-day Trading System based on daily Bias with monthly analysis.
To identify the best day to execute our investment through Dollar Cost Average with a bit of healthy buy the dip
Main features:
Hourly Summary organized in Week
The cells contain the sum of the various price deltas for the single hour. The transparency indicates the frequency in which the candles close positive or negative. This information is available both in a synthetic way, as in the first column "Sum", and for each day of the week.
Hourly Details organized in different entry/exit
Shows the cumulative data of the various deltas, considering the purchase and the sale at certain times. In the rows are represented the buying hours and in the columns the selling hours.
Daily Summary organized in Months
The cells contain the summation of the various price deltas for the single day.
Hourly Details organized in different entry/exit
Allows to visualise the detailed analysis table, choosing to do it for all the months or for a specific month and shows the cumulative data of the various deltas, considering the purchase and the sale in certain days.
Configuration: You can configure the tool easily and completely.
Analysis
Calculate from Close to Open : this is the core of the whole analysis where the "Price Delta" to be calculated is defined. At this moment there is the possibility to calculate the distance between opening and closing.
Calculate in Percent or Cash : this allows to calculate the Price Delta in Percent or in Cash.
Analysis on 1H Timeframe
Show Hourly Summary on : allows to visualise the summary analysis table of the week. The cells contain the sum of the various price deltas for the single hour. The transparency indicates the frequency in which the candles close positive or negative. This information is available both in a synthetic way, as in the first column "Sum", and for each day of the week. At the bottom left there is also data which allows us to understand how many candles are being analysed. At the bottom of each day it is possible to visualise the cumulative data of the day. The position of the table is customizable.
Show Hourly Details of on : allows to visualise the detailed analysis table, choosing to do it for all days or for a specific day, and shows the cumulative data of the various deltas, considering the purchase and the sale at certain times. In the rows are represented the buying hours and in the columns the selling hours. For example, going to the table "All Days" we can see in the cell of row 13 and in column 22 the cumulative data of a possible buy on 13 and a sell at the end of 22. To facilitate the research of the values there is a configurable transparency system.
Analysis on 1D Timeframe
Show Daily Summary on : allows to visualise the summary analysis table of the month. The cells contain the summation of the various price deltas for the single day: The first row is the summation of all days of the month for all months in the analysis period, while the other rows represent the analysis for the various days of the individual months.
Show Daily Details of on : allows to visualise the detailed analysis table, choosing to do it for all the months or for a specific month and shows the cumulative data of the various deltas, considering the purchase and the sale in certain days. In the rows are represented the buying days and in the columns the selling days. For example, going to the table "All Months" we can see in the cell at row 1 and at column 3 the cumulative of a possible purchase on the 1st and the sale on the 3rd. To facilitate the research of the values, there is a configurable transparency system.
Table Layout
Size : allows to define the size of the text in the table.
Precision : it is possible to define the decimal precision of the calculations presented in the tables.
Transparency Factor : allows the application of a multiplication factor when the table calculates the transparency of detail tables.
Colours : allows to specify the colours of Profit, Loss and Neutral, besides to adapt a style coherent with the Dark Mode or Light Mode of Trading View
Volatility Filter
It is possible to directly apply a filter to the time series on which the delta is calculated. The volatility filter uses the ATR - an indicator that allows you to calculate the volatility in a given period. Briefly: the higher the ATR value, the higher the volatility. Therefore the filter works by comparing the volatility on two periods and indicates compression or expansion.
Backtest Dates
In order to facilitate the identification of in-sample and out-of-sample data, as well as the degradation of a given behaviour, it is possible to specify a period in which to do the analysis.
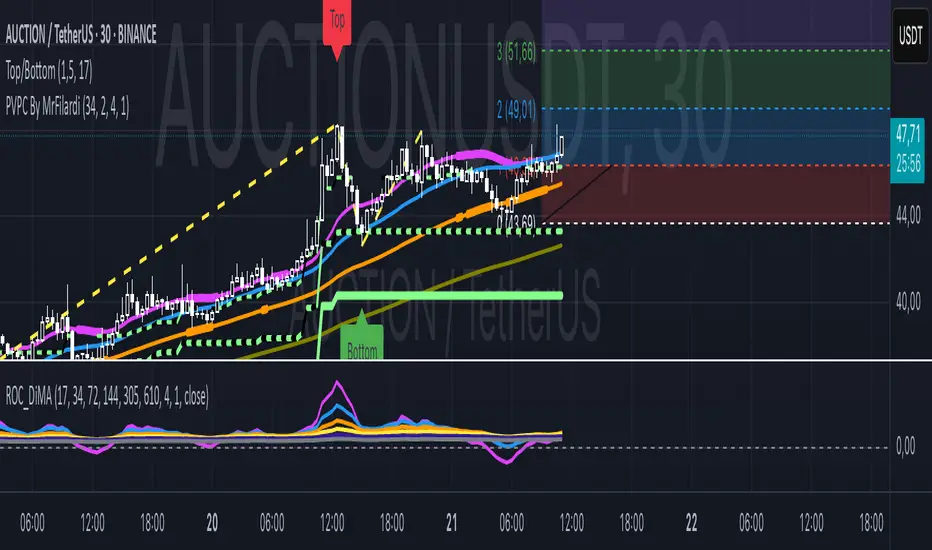
Price Action Top/BottomThis script is a variation from Auto Fibo retration.
It makrs top and bottom prices. You can use to study the price action.
The user can choose the line color, to show or not, the marks green and red
The user can choose the minimal candles between top and bottom, by default is 17
The deep is the percentage of the diference about the last bottom/top from the previous one.
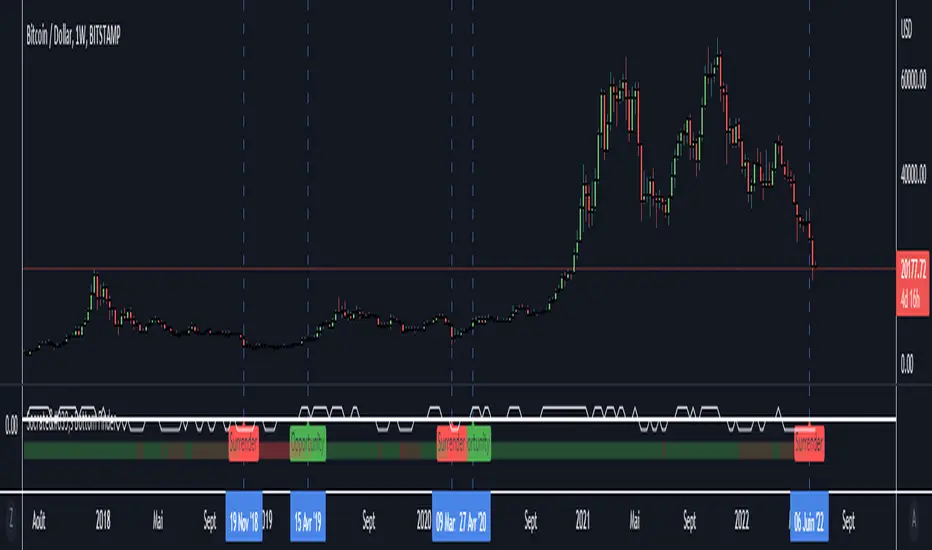
Socrate's Bottom FinderENGLISH :
Hi everybody,
This indicator will give you the market bottoms with remarkable accuracy.
/!\ Be aware that the indicator cannot know the current economic situation and that in the event of a major crisis, it can signal a market bottom despite the decline not being over. /!\
How to read it ?
It is composed of two visual sections:
- The first section materialized by the white line is a "treshhold" which gives the current trend of the week. It is used to filter most of the "fake signals"
- The second section, materialized by a green and red band, gives the strength of the price trend. If for example the trend is rather bullish, this bar will turn green, the opposit will produce red. An "opportunity" signal will appear when the optimal conditions are met to define a market bottom. Before an opportunity signal there will always be an "Surrender" signal, wich means the trend has weakened and the bottom is near in time.
Special Recommandation :
- The best results are on 1W, 3D, 1D. The indicator work on lower TF but it's not his purpose and you may drop significantly your W/L rate.
- Avoid stocks/crypto with poor stability in the very long time, a good hint is to look after thoses who mostly are above SMA200 on weekly TF.
- Avoid cyclical stock, as they tend to bounce up and down way to often.
Please do your own diligence. Trading may conduct you to loose capital.
Apply your own trading strategy :)
-----------------------------------------------------------------------------------------------------------------------------
FRANCAIS :
Salut tout le monde,
Cet indicateur vous donnera les creux du marché avec une précision remarquable.
/!\ Sachez que l'indicateur ne peut pas connaître la situation économique actuelle et qu'en cas de crise majeure, il peut signaler un creux de marché même si la baisse n'est pas terminée. /!\
Comment le lire ?
Il est composé de deux sections visuelles :
- La première section matérialisée par la ligne blanche est un « seuil » qui donne la tendance actuelle de la semaine. Il est utilisé pour filtrer la plupart des "faux signaux"
- La deuxième section, matérialisée par une bande verte et rouge, donne la force de la tendance des prix. Si par exemple la tendance est plutôt haussière, cette barre deviendra verte, l'inverse produira du rouge. Un signal "d'opportunité" apparaîtra lorsque les conditions optimales seront réunies pour définir un creux de marché. Avant un signal d'opportunité, il y aura toujours un signal "Abandon", ce qui signifie que la tendance s'est affaiblie et que le creux est proche dans le temps.
Recommandations spéciales :
- Les meilleurs résultats sont sur 1W, 3D, 1D. L'indicateur fonctionne sur des TF plus faibles mais ce n'est pas son but et vous risquez de faire chuter considérablement votre ratio de W/L.
- Évitez les stocks/crypto avec une faible stabilité sur le long terme, un bon indice est de cibler ceux qui sont majoritairement (dans leur historique) au-dessus de leur SMA200 en TF hebdomadaire.
- Prioriser les actifs de type "HyperGrowth", l'indicateur fonctionne moins bien avec les cycliques
Veuillez faire vos propres recherches en parallèle. Le trading pouvant vous conduire à perdre du capital.
Appliquez à cet indicateur votre propre stratégie :)
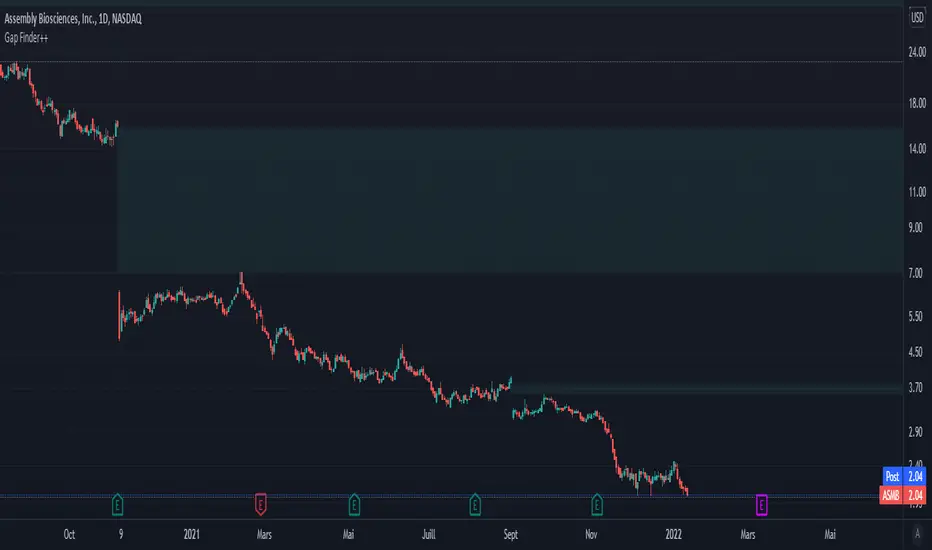
Customizable Gap Finder++█ OVERVIEW
Customizable Gap Finder by ProfessorZoom with a partial close of a gap
█ CONCEPTS
1 — Gaps bullish or bearish
2 — Gaps can be filled
3 — Gaps can be partially close
4 — Some display options
█ OTHER SECTIONS
Thanks to The rational investor for teaching me this and ProfessorZoom because he writes 99% of the script.
Did you know the percentage of gaps filled ? If not, I recommand you to follow his courses, and I have no conflicts of interest.
Relative Strength ComparisonThis script plots the ratio between a ticker and the selected index. Currently, I have US equities indexes listed + BTC. It's a great way to check for relative strength, determine if absolute highs relative to the ratio are being made, etc.
Additionally, optional comparison of the RSI is included. I was just testing something out but figured I'd leave in here because why not. If you use this, enable the 1.0 line.
Script is a bit slow, will try to optimize eventually.

M.Right_Top & Bottom Finder 1.0Thank you @Lazybear for the calculations for squeeze and BB, and all of the other great pine-coders who inspired me to create my own indicator to share!
This is the result of hours of work learning to code pine and tweaking until everything fits exactly what I was looking for.
After using it for a while and seeing the benefits personally, I figured now might be a good time to share with everyone while we are in such great market volatility, maybe I can save you some losses.
Basically, my indicator is meant to use volatility and standard deviations to show you the top and bottom of trends.
It does indeed work on lower timeframes, I typically use it on 5m, 30m, 4hr, and 1d.
What to look for:
When it detects the trend bottoming it will send a green histogram bar down, I also created a different shade green for even more likely bottoms.
When it detects the top of the trend it will send a red bar up, I have a brighter red for more certain tops.
The length of the histogram bar is also an indication as well. Sometimes there will be a reversal while still just showing the gray bar.
I just added alerts, so hopefully those work. If not, I will update.
Let me know if you have any questions, and enjoy.
Cheers!

Pump Finder v2.0The Pump Finder V2 indicator is very strong in finding crypto pumps. As you can see on the chart, cryptos often start a new strong bull run with a massive pump of the price, see below for examples. This pump finder script is very strong in finding those specific pumps. This indicator is best used with trend confirming indicators, my Clean Market indicator for example. This indicator can also be used naked with proper risk management. Be aware that this indicator is at its best in bull markets. The best time frames to use this indicator are between M15 and H4.

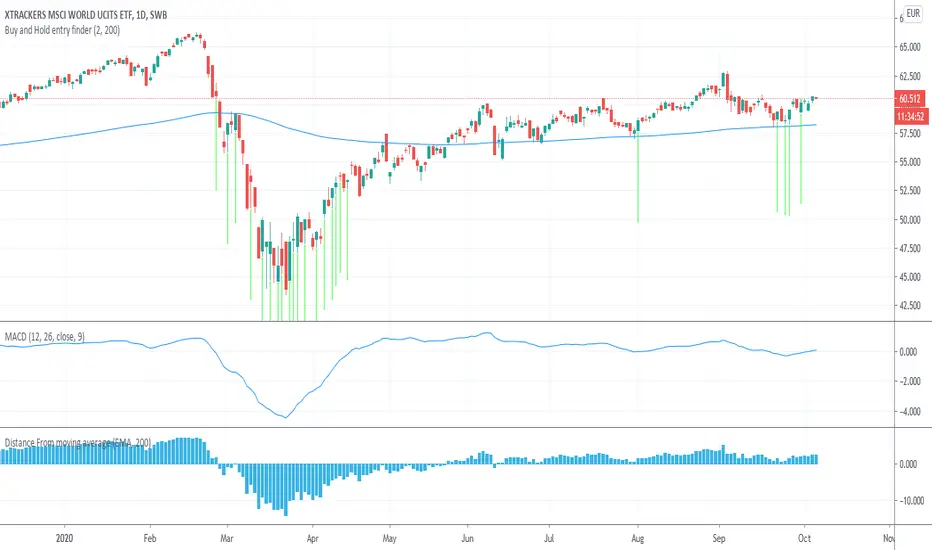
Buy and Hold entry finderHello everyone!
This is a indicator based on the MACD and the distance between the current price and the Exponential moving Average .
The signal gets triggered if the current MACD (with default settings) is under 0 and the Distance from the Ema gets smaller if under ema or gets bigger if over ema . In edition you can set a max distance from the ema .
This indicator was invented for buy and hold strategy s only.
I invented this indicator to find better entrys for my saving plans on the MSCI WORLD AND MSCI EMERGING MARKETS ETF on the 1 day timeframe.
Instead of investing every month, i only invest on the green Arrow Signal.
For example, lets say there is no buy signal for 3 months, then i invest the summary of the three months on the buy signal.
Tweezer Scanner v1Some code for detecting tweezer candles, which are reversal patterns. You'll need to tweak the settings to be either less strict (more detections) or more strict (less detections). I found that if you follow the documentation for tweezers exactly, you will get very few detections. It is possible that this candlestick has become overused, so the original pattern itself has been lost to the noise of the market.
Settings:
1. Tweezer Max Body Height (Pips) - How tall can the body of the tweezer be, in pips (increase this pips to increase detections)
2. Tweezer Body Similarity (>%) - How similar should the body heights be, higher percentage is more similar (reduce this % to increase detections)
3. Tweezer Tail Similarity (>%) - How similar should the tail heights be, higher percentage is more similar (reduce this % to increase detections)
4. Tweezer Tail Proportion (<%) - How short should the opposite tail heights be, lower percentage is shorter and more similar to the documentation (increase this % to increase detections)

Doji Scanner v1A scanner for detecting Doji Candles.
Adjust the maximum allowable height of a Doji Candle's body, depending on the currency pair or asset.


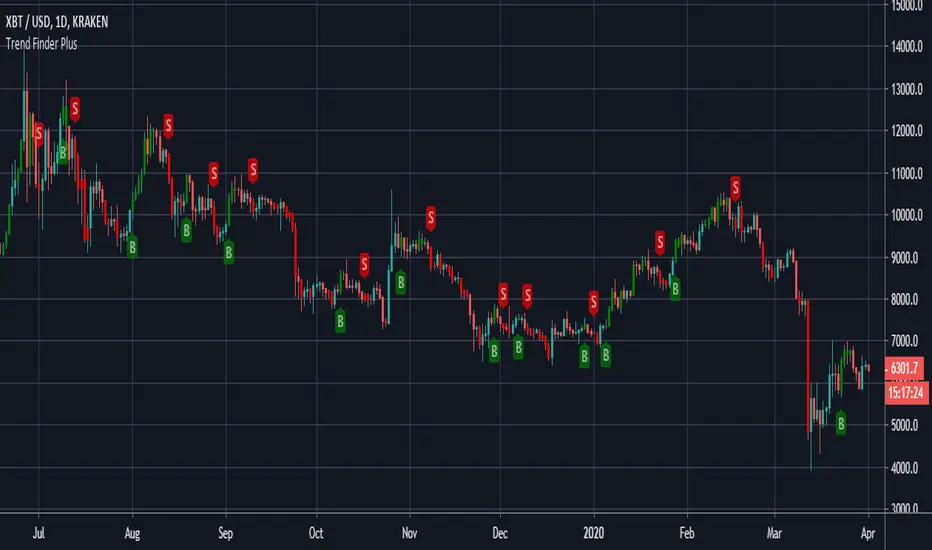
Trend Finder Plus - theCrypster===========
Trend Finder Plus
===========
A combination of various trend analysis techniques - MA's, pivotal breakouts, and Stochastics - Combined to make one super handy indicator!
-----------
Editable settings include a custom "Trend Finder" length and the usual settings for utilizing a "Stochastic RSI" .
This is a really useful tool for catching the very start of potentially bigger swings and movements - but it can get easily and display false signals during choppy periods - use with other indicators for a true sense of what can be achieved with this.
Good Luck and Happy Trading!
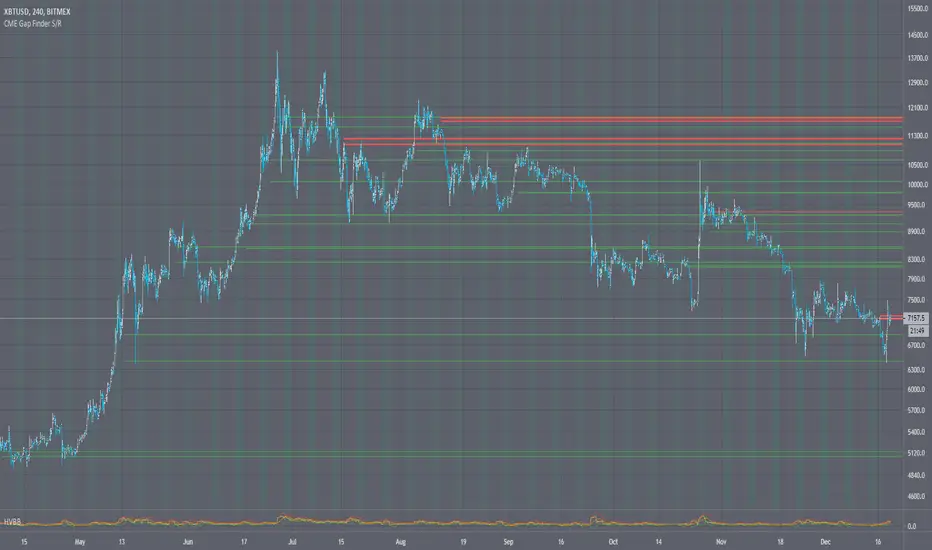
CME Bitcoin Gap Finder Orderblock Support ResistanceCME Bitcoin Gap Finder Orderblock Support Resistance
Intro
I had a backlog of scripts to release, and so everyone is getting some Christmas gifts early!
I have been watching CME gaps and how they relate to BTC for over a year now. I find they make good orderblock support/resistance areas.
Description
There is a limitation to how many lines I can draw with the new pine script functions. So for instance if you want to see the gaps from 2018 I have included a date range selector (similar to how a backtest works). This way you can only display the gaps from the dates ranges you want to see.
There's also the ability to check for gaps on the daily, 12h, 4h, and 1h charts. I recommend using 12H. But know that depending on what period you choose it will effect the size of the gaps, so experiment and see what works for you.
Lastly I included the ability to have background highlights whenever CME is closed on the weekend, just for visual reference.
You can use this indicator on any BTC ticker, and it will show you where the CME gaps are (without having to switch/reference the CME chart).
👍 We hope you enjoyed this indicator and find it useful! We post free crypto analysis, strategies and indicators regularly. This is our 74th script on Tradingview!
💬Check my Signature for other information
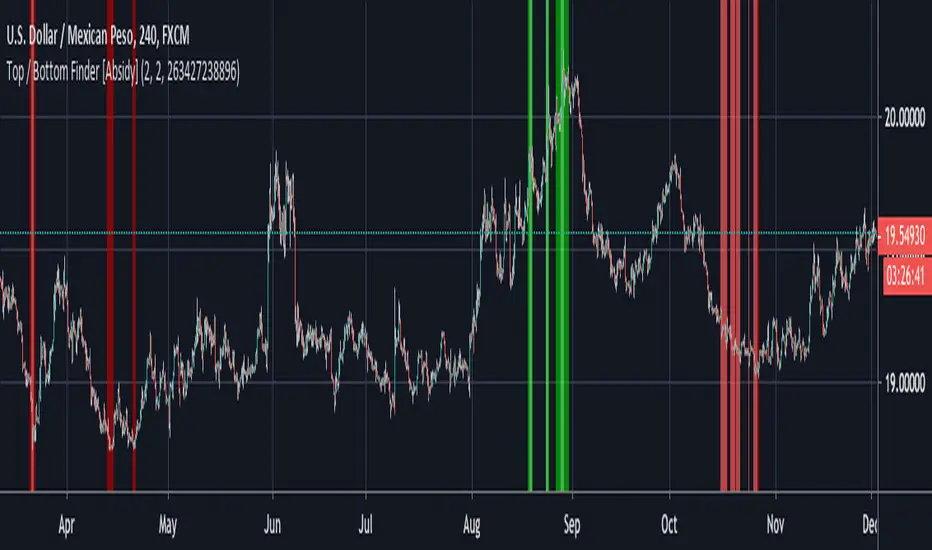
Top / Bottom Finder The Top/Bottom Finder is a unique indicator that looks for market tops and market bottoms in real time without repainting or lagging! When this indicator suspects that a market top is forming it changes the background of the chart to bright green. When this indicator suspects that a market bottom is forming it changes the background of the chart to bright red. This is a great confluent signal for other indicators and strategies that focus their trading styles on entries and exits in the top or bottom of the market. There are two settings that you can change depending on what markets you are in and your trading style. If you are looking for very quick scalping opportunities it is best to set the sensitivity setting very low to look for quick changes, but if you are looking for long term market peaks you can turn the sensitivity up. Since this indicator works independently from the time frame it's best to check out different setting on different time frames to see how they agree. For example, if you are looking for a lot of trades on the 4 hour charts you can set the sensitively very low, but this might give similar information if you set the sensitivity very high on the 5 minute charts. The next setting that you can change is the signal quality. The tops and bottoms of trending and ranging markets look very different, to account for this you can change how this indicator responds in both types of market by setting the signal quality very high for tending markets and very low for ranging markets, or somewhere in between for potential break out markets.
This indicator works by a proprietary recursive filtering technique that tries to gauge if a top or bottom is forming in real time.
To start your free four day trial please see the link below to receive access and free tutorials for this indicator!
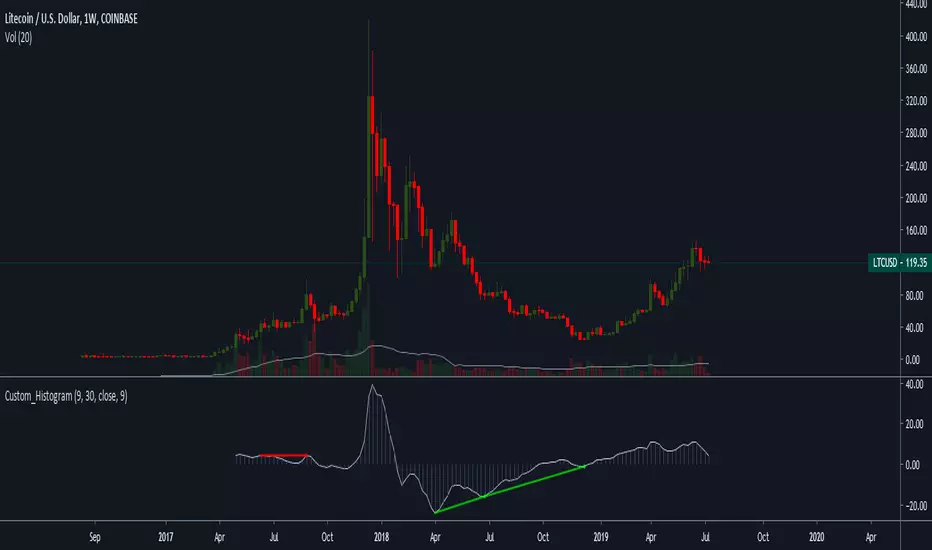
💸 Divergence Finder v1.0 by Cryptothythms💸 Divergence Finder v1.0 by Cryptothythms
Intro
This indicator is meant as a quantitative look at divergences. Special thanks to RicardoSantos (legend!) for his divergence detection script which was used as a basis to construct this.
Usage
Lime Green = Regular Bullish Divergence
Dark Green = Hidden Bullish Divergence
Red = Regular Bearish Divergence
Maroon = Hidden Bearish Divergence
Remember... divergences do not have a high probability success overall. So to mitigate that this is an attempt to source many "opinions" on the state of divergence from many different classes of indicators.
Leading indicators - Lead price action, but have a higher probability of false signals
Real time indicators - Track price action, momentum, etc in a tick by tick state. Generally a 1-3 bars lag can be present.
Lagging indicators - Lag price action a little, but offer more in terms of confirmation of the divergence
Volume indicators - Look at volume flow in different fashions and give an added dimension to divergence finding. Remember volume divergences interact with price independently. For instance volume can be going down, but price going up. Be sure to understand the relationship of volume and price action when considering these readings.
👍 Enjoying this indicator or find it useful? Please give me a like and follow! I post crypto analysis, price action strategies and free indicators regularly.
💬 Questions? Comments? Want to get access to an entire suite of proven trading indicators? Come visit us on telegram and chat, or just soak up some knowledge. We make timely posts about the market, news, and strategy everyday. Our community isn't open only to subscribers - everyone is welcome to join.
For Trialers & Chat: t.me/cryptorhythms

Scalp God (top and bottom finder) (SATURN)I am very happy to present the Tradingview community the first of my new line of powerful indicators.
This is the SCALP GOD. It will clearly label market tops and bottoms for you, if you are scalping and looking to open or close a position this indicator will mark the local highs and lows for you. Or if you are a swing trader this can also give good signals as this indicator works on any pair and any timeframe! When you see the chart turning green you know for sure that a market top is forming, if the chart is turning red you know for sure a market bottom is forming. It is sometimes the absolute top or bottom and sometimes just an important local top or bottom. PM me if you find a better top & bottom indicator because I am trying to make this better than everything out there.
It absolutely can not repaint under any circumstances.
There are a few inputs for you to think about here:
-First is the length, this just decides how many previous bars to consider, making it longer will focus on more historical information while making shorter will make it focus on what has recently happened. 12 seems to be a good value, but it's not as important as the next two options.
-Next is the threshold value, setting it very low will mean that signals will get triggered very quickly, while a higher threshold will take more movement to trigger.
-Last and most important is the sensitivity value. A lower value here will make the signals much more sensitive and therefore able to flip and trigger faster. A higher sensitivity value will make the signals less sensitive and harder to flip, meaning that it will only look for movements that agree with the longer term trend. This is great for swing traders and scalpers that go with the trend.
-There is also a smoothening option, this will make it so the signals don't come on and off so much. Sometimes this will not be good for timing, but other times it will be a more certain signal for traders specifically looking for where the top or bottom ends.
It gets better because I added several of these indicators into one script, so if there is a particular set of sensitivities and thresholds that you like you can look at them all on the same chart without opening so many copies of this. To turn on an additional copy just check the "Sensitivity # On" box.
Everyone can try this for free for 3 days and after that it will be 0.025 BTC for lifetime use and this will include all future updates to this project. This is Project Saturn and this is the first indicator from a new series of indicators that will be coming out over the next year.
Hopefully this makes a lot of you rich! I'm very excited to see all of the uses people make with it.
Happy trading & good health!
