Futures Exchange Sessions 3.0Description
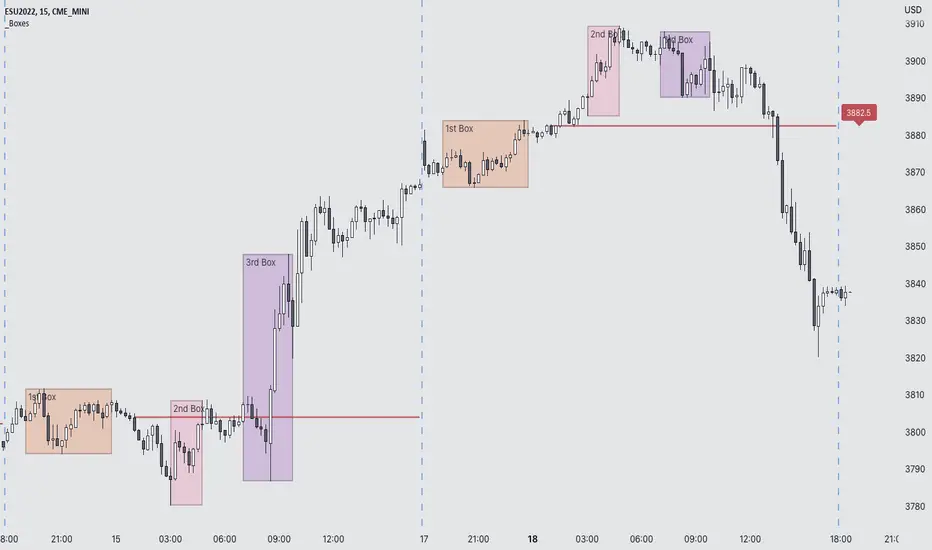
The ultimate conclusion to the Futures Exchange Sessions 2.0 indicator. In version 3.0 the user gets full control of the start and end times of three separate dynamic boxes and one horizontal line. If the user wants to visually keep track of killzones, lunches, or any other time span in a trading day, version 3.0 will dynamically expand and keep track of price within the time specified by the user.
Inputs and Style
Everything about the three dynamic boxes and one horizontal line can but independently configured. Color, style, border, width can all be adjusted. In the Settings each box has a text box so the user can give each one a unique name.
Timezone
All of the start and end times are in EST. Additionally, each box and line need a dependent start of each day. This is controlled by a setting where the user can specify a timezone called Start Day Timezone which would be midnight of the respective timezone. In general if a box or line resides within a particular Session pick the corresponding timezone. If the users box/line fits in the Asian Session then choose Asia/Shanghai. If the box/line is within the London Session then choose Europe/London. And the same goes for the New York Session.
Special Notes
If start time is within one period of the Start Day Timezone in the Settings, then the line/box won't display
Boxes and time lines only display when timeframe is <= 30 minute
To turn off box text label set opacity to 0%
Futures
Binance Futures Swap-Spot Basis LabelNote: This script will only work with Binance Futures Symbols
This script calculates the basis between the Binance Future and Binance Spot market for the coin you are currently viewing and paints a label on the chart which displays the percentage difference between future and spot. If the future is trading below the spot market the text will be red indicating backwardation and if the future is trading above spot, it will be green indicating contango. Please note this script will only work on Binance perps against Binance spot. The script will change based on what perp you are looking at, no inputs are required.

SPY to ES / MESSPY to ES is an indicator that converts SPY price targets to ES / MES futures price targets.
This indicator is helpful when you have price targets for SPY but trade ES or MES futures instead of SPY. It coverts the SPY price targets to ES / MES futures, and draws the SPY VWAP line on your ES / MES chart.
It supports the following lines
Bullish Above
Bearish Below
Long PT1
Long PT2
Long PT3
Short PT1
Short PT2
Short PT3
It also converts the SPY VWAP to it's current ES / MES value.
Note: The conversion do not work during pre and after market and the lines are only correct during market hours.

Binance Big Open Interest Delta Change v2 Note: This script will only work properly with Binance Futures symbols.
This script simply looks at the open interest for the symbol you are currently viewing and determines if a large change in open interest has occurred, which triggers a background color alert.
It does this by comparing the absolute value of the range of the current open interest bar with a simple average (length set by user) of the past x range. The user also determines what is considered a 'large' change in open interest by setting a multiplier with which the current range must exceed compared to the average range in order to trigger an alert.
If the change in open interest is an increase in OI, the alert is blue, and if the change in open interest is a decrease, the alert is orange.
The open interest ticker that is used for calculation is derived by adding the current ticker and "_OI" so that it auto changes each time you switch to a new Binance futures contract.

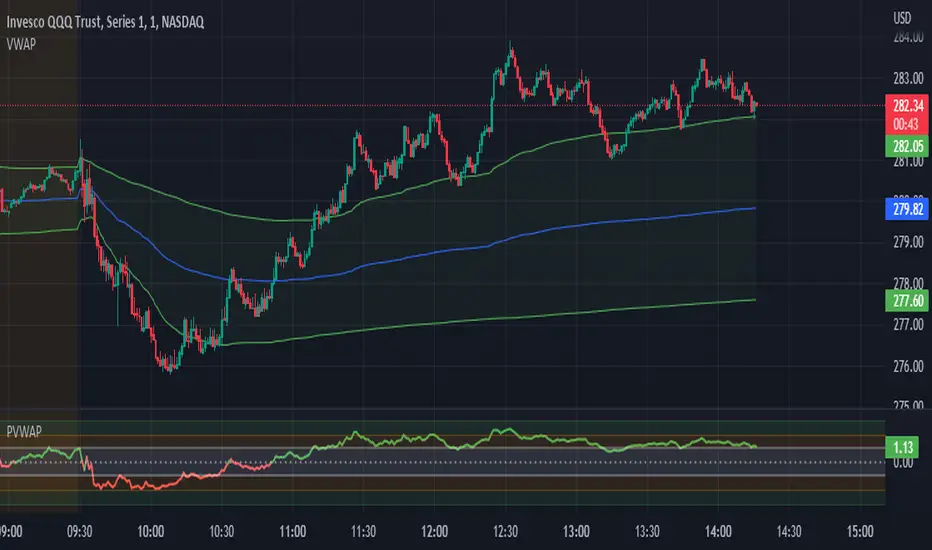
Candle Level of VWAP [By MUQWISHI]The " Price of Volume Weighted Average Price " (PVWAP) indicator calculates the VWAP standard deviation of bar price.
Features:
1. Ability to smooth the "Price of Volume Weighted Average Price" line.
2. Ability to choose the anchor period (timeframes).
Let me know if you have any questions.
Thanks.
Crude Oil: Backwardation Vs ContangoCrude Oil, CL
Plots Futures Curve: Futures contract prices over the next 3.5 years; to easily visualize Backwardation Vs Contango(carrying charge) markets.
Carrying charge (contract prices increasing into the future) = normal, representing the costs of carrying/storage of a commodity. When this is flipped to Backwardation(As the above; contract prices decreasing into the future): it's a bullish sign: Buyers want this commodity, and they want it NOW.
Note: indicator does not map to time axis in the same way as price; it simply plots the progression of contract months out into the future; left to right; so timeframe DOESN'T MATTER for this plot
TO UPDATE (every year or so): in REQUEST CONTRACTS section, delete old contracts (top) and add new ones (bottom). Then in PLOTTING section, Delete old contract labels (bottom); add new contract labels (top); adjust the X in 'bar_index-(X+_historical)' numbers accordingly
This is one of several similar Futures Curve indicators: Meats | Metals | Grains | VIX | Crude Oil
If you want to build from this; to work on other commodities; be aware that Tradingview limits the number of contract calls to 40 (hence the multiple indicators)
Tips:
-Right click and reset chart if you can't see the plot; or if you have trouble with the scaling.
-Right click and add to new scale if you prefer this not to overlay directly on price. Or move to new pane below.
-If this takes too long to load (due to so many security calls); comment out the more distant future half of the contracts; and their respective labels. Or comment out every other contract and every other label if you prefer.
--Added historical input: input days back in time; to see the historical shape of the Futures curve via selecting 'days back' snapshot
updated 20th June 2022
© twingall

VIX: Backwardation Vs ContangoVIX: Backwardation Vs Contango
Quickly visualize Contango vs Backwardation in the S&P 500 Volatility Index by plotting the prices of the futures contracts over the next 9 months
Note: indicator does not map to time axis in the same way as price; it simply plots the progression of contract months out into the future; left to right; so timeframe DOESN'T MATTER for this plot
TO UPDATE(every few months recommended): in REQUEST CONTRACTS section, delete old contracts (top) and add new ones (bottom). Then in PLOTTING section, Delete old contract labels (bottom); add new contract labels (top); adjust the X in 'bar_index-(X+_historical)' numbers accordingly
This is one of several similar indicators: Meats | Metals | Grains | VIX
Tips:
-Right click and reset chart if you can't see the plot; or if you have trouble with the scaling.
-Right click and pin to Scale A to plot on the same scale as price
--Added historical input: input days back in time; to see the historical shape of the Futures curve via selecting 'days back' snapshot
updated 15th June 2022
© twingall

Metals:Backwardation/ContangoMETALS: Gold , Silver , Copper ( GC , SI, HG)
Quickly visualize carrying charge market vs backwardized market by comparing the price of the next 2 years of futures contracts.
Carrying charge (contract prices increasing into the future) = normal, representing the costs of carrying/storage of a commodity. When this is flipped to Backwardation (contract prices decreasing into the future): its a bullish sign: Buyers want this commodity, and they want it NOW.
Note: indicator does not map to time axis in the same way as price; it simply plots the progression of contract months out into the future; left to right; so timeframe DOESN'T MATTER for this plot
There's likely some more efficient way to write this; e.g. when plotting for Gold ( GC ); 21 of the security requests are redundant; but they are still made; and can make this slower to load
TO UPDATE(once a year will do): in REQUEST CONTRACTS section, delete old contracts (top) and add new ones (bottom). Then in PLOTTING section, Delete old contract labels (bottom); add new contract labels (top); adjust the X in 'bar_index-(X+_historical)' numbers accordingly
This is one of three similar indicators: Meats | Metals | Grains
-If you want to build from this; to work on other commodities ; be aware that Tradingview limits the number of contract calls to 40 (hence the 3 seperate indicators)
Tips:
-Right click and reset chart if you can't see the plot; or if you have trouble with the scaling.
-Right click and add to new scale if you prefer this not to overlay directly on price. Or move to new pane below.
--Added historical input: input days back in time; to see the historical shape of the Futures curve via selecting 'days back' snapshot
updated 15th June 2022
© twingall

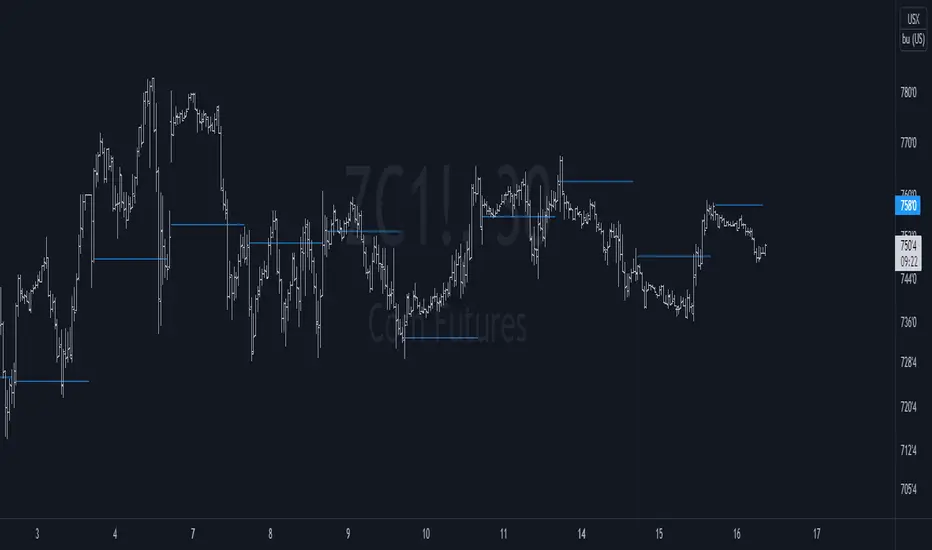
Grains:Backwardation/ContangoGRAINS: Wheat , Soybeans , Corn (ZW, ZS, ZC )
Quickly visualize carrying charge market vs backwardized market by comparing the price of the next 2 years of futures contracts.
Carrying charge (contract prices increasing into the future) = normal, representing the costs of carrying/storage of a commodity. When this is flipped to Backwardation (contract prices decreasing into the future): its a bullish sign: Buyers want this commodity, and they want it NOW.
The above chart shows a nice example of backwardation.
Note: indicator does not map to time axis in the same way as price; it simply plots the progression of contract months out into the future; left to right; so timeframe DOESN'T MATTER for this plot
There's likely some more efficient way to write this; e.g. when plotting for Wheat (ZW); 15 of the security requests are redundant; but they are still made; and can make this slower to load
TO UPDATE(once a year will do): in REQUEST CONTRACTS section, delete old contracts (top) and add new ones (bottom). Then in PLOTTING section, Delete old contract labels (bottom); add new contract labels (top); adjust the X in 'bar_index-(X+_historical)' numbers accordingly
This is one of three similar indicators: Meats | Metals | Grains
-If you want to build from this; to work on other commodities ; be aware that Tradingview limits the number of contract calls to 40 (hence the 3 seperate indicators)
Tips:
-Right click and reset chart if you can't see the plot; or if you have trouble with the scaling.
-Right click and add to new scale if you prefer this not to overlay directly on price. Or move to new pane below.
--Added historical input: input days back in time; to see the historical shape of the Futures curve via selecting 'days back' snapshot
updated 15th June 2022
© twingall

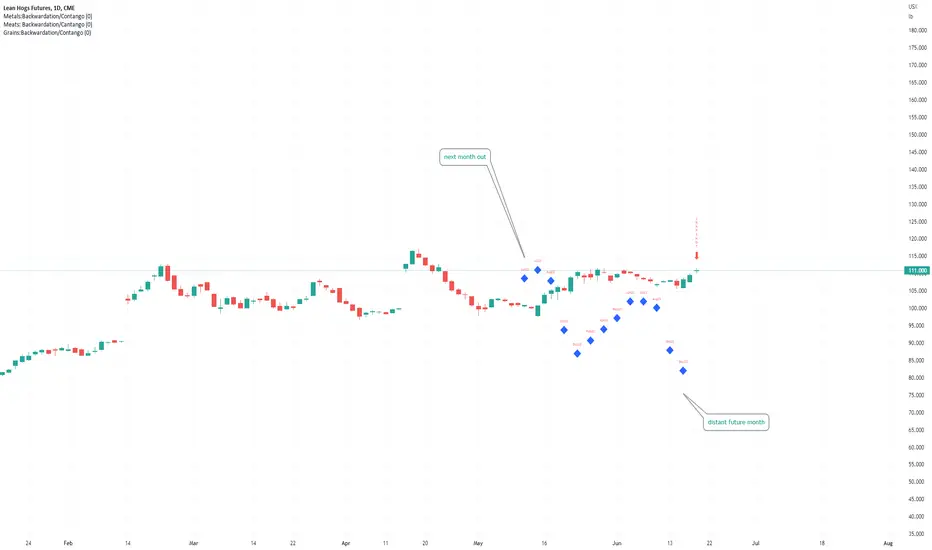
Meats: Backwardation/CantangoMEATS: Live Cattle , Feeder Cattle, Lean Hogs (LE, GF , HE)
Quickly visualize carrying charge market vs backwardized market by comparing the price of the next 2 years of futures contracts.
Carrying charge (contract prices increasing into the future) = normal, representing the costs of carrying/storage of a commodity. When this is flipped to Backwardation (contract prices decreasing into the future): its a bullish sign: Buyers want this commodity, and they want it NOW.
Note: indicator does NOT map to time axis in the same way as price; it simply plots the progression of contract months out into the future; left to right; so timeframe DOESN'T MATTER for this plot
There's likely some more efficient way to write this; e.g. when plotting for Live Cattle (LE); 8 of the security requests are redundant; but they are still made; and can make this slower to load
TO UPDATE(once a year will do): in REQUEST CONTRACTS section, delete old contracts (top) and add new ones (bottom). Then in PLOTTING section, Delete old contract labels (bottom); add new contract labels (top); adjust the X in 'bar_index-(X+_historical)' numbers accordingly
This is one of three similar indicators: Meats | Metals | Grains
-If you want to build from this; to work on other commodities ; be aware that Tradingview limits the number of contract calls to 40 (hence the 3 seperate indicators)
Tips:
-Right click and reset chart if you can't see the plot; or if you have trouble with the scaling.
-Right click and add to new scale if you prefer this not to overlay directly on price. Or move to new pane below.
--Added historical input: input days back in time; to see the historical shape of the Futures curve via selecting 'days back' snapshot
updated 15th June 2022
© twingall
Futures Exchange Sessions 2.0Description
Successor to Futures Exchange Sessions indicator. Completely rebuilt code from the ground up. Every feature has been redesigned and refactored to be the most beneficial while allowing for complete configuration by the user.
This indicator displays Futures Sessions as live boxes that expand dynamically as price moves over the time interval. These boxes make liquidity levels extremely easy to spot and visualize. It helps the user identify market structure and develop their own bias of price action. Everything about the Session boxes can be configured. Box color, border color, border style, and border width are all individually controllable. Each Future Session can be turned on or off at any time. Also, each box has their own text label (Asian Session, London Session, New York Session) and this text can be moved around the box, change color, and change size.
Previous days highs and lows (major liquidity levels) are always important to the futures trader. This indicator now allows the user to individually display the three previous days highs and low levels as lines with optional label. Each line can be independently toggled on or off and like always, every conceivable customization option is available to the user. And the labels can be moved to the right (via the Input Settings) to allow unobstructed views of candles.
The midnight EST open and 8:30 AM EST open horizontal lines (developed by the Inner Circle Trader) are returning in this indicator. But the biggest improvement is that the lines stop at the current bar or the last bar of the trading day. Additionally, the time lines are displayed on previous days so the user can easily see how the candles reacted to these important times of the day.
The Session boxes and the horizontal time lines now can be set to only display a certain number of day back. If the user wants just to see Session boxes for the previous day only, they can do that. If the user wants to see the last 15 days of boxes or lines it is very easy to increase the days back in the settings. Currently, the max days back is 80 calendar days.
Additional Images
Easily visualize and understand price action across time
Everything is customizable so the user can easily match this indicator to their color preferences
Special Notes
To turn off box session text set opacity to 0%
Boxes and horizontal time lines only display when timeframe is <= 30 minute

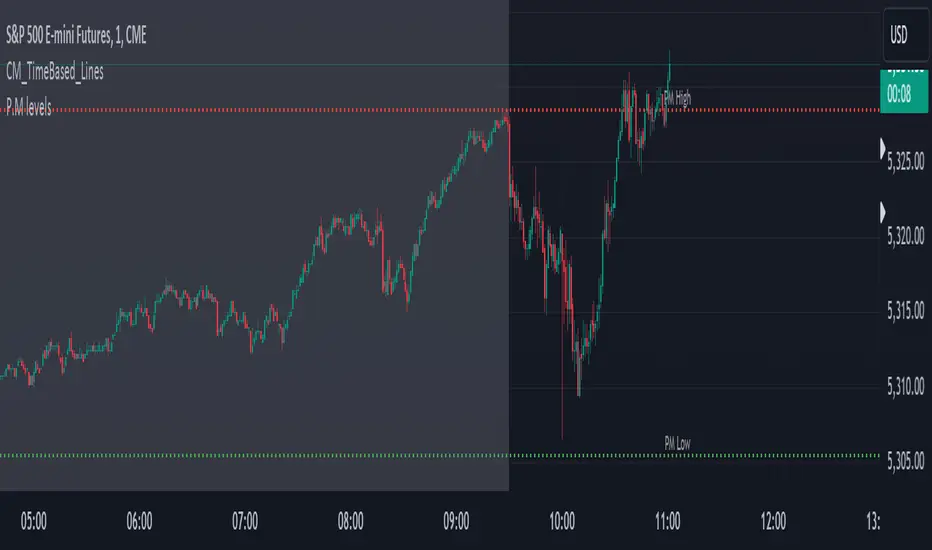
Pre-Market levels for Futures This indicator draws the Pre-Market Low and High for futures. Futures do not really have "P.M" because they are almost always open, but I chart /ES and trade $SPY options, so this has been useful in finding P.M levels.
ICT Index Futures Session LinesICT Index Futures Session Lines
Description:
The script is based on one of ICT's concepts on trading Index Futures. The script lays out the daily range from an intraday basis.
Range:
00:00 - New York Midnight
08:30 – New York Open (News events come out)
12:00/13:00 - New York Lunch (No trade time period)
13:30 - (Algorithm)
16:30 - Close
* The open, high and low lines are plotted from 00:00 to 08:30
How To Use:
You will need to check the daily bias. Prior to 8:30 you are to look for previous swing points where liquidity may exist. During the open you want to see if a high or low is taken out, and then wait for an energetic break/displacement for a potential FVG/imbalance retracement entry.
Strategy is for LTF (1 to 15m)
Default time zone is set to America/New_York (UTC New York), so lines will be plotted correctly regardless of user’s local UTC chart setting.

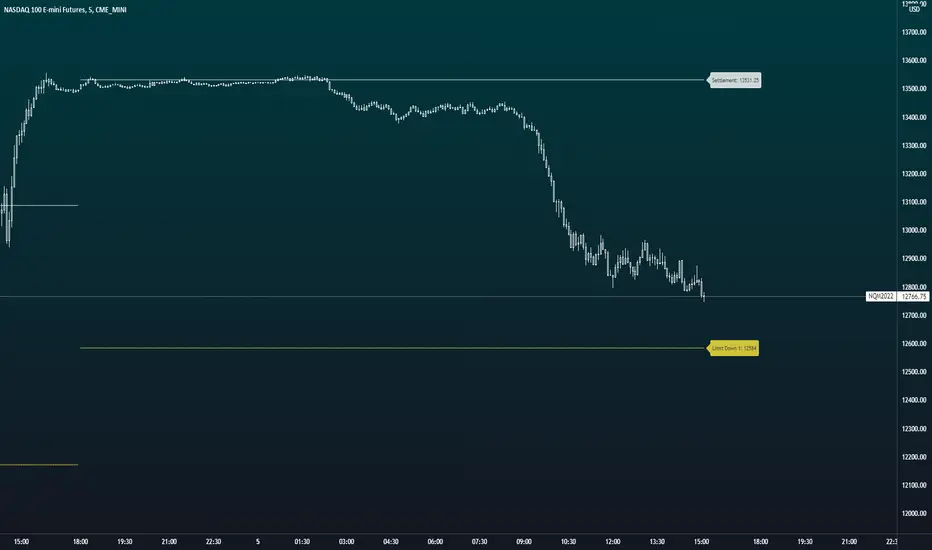
U.S. Futures Price LimitsThis scripts plots settlement and the circuit breaker limits for U.S. Equity Indexes. The current limits for the equity index futures are + and - 7%, 13%, and 20% from the previous day's settlement price. If price reaches these levels trading is either paused briefly or for the remainder of the day. The full resource (CME Website) is below.
There are plans to add the remainder of the most actively traded U.S. Futures Markets.
To find out more about the price limits it is best to use the CME's website as a reference.
www.cmegroup.com
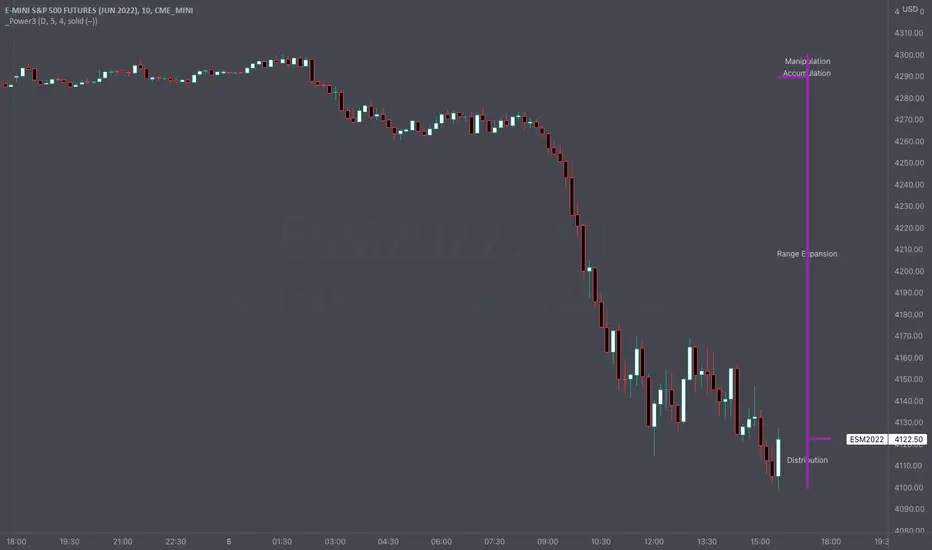
Intraday Power 3 VisualDescription
This indicator draws a dynamic "Open High Low Close" type visual on intraday charts so the trader can easily keep track of the daily/weekly movement. This indicator was inspired by the Inner Circle Trader’s (ICT) “Power 3” concept, which is Accumulation, Manipulation, and Distribution of price on a daily timeframe.
Visual
This indicator plots the chosen timeframes opening price along with a live line for the current price. This makes it very easy to identify the daily/weekly range along it’s open. And the user can combine this indicator with my other indicator “Futures Exchange Sessions” to plot the midnight EST & 8:30 AM EST lines to get a great summation of over night price action.
Inputs and Style
In the Input section the user can dynamically switch between Daily and Weekly timeframes. Built in ability to move the entire Visual to the right makes preventing indicator overlap a breeze. All of the lines can be configured: color, style, and width. Independently toggle ON/OFF the Power 3 labels (Accumulation, Manipulation, Range Extension, Distribution) and can change labels color. The labels dynamically move and switch positions based upon bear or bull daily/weekly range.
Special Notes
The Futures market is open 23/5. It is closed everyday for 1-hour at 5pm EST and closed over the weekends. Because this Intraday Power 3 Visual is drawing in the 'future' on the users TradingView chart, when the visual is close or in a time when the market is closed, the visual doesn't behave properly. This is because TradingView doesn't display times when the Market is closed, thus the drawings cannot be displayed during those times. There is nothing wrong with the script. Please wait until the Market is open and the visual will be drawn normally.
This indicator is intended for use in the Futures Market
Futures Exchange SessionsIn the 24-hour trading of the futures market, this indicator provides the user with full customization concerning the most important factor: time. This indicator is centered around three main visualizations: labels, backgrounds, and lines that minimalistically allows the user to keep track of the many time intervals that occur during a futures market 24-hour trading cycle. It also artfully displays the previous days highs and lows. And everything can be individually toggled and configured so the user can get exactly what they want.
Labels
There are three main futures market sessions in a 24-hour period: the London, New York, and Asian Sessions. Each session is given an independent label for the open and close times. The six labels (LO, LC, NYO, NYC, AO, AC) can be individually toggled on or off, the label background color changed, the text switched between black or white, and the height can be lowered or raised. These customizations are intended to give the user full control of the session they are interested in at the moment.
Backgrounds
Backgrounds are the heart of this indicator. There are different colored transparent backgrounds for each of the futures sessions. So the user can clearly see the session they want to highlight without cluttering their chart and getting in the way of analyzing the candles.
If you are familiar with the London and New York killzones, these backgrounds are each individually configured.
If you are familiar with the Inner Circle Trader’s (ICT) NY Morning and Afternoon sessions, these are available. Also, most times weird price action occurs during the lunch hour of these sessions. The London and New York have a background for their respective lunch hours so the user is never caught of guard during these periods.
Lines
The markets are constantly looking for liquidity. To help the user see runs on liquidity, this indicator projects the previous days highs and lows on to the current day with a line and a price label. The line make it very easy to see where price may be headed. See the image below for the perfect example of this phenomenon. Each of the lines can be independently controlled by color, style, and width. And even the labels can be toggled on or off if the user would prefer just to see the lines. Lastly, there is a line that marks the midnight open price in EST.
Special Notes
This indicator is specifically designed for futures tickers.
All of the backgrounds are not designed to be turned on a once (there are many that overlap). They are designed to give the user ultimate control over exactly what timeframe backgrounds to display on their charts.
The labels only appear when timeframe is 1 hour or less.

Future TimevalueThis indicator plots a chart of future timevalue for all NSE index and NSE FNO Stock. It plots the difference of future and spot's 1min candle close price.
Just open any index or stock spot chart in 1 min timeframe(works with higher tf also) and add the indicator.

ICT Index Futures Vertical LinesLearning to trade is complicated enough, so to make the process it little less daunting, I decided to create something helpful.
This indicator relieves you of drawing the same lines and levels over and over each trading day.
It also provides key price levels for you to watch when the trading session starts.
This project is inspired by the ICT 2022 Mentorship.
This indicator was designed and tested to practice and trade the CME Index Futures like Nasdaq, S&P500 and the DOW.
The concepts by ICT are known to work on other markets like Crypto, but I haven't tested that so use at your own risk.
Features:
When a new trading day starts, the following lipstick is put on the chart:
Vertical lines:
- Globex (Overnight) Session Start @17.00
- New York Midnight @ 00:00
- New York AM Session Start @ 08.30
- CME Open @ 09.30
- New York Lunch Start @12.00
- New York PM Session Start @13.00
- New York PM Session End @ 16.30
Important levels:
- Globex (Overnight) Session Opening price
- Globex (Overnight) Session High
- Globex (Overnight) Session Low
- New York Mignight Opening Price
Additional features:
- Shows the day of the week at the bottom for your convenience
- London Killzone Vertical lines
- London Killzone Highlight
- NY Lunch No-Trade-Zone Highlight
- Important levels have a small label to show their meaning and price
- Almost everything is customizable: colors, line types, times, etc
- Customizable timezone setting in case you don't want to work on ICT's recommended timezone (New York UTC-4)
- Toggle to Show only Today's drawings on the chart. You can choose to display all chart lipstick from almost a month of trading data to do your research. Ideal if you want to determine the daily profiles for example.
Screenshots:
London Killzone Highlight turned on:
Multi Day Lipstick:

Settlement priceThis script is meant to be used intraday, on futures products.
It charts the previous day/week/month settlement price as a constant level intraday.
The settlement price of a product is calculated by the exchange at the end of each day. It is shown in the D/W/M chart as the close price. The settlement price does not coincide with the last close price intraday, thus creating the need of a script like this.
The settlement price can be a pivotal price in intraday futures trading, as it can act as support or resistance
You can select the resolution of the settlement by the "Resolution" input

Binance Futures/Spot PriceShows the last price of either the spot or futures market on Binance, for the current coin.
It shows futures if you are in a spot market, and spot if you are in futures.
Currently this only works for USD stable coin pairs (BUSD, USDT, USDC, ...).
I don't plan to add COIN future pairs, it's not useful to me.
Additionally, it allows you to show the lowest and highest traded price (in the opposite market you are currently on: spot/futures) for a given period, and the respective chart, if you are into that sort of thing.
Bye :D

FX Mini-Day/Index Dividers V2This is a combination of the Mini-Day Separator Indicator, timings based off the research by Tom Henstridge/@LiquiditySniper and additional Index KZ delineations, based on ICT's 2022 Youtube Mentorship.
*It borrows some minor code from Enricoamato997 . Credit where it is due!
This is a joint effort by myself, @vbwilkes / Offseason Vince and @Tom_FOREX / TraderTom on the Index/Index Future portion.
Index Future Example
Forex Example

Session Levels - Ultimate Range IndicatorSession Levels - Ultimate Range Indicator
Primarily developed for trading the E-MINI Futures Markets like NQ or ES from the CME Group,
but also more than suitable for Crypto or other instruments.
This indicator highlights the chosen session, which can be Globex, Asian, London and New York.
It plots the important levels and also renders the Opening Range as it forms (a.k.a. Initial Balance).
After the 1st hour Opening Range is finished, it can plot the Standard Deviations / Projections.
See below for a complete feature list.
All Opening Ranges on chart and for the New York session the Range Projections are turned on:
s3.tradingview.com
How to use (example):
If you are trading the Nasdaq Futures (NQ!)
Enable the Globex Overnight session. Basically in the Futures Market, the Globex session is everything outside of US trading hours of Stocks. This draws the important overnight levels, like the Low, 25%, 50%, 75% and the High.
Enable the New York Session with Levels and Opening Range. Generally, 70% of the time the 1st hour will put a Low or High of the day.
If the price is trading above the Globex Low, most likely the Low of the Day is formed and the price target for the day will be 1.5x Standard Deviation and 2x Standard Deviation.
[*} Deviation of the Initial Balance depends on the volume ad overall market structure.
** This is not financial advice or any guarantee **
Features:
Show each Session Highlighted on Intraday chart in it's own color (each session can be turned off and has customizable times and color)
Show Line Levels of each session: Low, 25%, 50%, 75% and the High (customizable color)
Show the Opening Range (Initial Balance) of the Asian, London and New York session. Note: NY has more options.
Opening Range is displayed as a box with level lines (customizable color)
Levels are drawn to the end of the NY Cash session (customizable time)
Show IB Standard Deviations 0.5 - 3.0. Calculated from the Opening Range (Initial Balance)
Option to display Higher Timeframe levels: Previous Day Open/Close and Previous Week Open/Close
All level lines and OR boxes size dynamically as the session progresses
Built in Alerts for when price hits key levels. e.g. Alert when price crosses the NY Opening Range High. Or an Alert when the first STDEV is hit.
Option to toggle display of drawings for Today's trading session only, or Show all recent session levels. This keeps the chart clean or not.
Extras:
The NY Opening Range also has a 50% level line
The NY Opening Bar can be highlighted separately
The Level Lines can have small labels turned on/off. Values are only shown on mouse over to keep a clean chart
Keep in mind:
1) This indicator works on all instruments, but on instruments with limited market hours, your chart setting
has to be set to "Extended Hours" otherwise. For example TSLA on NASDAQ.
2) The Exchange Time Zone for the CME Group is Chicago UTC-6. So the session times you configure in the settings menu are based on that timezone too.
3) Globex opens at 5pm CST and closes when the US session starts 8:30CST.
4) When enabling the Alerts in the Indicator settings, be sure to also create an alarm for this indicator using the Alarm function of Tradingview.
