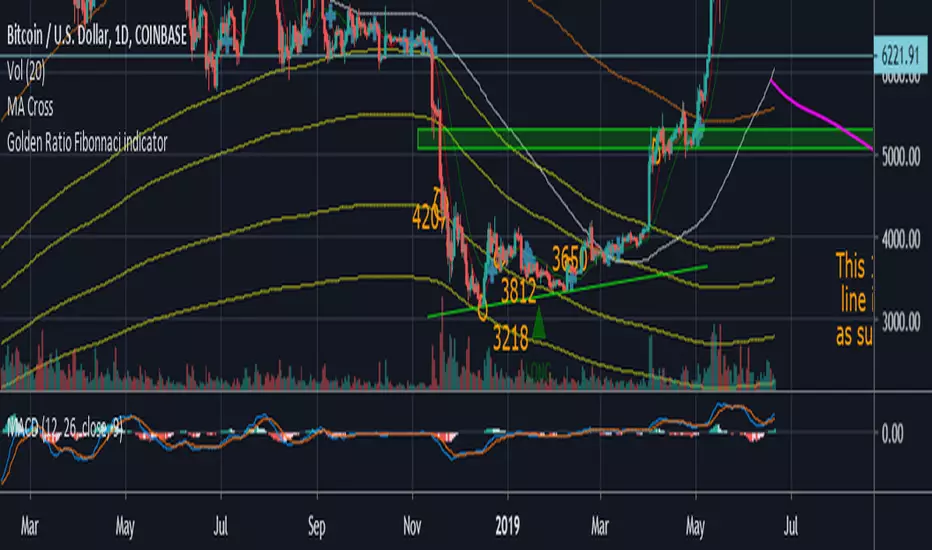
Golden Ratio Fibinnaci IndicatorI didn't see this one already it isn't my original idea either. I pulled the formula's from an article on medium, I also added few bear market bottom fib indicators.
Credit to the article I pulled the formula from.
The Golden Ratio Multiplier
Unlocking the mathematically organic nature of Bitcoin adoption
Go to the profile of Philip Swift (@PositiveCrypto)
Philip Swift (@PositiveCrypto)
Jun 17, 2019
By Philip Swift
Golden
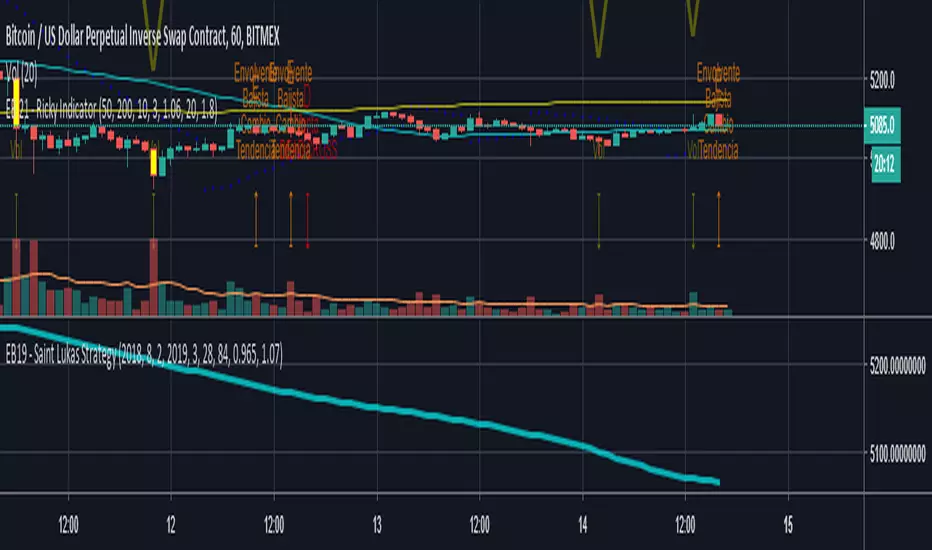
EB 21 - Ricky IndicatorIndicates multiple signals:
SAR
2 SMA
MAST Detector
Bullish Engulfing
Bear Engulfing
Gold and Dead Cross
Volume Increment
(YEK) Combo(YEK) Combo is a combination of several indicators (listed below). You can use them together or one by one. Just click settings, and choose which of them to be shown.
Here are the indicators included in this script:
- Ichimoku Cloud
- Bollinger Bands
- Moving Average 1
- Moving Average 2 (In case of detecting golden crosses or death crosses)
- Exponential Moving Average
- T3 Tillson
- MavilimW
Enjoy!

Custom Time Frame Moving Aver Cross w/Alerts - VWAP - BBandsWork in progress
- made the VWAP really small because it is only used on the shorter time frames, but it is nice to have at times
- BBands are great for showing me when to pay even more attention, when they are squeezing
Open to suggestions

Golden Short Testing 1.1New version of Golden Short Strategy based on the golden number theory and is for long positions. It has two parameters:
1. Step to form the body of candle to generate a possible enter
2. Number of steps to form the body of the candle
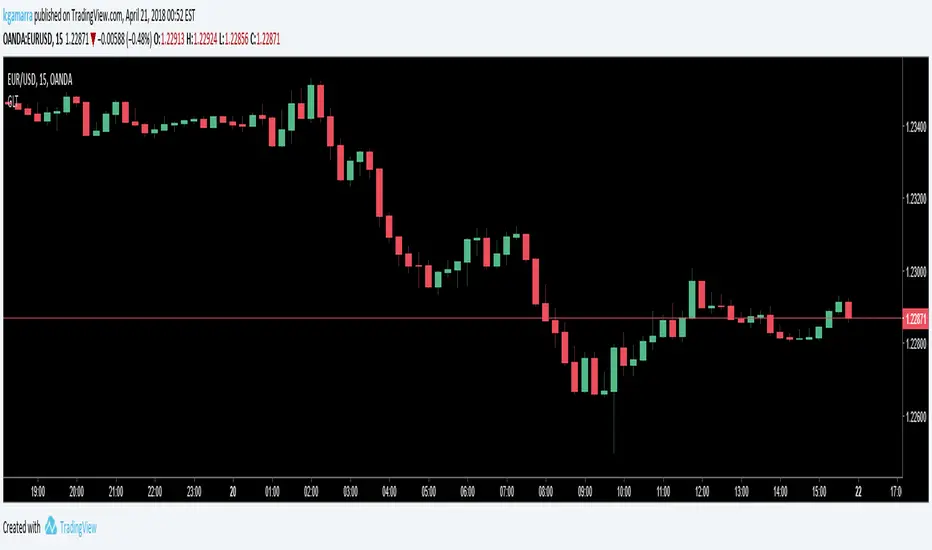
Profit 1: 1:0.61 Risk/Reward Ratio -> WinRate on EURUSD: 61.41%
Values on EURUSD:
Interval: 1h
Step: 0.00022
Body: 3

Golden Long Testing 1.1New version of Golden Long Strategy based on the golden number theory and is for long positions. It has two parameters:
1. Step to form the body of candle to generate a possible enter
2. Number of steps to form the body of the candle
Profit 1: 1:0.61 Risk/Reward Ratio -> WinRate on EURUSD: 66.70%
Profit 2: 1:1.61 Risk/Reward Ratio -> WinRate on EURUSD: 48.04%
Profit 3: 1:3.23 Risk/Reward Ratio -> WinRate on EURUSD: 28.40%
Values on EURUSD:
Interval: 1h
Step: 0.00022
Body: 7

Golden Short TestingThis scripts is based on the golden number theory and is for short entries. It has three parameters:
1. Step of the body i.e: pip-0.0001, cents-0.01
2. Number of steps of the body of the candle
2. Number of contracts to put on 3 orders executed at the same time

Golden Long TestingThese scripts is based on the golden number theory and is for long entries. It has two parameters:
1. Number of pips of the body of candles to put an entry
2. Number of contracts to put on 3 orders executed at the same time
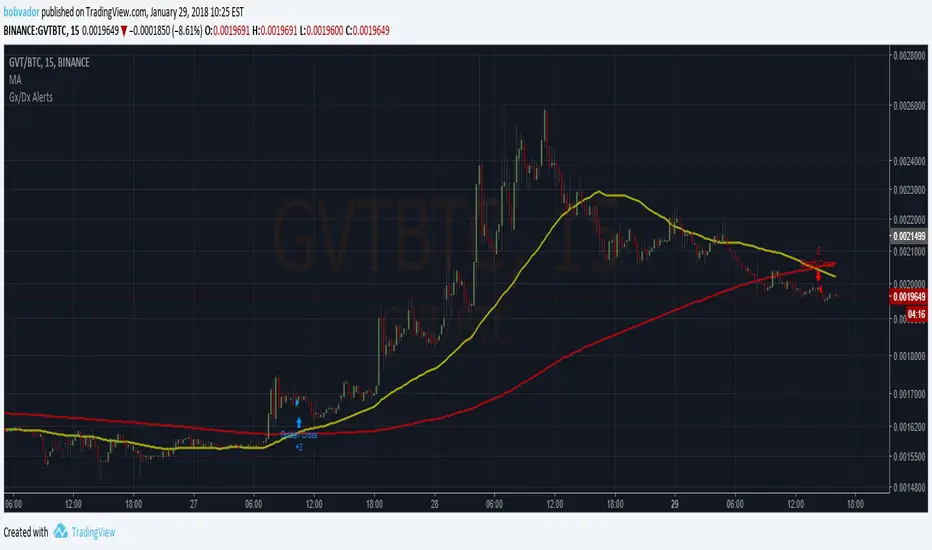
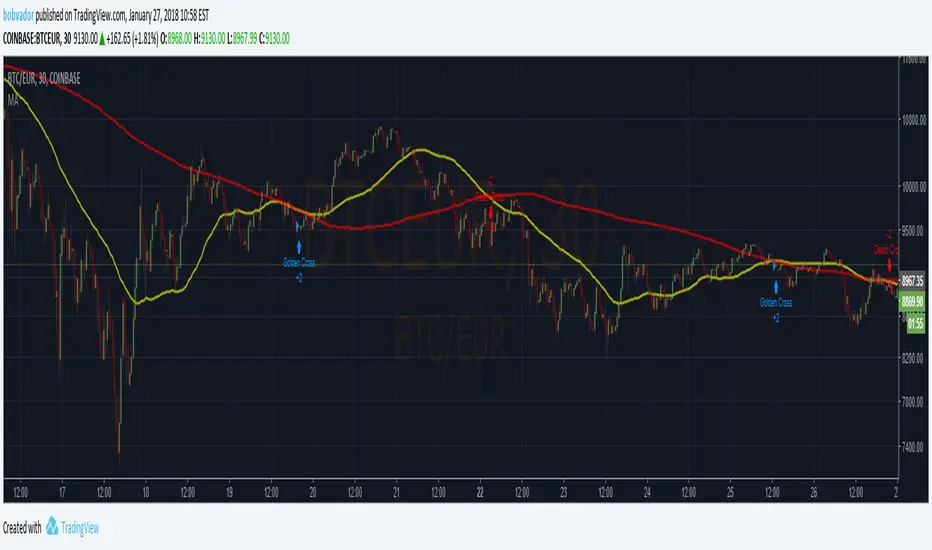
Moving Average 50/200 Golden Cross or Dead CrossA strategy is to apply two moving averages to a chart, one longer and one shorter. When the shorter MA 50 day scrosses above the longer term MA 200 days it's a buy signal as it indicates the trend is shifting up.This is known as a "golden cross."
When the shorter MA crosses below the longer term MA it's a sell signal as it indicates the trend is shifting down. This is known as a "dead/death cross"
For cryptocurrencies use 4 hour charts.

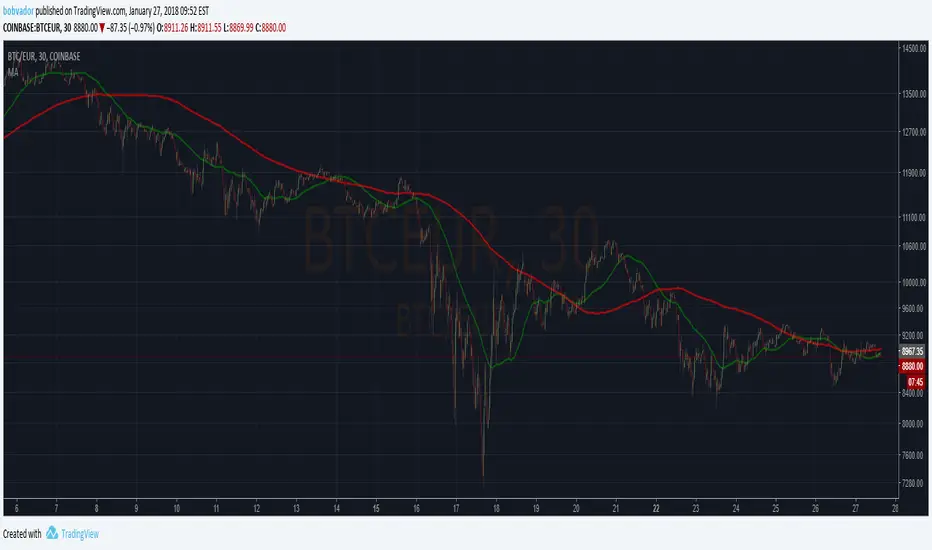
GoldenCross by PuffyThis is a simple trading strategy that seeks the Golden Cross and Death Cross on the 4HR chart. The fast moving indicator in this strategy is the EMA 50 and the slow moving indicator is the EMA 200. When the EMA 50 crosses over the EMA 200 the strategy indicates a buy. When the EMA 50 crosses below the EMA 200 the strategy indicates a sell. This strategy averages trades in the 40 - 50 day range and as such should not be used with heavy leverage.

Alerts for Golden/Death CrossesTo use with this strategy/ .
This one enables to set up alerts on TradingView (not possible inside a strategy script)
Death & Golden Cross Moving Average StrategyJust a simple strategy to put two MA on the same chart and find golden/death crosses.
Default on 50/200.
Moving AverageJust a simple script to put two MA on the same chart and find golden/death crosses.
Default on 50/200.
Grahn Gyllene KorsGrahn Gyllene Kors strategy is an idea that was brought to me and I was asked to create for the client to be used as an early alert signal for when BTC 0.05% is trending. The client has graciously now decided that this should be shared with everyone.
This is an EMA / Trend Explorer useful for identifying trends before EMA's cross and also identifying and experimenting with various EMA lengths and candle trends. There will be a companion Alert study for this released soon in which signals may be sent to the user via sms or email.
EMA Fast and EMA Slow may be adjusted in length and color and their display may be turned on or off.
Bullish X% F/S controls what percentage the EMA Fast should be above EMA Slow before considered bullish and is represented by the Green band on the chart.
Neutral > Y% < is what percentage surrounding the EMA Slow should be considered neutral and is represented by the Yellow band on the chart.
Bearish Z% S/F controls what percentage the EMA Fast should be below EMA Slow before considered bearish and is represented by the Red band on the chart.
Trend Enable determines whether Trend Strength is enforced in addition to EMA divergence.
Bull Strength is the number of candles ranging from 0 to 5 that should be consecutively higher in value before considered to be a trend.
Bear Strength is the number of candles ranging from 0 to 5 that should be consecutively lower in value before considered to be a trend.


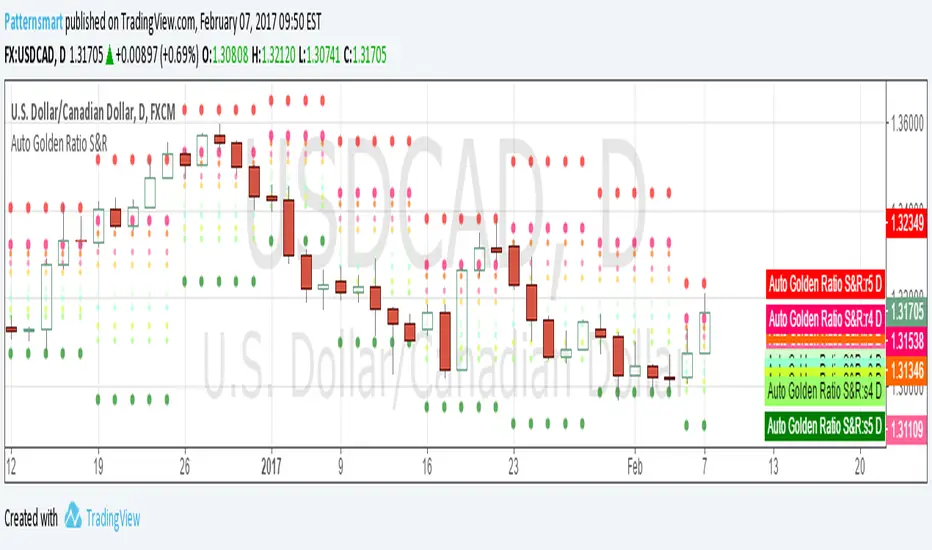
Automatic Golden Ratio Support & ResistanceThe golden ratio is also called the golden mean or golden section.
It has been used to analyze the proportions of natural objects as well as man-made systems such as financial markets.
The mathematics of the golden ratio and of the Fibonacci sequence is intimately interconnected. The Fibonacci sequence is: 1, 1, 2, 3, 5, 8, 13, 21, 34, 55, 89, 144, 233, 377, 610, 987, ....
This Golden Ratio indicator automatically plots 5 support levels and 5 resistance levels based on the golden ratio for current timeframe. It shows a possible price range for current session, you can easily identify the major and minor support/resistance levels from the chart.
The levels of support and resistance are formed at the beginning of a new session
This indicator works on all default time frames.
It will never repaint.
There is no parameter. All you need to do is to load it to your chart.
Click the image links to view it in original size.
3.bp.blogspot.com
2.bp.blogspot.com
2.bp.blogspot.com
3.bp.blogspot.com
2.bp.blogspot.com
2.bp.blogspot.com
1.bp.blogspot.com
////////////////////////////////////////////////////////////
// Technical Analysis & Research Patternsmart
//
// Custom indicators, Strategies, SCAN, Screener, Backtesting, Converting service for:
// Tradingview, NinjaTrader, Thinkorswim, MetaTrader, MetaStock, Multicharts, Prorealtime, etc.
////////////////////////////////////////////////////////////
Golden Cross KAMAThe usage is very easy. When the line is green you can open long position, when the line is red you can open short position and when it's black just check by yourself.
Usually I use it with RSI and Bollinger Bands , in order to determine when the signal is strong or weak.
Just play with fastest and slowest SC to adjust the smoothness.
