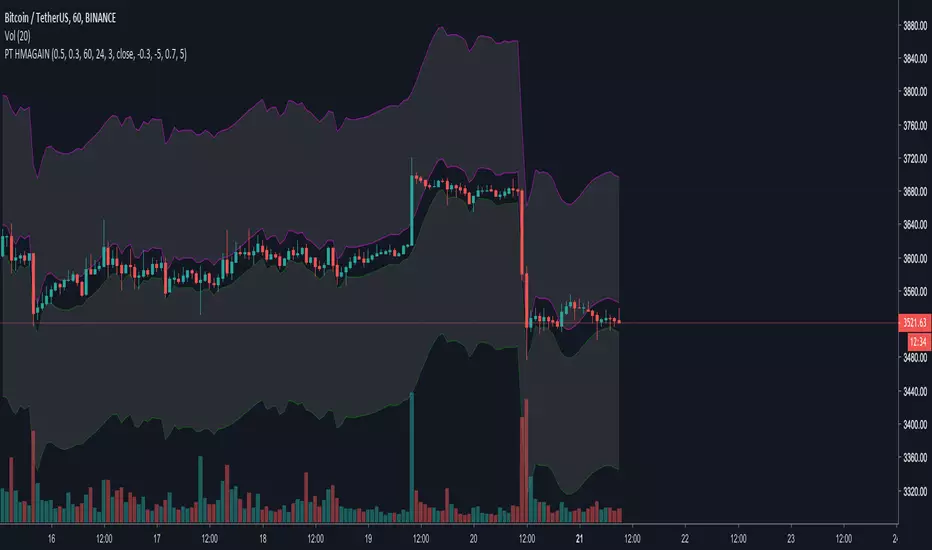
[ProfitTrailer] HMAGAIN Buy/Sell StudyProfitTrailer buy/sell study for HMAGAIN strategy.
The script highlights the region where trailing is most likely to succeed.
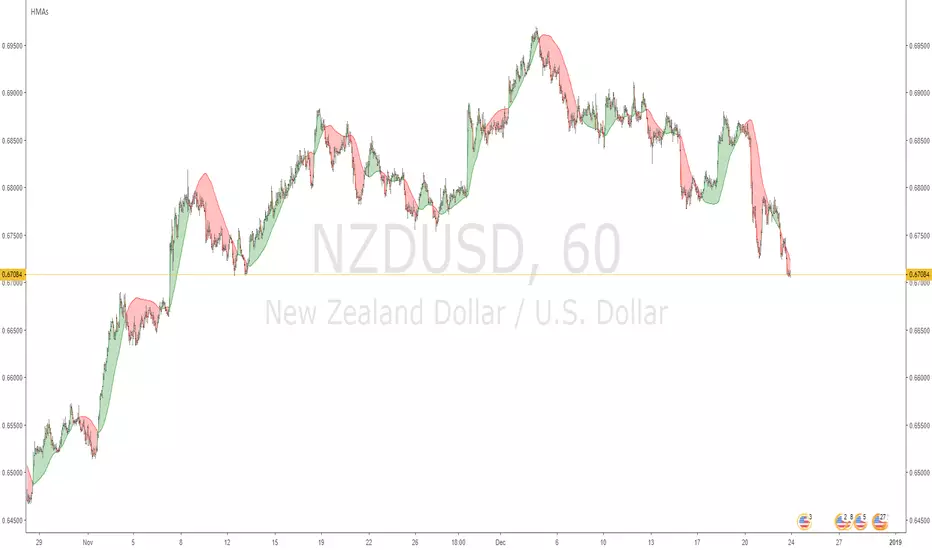
Hull Moving Average (HMA)
CryptoCoyns HullMA [v2018-12-10]CryptoCoyns Hull Moving Average
This indicator implements the Hull moving average.
The Hull Moving Average (HMA), developed by Alan Hull, is an extremely
fast and smooth moving average. In fact, the HMA almost eliminates lag
altogether and manages to improve smoothing at the same time. A longer
period HMA may be used to identify trend. If the HMA is rising, the
prevailing trend is rising, indicating it may be better to enter long
positions. If the HMA is falling, the prevailing trend is also falling,
indicating it may be better to enter short positions. A shorter period
HMA may be used for entry signals in the direction of the prevailing trend.
The Source for price can be defined. i.e. Close, Open, High, Low, etc.
The period length used can be defined.
MA Line colour is fully configurable.
If you get some value out of this indicator please consider making
a small donation to my favourite charity the Save the Childrens Fund.
Every donation will make a difference to the lives of children.
All donations over $2 are tax deductable. You can donate here:
savethechildrenfundraising.org.au
Copyright (c) 2018, Grant Cause aka CryptoCoyns

Hull cloudIntroducing a new indicator - Hull cloud. It bears some resemblance to the Ichimoku cloud , but is basically built with the Hull moving average , using a Fibonacci sequence with the usual seed of 0,1 for the lengths and offset (55, 89, 144, 233, 377, 610). These settings can be changed by the user.
1. Simple Hull MA - Hull MA with default of 89 periods.
2. Cloud positive line - Short period of 233 to make the positive line of the cloud.
3. Cloud negative line - Long period of 610 to make the negative line of the cloud.
By default, cloud is offset (forward) by 55 periods.
4. Lagging span - 144 period Hull MA with negative offset of 89 periods.
5. Forward span - 377 period Hull MA with positive offset of 144 periods.

HullDEMA MTFThis indicator based on non repaint HULL 720 min and dema MTF
i suugest to keep the Dema MTF on the time frame of your graph
using the HULL 720 min we can see how the signal of DEMA and the crossing of the hull 720 either by DEMA or by the candels
this enable us to detect trends more easy

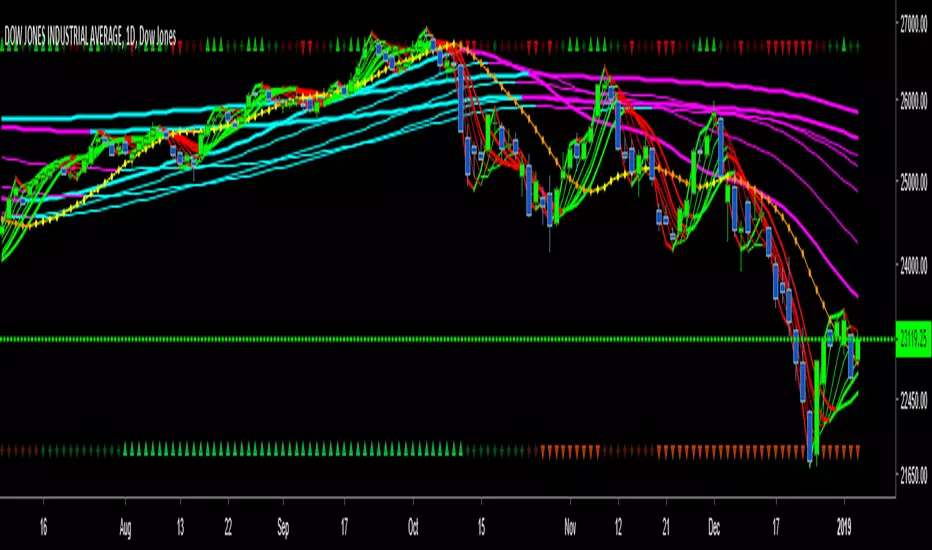
Multiple Moving Average Colors7 moving averages in 1 indicator, including the Hull Moving Average.
I've updated with some graphics that print at the top of the chart (you can change color and placement on the indicator settings page)
All 7 MAs Up - Green and up triangle
All 7 MAs Down - Red and down triangle
4, 5 or 6 MAs Up - Dark green and a square
4, 5 or 6 MAs Down - Maroon and a square

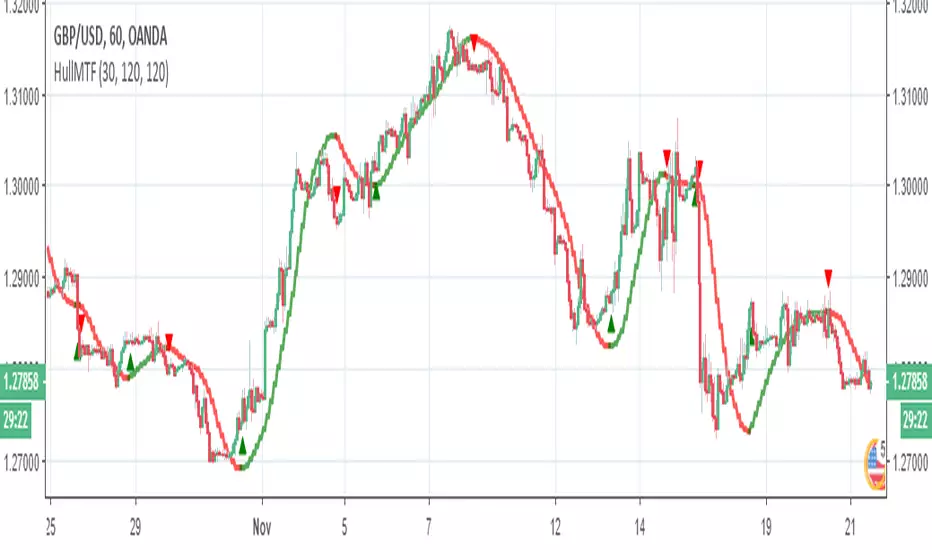
Hull Moving Averages2 Hull Moving Averages
Alan Hull developed Hull Moving Average in 2005 in his quest to create a moving average that is "responsive to current price activity while maintaining curve smoothness".
Hull claims that his moving average "almost eliminates lag altogether and manages to improve smoothing at the same time".
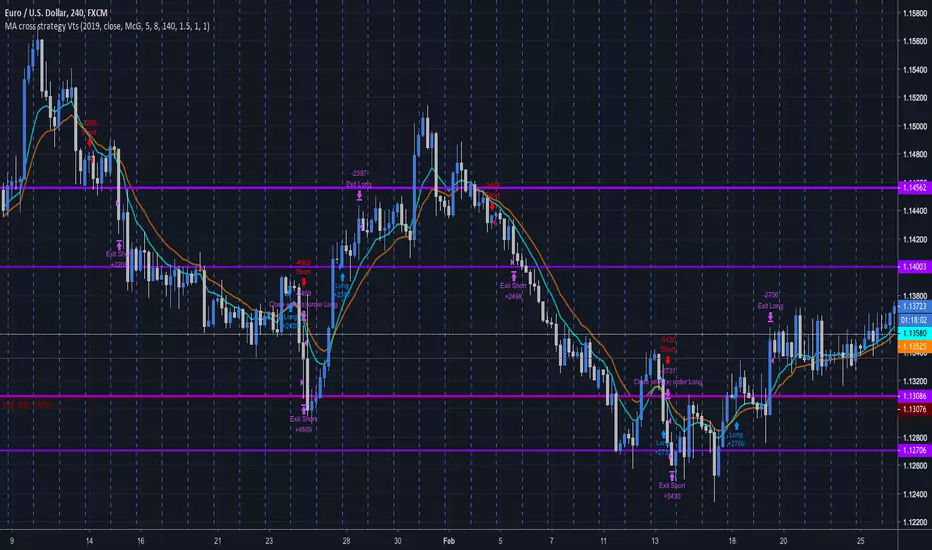
MA cross strategy VtsThe simple Moving average cross strategy is here implemented.
I guess there are multitudes of similar scripts around.
I post this one since I was asked by some friends, and I'll let it free to use for anybody.
Here you can choose the year where to start backtesting, the source, the type of MA, the SL and TP multiplicators of ATR, for which you can also choose the averaging period.
Feel free to modify this script. I would be grateful if you could preserve the first lines of comments including my user names.
The MA cross strategies can be very effective, especially when used on the daily TF.
Try for example the combo EMA15-EMA30 SL=1.5ATR TP=1ATR on EURCHF daily to get an impressive 83% win ratio.
Or EMA20-EMA81 on the GBPCHF to get an 87%.
In those cases where EMA does not perform well, try to set a less lagging MA, like the Hull MA.
I hope you like this script so that you could push the like button multiple (odd) times and you start following me.
I've got a bunch of other interesting scripts to share.
Comments and suggestions are welcome.
Bitcoin HMA Daily - SignalsThis is a simple strategy based on the HMA for BTC with good results. Make sure to set your alerts to "On candle close" to avoid false positives.
Script contains an alert for a Long and Short signal.

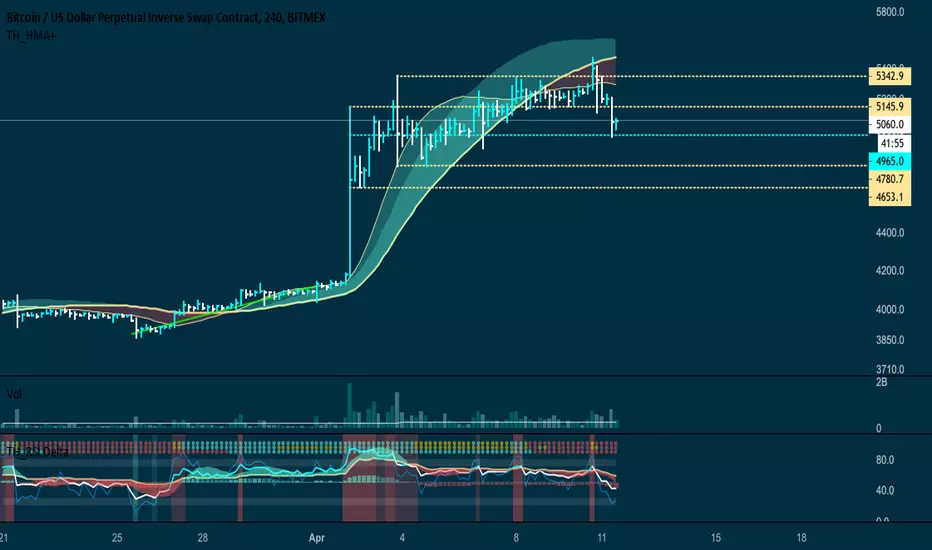
HMA EABy default, the strategy works best on 1h timeframe. In theory, it should run well on any timeframe, but you will absolutely need to adjust the Hull Resolution. I recommend starting with 4x the current view (aka, if you are using 5m candles, set the resolution to 20min, which is 4 * 5m).
The settings are pretty self explanatory:
Start Month - Month of the year to begin backtest (automatically beings at 1st of month)
Risk Per Trade (%) - How much of your equity to risk on each trade.
Leverage - Amount of buying power/Margin you have available
Loss (pips) - Distance in pips from the entry to place Stop Loss
Profit (pips) - Distance in pips from entry to place target Take Profit
Trigger Trail (%) - Distance in percentage from entry to begin a trailing Stop Loss
Trail Dist. (pips) - Offset distance of trailing Stop Loss
Hull Res. (min) - Length of candle in minutes to use when calculating the HMA
Hull Period (bars) - Smoothing period for HMA

4 Hull MAThe Hull Moving Average (HMA) was developed by Alan Hull in 2005 for the purpose of reducing lag, increasing responsiveness while at the same time eliminating noise. Its calculation is elaborate and makes use of the Weighted Moving Average (WMA). It emphasizes recent prices over older ones, resulting in a fast-acting yet smooth moving average that can be used to identify the prevailing market trend. It can also be used for entry and exit signals. I have integrated 4 HMA's into one which can be used for taking entry and exits similar to 4 EMA strategies. All credit goes to Alan Hull for developing this technique.

@coinpocalypse - HMA SignalsThis script gives long and short entry's (make sure to use alerts on candle closes)
Currently working best on H4 and M15 charts for Bitcoin (BTCUSDT, XBTUSD)
First version


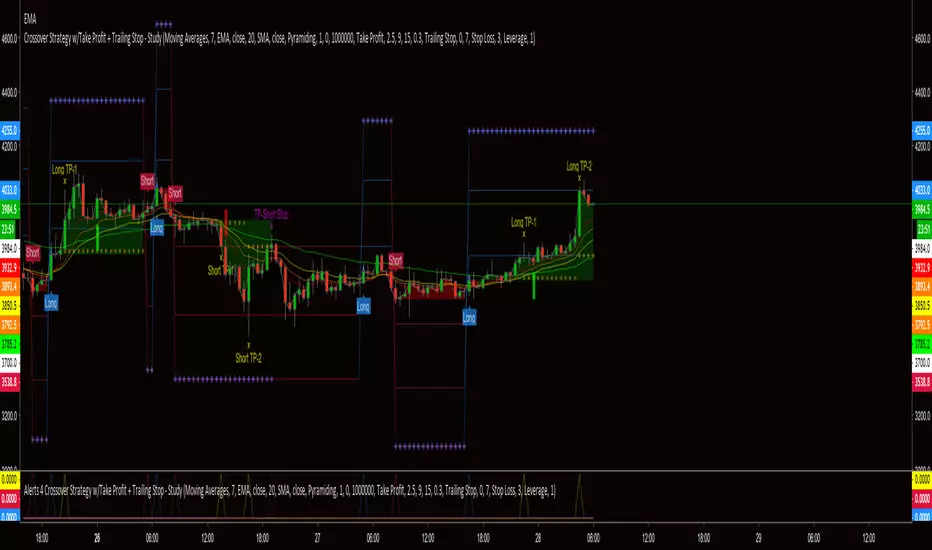
Crossover Strategy w/Take Profit + Trailing Stop - StudyThis script is a result of hours of trail, error and research. If something is not functioning as anticipated, please notify me with a description and possible screen shot of the issue.
The strategy is a basic crossover strategy. When MA1 crosses above MA2, it will trigger a long entry. When MA1 crosses below MA2, it will trigger a short entry.
When using the Take Profit function, the trailing stop will automatically activate at the defined TP3 level.
Also, when TP1 is hit a stop loss is set at 0.3% (this can be adjusted in settings) above/below the current entry. When TP2 is achieved, the stop will move up to the TP1 level.
If the trailing stop locks in LESS profit than the TP2 level, the stop will trigger at the TP2 level. This will continue until the trailing stop has moved to a level more advantageous than TP2.
There is a companion Alerts script for use with AutoView.
***AutoView syntax IS NOT provided***
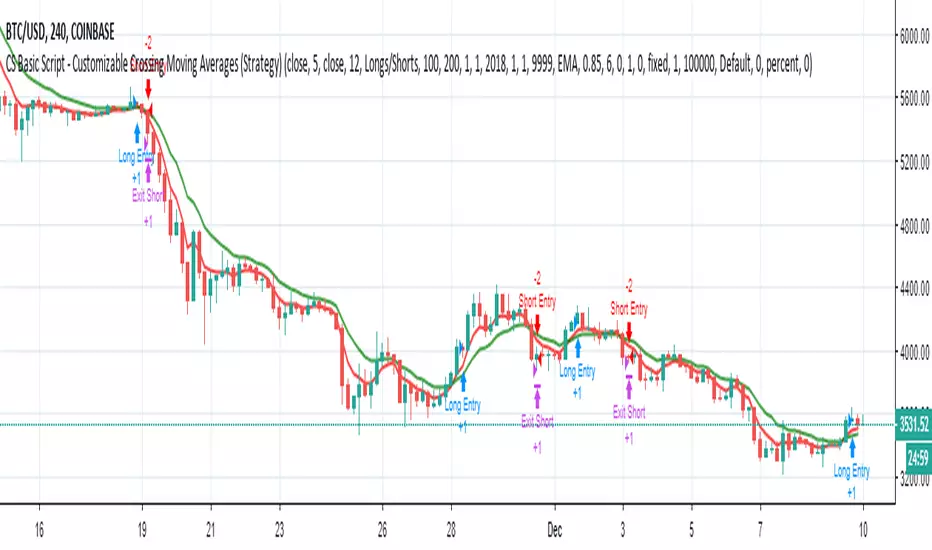
CS Basic Script - Customizable Crossing Moving AveragesThis Crossing MA Script features inputs for:
- Custom Date Range for Backtesting
- Optional Trailing Stop Loss
- Buy/Sell and Long/Short Selections
- Customizable MA Types and Ranges
- Includes EMA, SMA, WMA, ALMA, VMA, HMA, and LSMA Moving Average Types
- Ability to Enable Automated Trading with the Autoview Trading Bot Chrome Extension
For access to the Strategy Script for backtesting, simply favorite the script and add it to any TradingView chart.
For access to the Study Script for Custom Alerts and the Ability to Automize Trades through Autoview, please visit our website at www.cryptoscores.org .
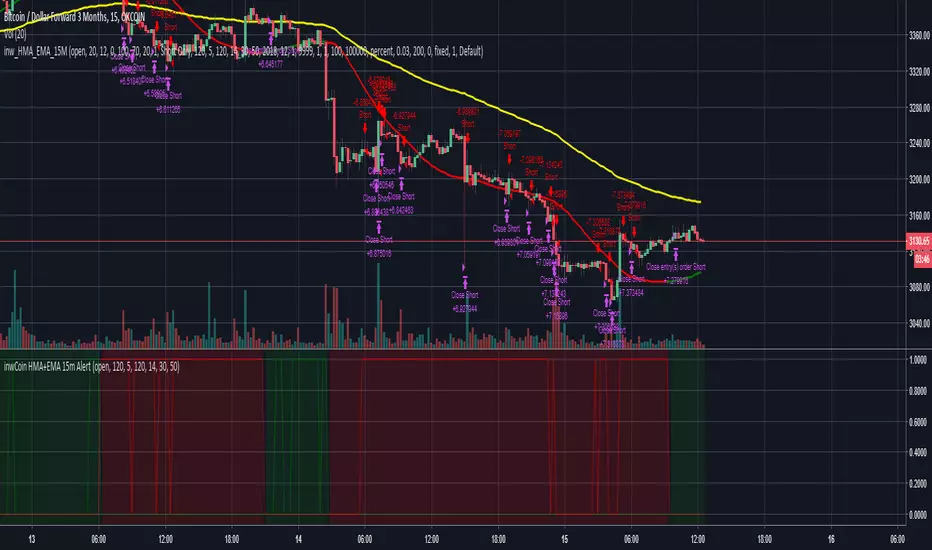
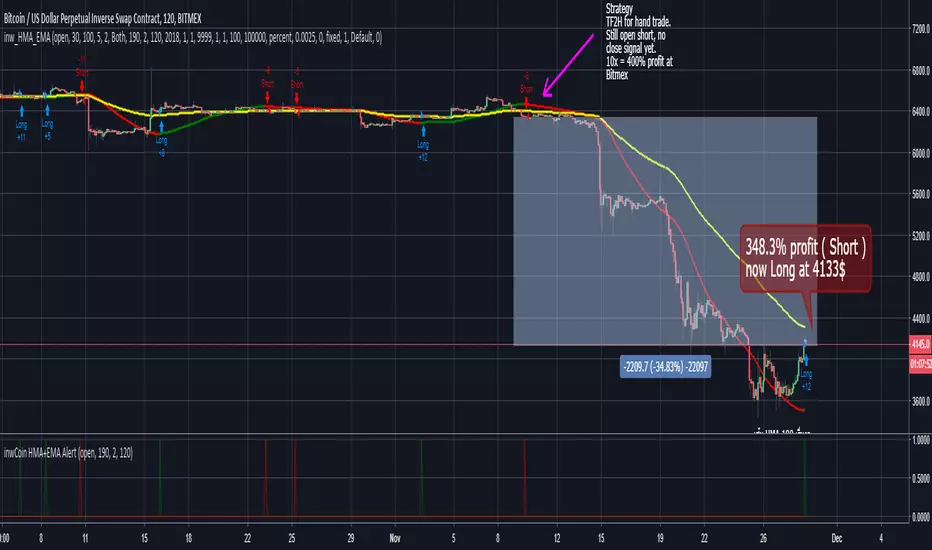
inwCoin HMA+EMA AlertJust simple HMA + EMA120 alert for same strategy
Work well with TF 2H
Tried BTC on OKex and Bitmex and it looking good.
Best for hand trade.
If you want to try, just comment, i'll grant you a permission for 2 days
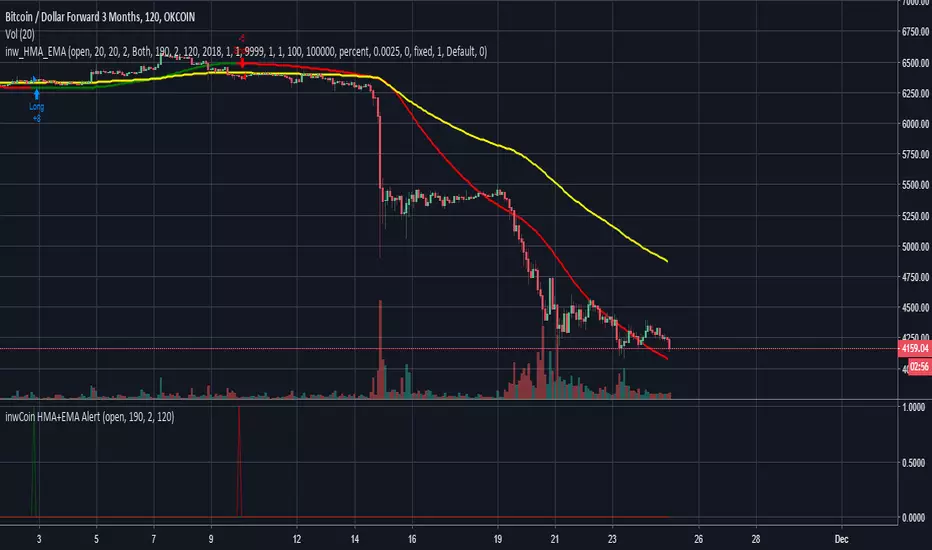
inwCoin HMA + EMA StrategyJust simple HMA + EMA120 strategy
Work well with TF 2H
Tried BTC on OKex and Bitmex and it looking good.
Best for hand trade.
If you want to try, just comment, i'll grant you a permission for 2 days
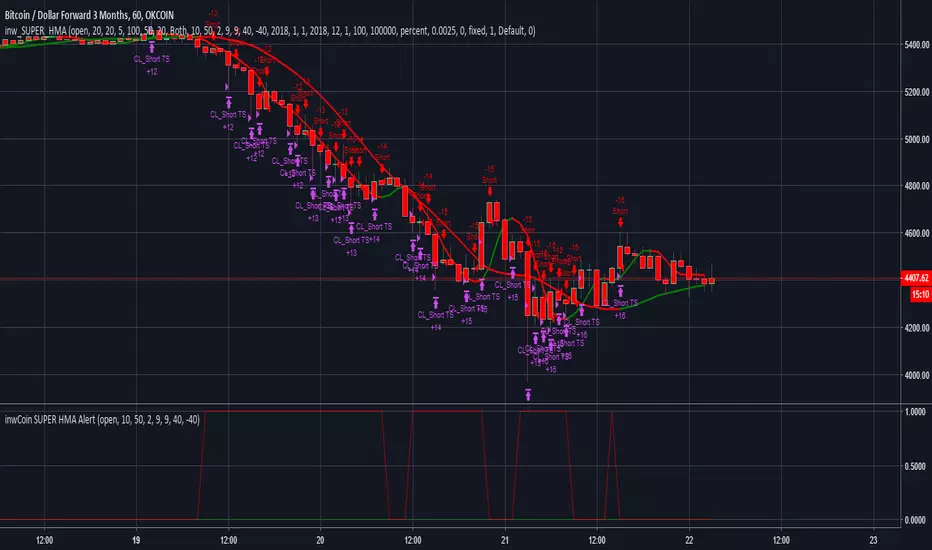
inwCoin SUPER HMA AlertinwCoin Super HMA alert for Super HMA strategy ( )
If you want sourcecode, I can give you for 0.01 BTC :) Send BTC to address below and IM me for acknowledgement.
BTC : 3BmqVW8eqE3qAGdtCdYGFYKbMwEALAhSEp
Check some backtest result here : imgur.com
Backtest result for various trade% : imgur.com
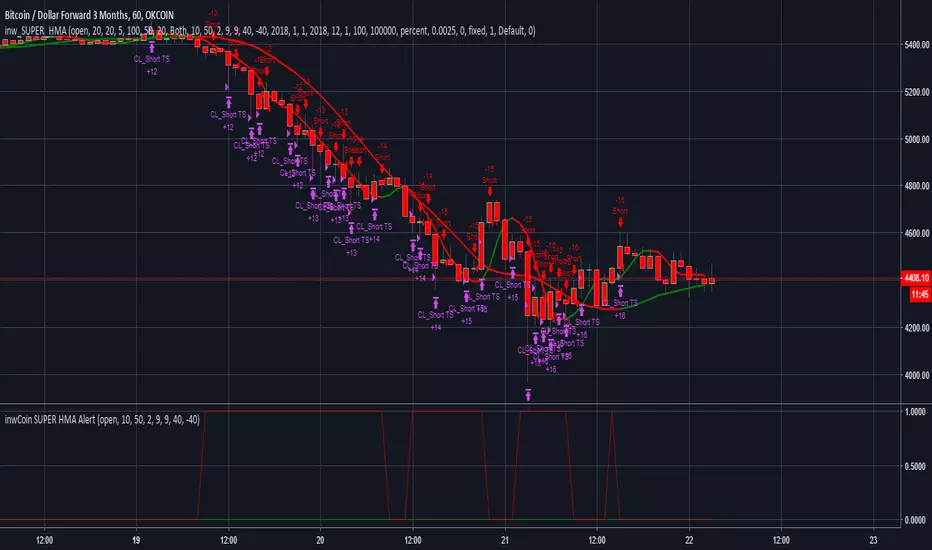
inwCoin SUPER HMA StrategyImproved version of inwCoin HMA Aggressive Strategy.
Filter out random trade from sideway period and wait for trend only.
Work very well on BTCUSD3M at OKEX with leverage 20x ( with the help of trailing start/stop bot, of course )
If you have OKex bot/ Or plan to write one. This strategy is the best bet.
If you want sourcecode, I can give you for 0.1 BTC :) Send BTC to address below and IM me for acknowledgement.
BTC : 3BmqVW8eqE3qAGdtCdYGFYKbMwEALAhSEp
Check some backtest result here : imgur.com
Backtest result for various trade% : imgur.com