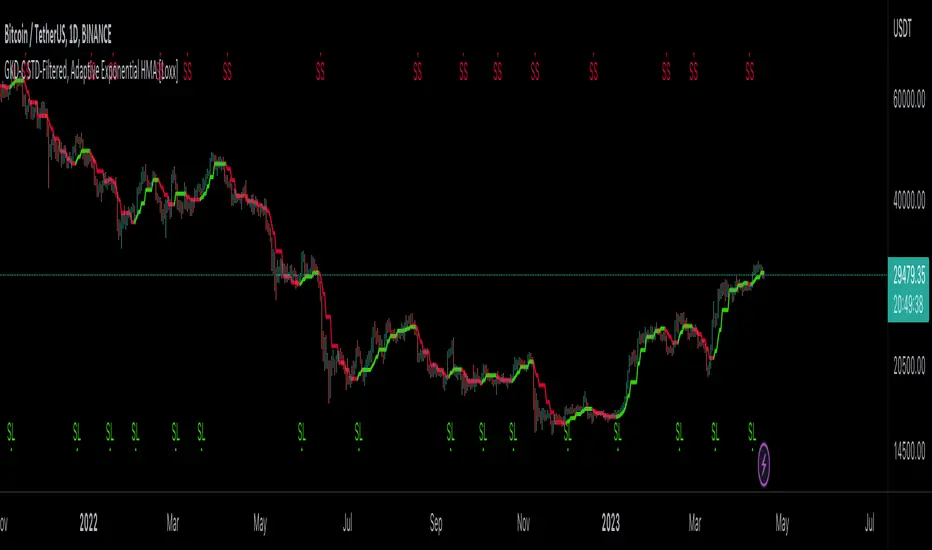
GKD-C STD-Filtered, Adaptive Exponential HMA [Loxx]Giga Kaleidoscope GKD-C STD-Filtered, Adaptive Exponential HMA is a Confirmation module included in Loxx's "Giga Kaleidoscope Modularized Trading System".
█ GKD-C STD-Filtered, Adaptive Exponential HMA
What is the STD-Filtered, Adaptive Exponential HMA?
The Adaptive Hull Moving Average (AHMA) is a powerful technical indicator that combines the advantages of both the Hull Moving Average (HMA) and adaptive filtering techniques. It is primarily used by traders and investors to identify trends in financial markets and generate buy/sell signals. This essay aims to provide a comprehensive understanding of the AHMA, its components, and its applications in trading and investing.
Components of Adaptive Hull Moving Average
Exponential Moving Average (EMA)
The EMA is a widely-used technical indicator that assigns more weight to recent data points, making it more responsive to new information. The EMA is calculated using a smoothing factor (alpha), which determines the degree of responsiveness.
Adaptive Alpha
The adaptive alpha is a crucial component of the AHMA, as it determines the optimal alpha value for the EMA calculations based on the market's signal-to-noise ratio (SNR). This adaptive approach ensures that the indicator responds appropriately to different market conditions, providing more accurate buy/sell signals.
Hull Moving Average (HMA)
The HMA is a popular technical indicator that combines the advantages of weighted moving averages and simple moving averages. The HMA is designed to be more responsive to price changes while reducing lag, making it a valuable tool for trend analysis.
Standard Deviation Filter
The standard deviation filter is an optional component of the AHMA that helps reduce noise in the input data series. By applying this filter, traders can further improve the accuracy of the AHMA, minimizing false signals.
How this is done
Important functions:
aEMA(float src, float alpha) =>
float ema = src
ema := na(ema ) ? src : nz(ema ) + alpha * (src - nz(ema ))
ema
adaptiveAlpha(float SNR, float periodL, float periodH)=>
float al = 2.0 / (periodL + 1.0)
float ah = 2.0 / (periodH + 1.0)
float out = (ah + SNR * (al - ah))
out
hullAdaptiveMovingAverage(float src, int persnr, int perfast, int perslow, int gain, float beta)=>
float signal = math.abs(src - nz(src ))
float noise = 0
for i = 0 to persnr - 1
noise += math.abs(nz(src ) - nz(src ))
float SNR = beta * signal / noise * math.sqrt(persnr)
float exp2SNR = math.exp(2.0 * SNR)
float tanhSNR = (exp2SNR - 1.0) / (exp2SNR + 1.0)
float w = math.pow(tanhSNR, gain)
float a1 = adaptiveAlpha(w, perfast * 0.5, perslow * 0.5)
float a2 = adaptiveAlpha(w, perfast, perslow)
float a3 = adaptiveAlpha(w, math.sqrt(perfast), math.sqrt(perslow))
float h1 = src
float h2 = src
float h3 = src
h1 := aEMA(h1, a1)
h2 := aEMA(h2, a2)
h3 := (2 * h1 - h2)
h3 := aEMA(h3, a3)
h3
stdFilter(float src, int len, float filter)=>
float price = src
float filtdev = filter * ta.stdev(src, len)
price := math.abs(price - nz(price )) < filtdev ? nz(price ) : price
price
1. aEMA(): This function calculates the exponential moving average (EMA) of a given data series (src) using the specified alpha value. It initializes the EMA with the data series and then calculates it recursively using the previous EMA and alpha value.
2. adaptiveAlpha(): This function calculates the adaptive alpha value based on the signal-to-noise ratio (SNR), the fast period (periodL), and the slow period (periodH). It computes the adaptive alpha by linearly interpolating between the fast and slow alpha values based on the SNR.
3. hullAdaptiveMovingAverage(): This function implements the AHMA by taking the input data series (src), the signal-to-noise ratio period (persnr), fast and slow periods (perfast, perslow), gain, and a beta value. It calculates the SNR by dividing the absolute difference between the current data point and its previous value (signal) by the sum of the absolute differences between consecutive data points (noise) over the specified SNR period. The function then computes the adaptive alpha values (a1, a2, a3) and calculates the Hull Moving Average (HMA) using three EMAs (h1, h2, h3).
4. stdFilter(): This function applies a standard deviation filter to the input data series (src) using the specified filter period (len) and filter coefficient (filter). It filters out the data points whose absolute difference from the previous data point is less than the specified multiple of the standard deviation.
The code computes the AHMA of the input data series (src) by applying the hullAdaptiveMovingAverage() function, and if the filter option is set to "Both" or "AEHMA" and the filter coefficient is greater than 0, the standard deviation filter is applied to the AHMA using the stdFilter() function. Finally, the output is stored in the variable "out," and the previous value of the output is stored in the variable "sig."
█ Giga Kaleidoscope Modularized Trading System
What is Loxx's "Giga Kaleidoscope Modularized Trading System"?
The Giga Kaleidoscope Modularized Trading System is a trading system built on the philosophy of the NNFX (No Nonsense Forex) algorithmic trading.
What is the NNFX algorithmic trading strategy?
The NNFX (No-Nonsense Forex) trading system is a comprehensive approach to Forex trading that is designed to simplify the process and remove the confusion and complexity that often surrounds trading. The system was developed by a Forex trader who goes by the pseudonym "VP" and has gained a significant following in the Forex community.
The NNFX trading system is based on a set of rules and guidelines that help traders make objective and informed decisions. These rules cover all aspects of trading, including market analysis, trade entry, stop loss placement, and trade management.
Here are the main components of the NNFX trading system:
1. Trading Philosophy: The NNFX trading system is based on the idea that successful trading requires a comprehensive understanding of the market, objective analysis, and strict risk management. The system aims to remove subjective elements from trading and focuses on objective rules and guidelines.
2. Technical Analysis: The NNFX trading system relies heavily on technical analysis and uses a range of indicators to identify high-probability trading opportunities. The system uses a combination of trend-following and mean-reverting strategies to identify trades.
3. Market Structure: The NNFX trading system emphasizes the importance of understanding the market structure, including price action, support and resistance levels, and market cycles. The system uses a range of tools to identify the market structure, including trend lines, channels, and moving averages.
4. Trade Entry: The NNFX trading system has strict rules for trade entry. The system uses a combination of technical indicators to identify high-probability trades, and traders must meet specific criteria to enter a trade.
5. Stop Loss Placement: The NNFX trading system places a significant emphasis on risk management and requires traders to place a stop loss order on every trade. The system uses a combination of technical analysis and market structure to determine the appropriate stop loss level.
6. Trade Management: The NNFX trading system has specific rules for managing open trades. The system aims to minimize risk and maximize profit by using a combination of trailing stops, take profit levels, and position sizing.
Overall, the NNFX trading system is designed to be a straightforward and easy-to-follow approach to Forex trading that can be applied by traders of all skill levels.
Core components of an NNFX algorithmic trading strategy
The NNFX algorithm is built on the principles of trend, momentum, and volatility. There are six core components in the NNFX trading algorithm:
1. Volatility - price volatility; e.g., Average True Range, True Range Double, Close-to-Close, etc.
2. Baseline - a moving average to identify price trend
3. Confirmation 1 - a technical indicator used to identify trends
4. Confirmation 2 - a technical indicator used to identify trends
5. Continuation - a technical indicator used to identify trends
6. Volatility/Volume - a technical indicator used to identify volatility/volume breakouts/breakdown
7. Exit - a technical indicator used to determine when a trend is exhausted
What is Volatility in the NNFX trading system?
In the NNFX (No Nonsense Forex) trading system, ATR (Average True Range) is typically used to measure the volatility of an asset. It is used as a part of the system to help determine the appropriate stop loss and take profit levels for a trade. ATR is calculated by taking the average of the true range values over a specified period.
True range is calculated as the maximum of the following values:
-Current high minus the current low
-Absolute value of the current high minus the previous close
-Absolute value of the current low minus the previous close
ATR is a dynamic indicator that changes with changes in volatility. As volatility increases, the value of ATR increases, and as volatility decreases, the value of ATR decreases. By using ATR in NNFX system, traders can adjust their stop loss and take profit levels according to the volatility of the asset being traded. This helps to ensure that the trade is given enough room to move, while also minimizing potential losses.
Other types of volatility include True Range Double (TRD), Close-to-Close, and Garman-Klass
What is a Baseline indicator?
The baseline is essentially a moving average, and is used to determine the overall direction of the market.
The baseline in the NNFX system is used to filter out trades that are not in line with the long-term trend of the market. The baseline is plotted on the chart along with other indicators, such as the Moving Average (MA), the Relative Strength Index (RSI), and the Average True Range (ATR).
Trades are only taken when the price is in the same direction as the baseline. For example, if the baseline is sloping upwards, only long trades are taken, and if the baseline is sloping downwards, only short trades are taken. This approach helps to ensure that trades are in line with the overall trend of the market, and reduces the risk of entering trades that are likely to fail.
By using a baseline in the NNFX system, traders can have a clear reference point for determining the overall trend of the market, and can make more informed trading decisions. The baseline helps to filter out noise and false signals, and ensures that trades are taken in the direction of the long-term trend.
What is a Confirmation indicator?
Confirmation indicators are technical indicators that are used to confirm the signals generated by primary indicators. Primary indicators are the core indicators used in the NNFX system, such as the Average True Range (ATR), the Moving Average (MA), and the Relative Strength Index (RSI).
The purpose of the confirmation indicators is to reduce false signals and improve the accuracy of the trading system. They are designed to confirm the signals generated by the primary indicators by providing additional information about the strength and direction of the trend.
Some examples of confirmation indicators that may be used in the NNFX system include the Bollinger Bands, the MACD (Moving Average Convergence Divergence), and the MACD Oscillator. These indicators can provide information about the volatility, momentum, and trend strength of the market, and can be used to confirm the signals generated by the primary indicators.
In the NNFX system, confirmation indicators are used in combination with primary indicators and other filters to create a trading system that is robust and reliable. By using multiple indicators to confirm trading signals, the system aims to reduce the risk of false signals and improve the overall profitability of the trades.
What is a Continuation indicator?
In the NNFX (No Nonsense Forex) trading system, a continuation indicator is a technical indicator that is used to confirm a current trend and predict that the trend is likely to continue in the same direction. A continuation indicator is typically used in conjunction with other indicators in the system, such as a baseline indicator, to provide a comprehensive trading strategy.
What is a Volatility/Volume indicator?
Volume indicators, such as the On Balance Volume (OBV), the Chaikin Money Flow (CMF), or the Volume Price Trend (VPT), are used to measure the amount of buying and selling activity in a market. They are based on the trading volume of the market, and can provide information about the strength of the trend. In the NNFX system, volume indicators are used to confirm trading signals generated by the Moving Average and the Relative Strength Index. Volatility indicators include Average Direction Index, Waddah Attar, and Volatility Ratio. In the NNFX trading system, volatility is a proxy for volume and vice versa.
By using volume indicators as confirmation tools, the NNFX trading system aims to reduce the risk of false signals and improve the overall profitability of trades. These indicators can provide additional information about the market that is not captured by the primary indicators, and can help traders to make more informed trading decisions. In addition, volume indicators can be used to identify potential changes in market trends and to confirm the strength of price movements.
What is an Exit indicator?
The exit indicator is used in conjunction with other indicators in the system, such as the Moving Average (MA), the Relative Strength Index (RSI), and the Average True Range (ATR), to provide a comprehensive trading strategy.
The exit indicator in the NNFX system can be any technical indicator that is deemed effective at identifying optimal exit points. Examples of exit indicators that are commonly used include the Parabolic SAR, the Average Directional Index (ADX), and the Chandelier Exit.
The purpose of the exit indicator is to identify when a trend is likely to reverse or when the market conditions have changed, signaling the need to exit a trade. By using an exit indicator, traders can manage their risk and prevent significant losses.
In the NNFX system, the exit indicator is used in conjunction with a stop loss and a take profit order to maximize profits and minimize losses. The stop loss order is used to limit the amount of loss that can be incurred if the trade goes against the trader, while the take profit order is used to lock in profits when the trade is moving in the trader's favor.
Overall, the use of an exit indicator in the NNFX trading system is an important component of a comprehensive trading strategy. It allows traders to manage their risk effectively and improve the profitability of their trades by exiting at the right time.
How does Loxx's GKD (Giga Kaleidoscope Modularized Trading System) implement the NNFX algorithm outlined above?
Loxx's GKD v1.0 system has five types of modules (indicators/strategies). These modules are:
1. GKD-BT - Backtesting module (Volatility, Number 1 in the NNFX algorithm)
2. GKD-B - Baseline module (Baseline and Volatility/Volume, Numbers 1 and 2 in the NNFX algorithm)
3. GKD-C - Confirmation 1/2 and Continuation module (Confirmation 1/2 and Continuation, Numbers 3, 4, and 5 in the NNFX algorithm)
4. GKD-V - Volatility/Volume module (Confirmation 1/2, Number 6 in the NNFX algorithm)
5. GKD-E - Exit module (Exit, Number 7 in the NNFX algorithm)
(additional module types will added in future releases)
Each module interacts with every module by passing data between modules. Data is passed between each module as described below:
GKD-B => GKD-V => GKD-C(1) => GKD-C(2) => GKD-C(Continuation) => GKD-E => GKD-BT
That is, the Baseline indicator passes its data to Volatility/Volume. The Volatility/Volume indicator passes its values to the Confirmation 1 indicator. The Confirmation 1 indicator passes its values to the Confirmation 2 indicator. The Confirmation 2 indicator passes its values to the Continuation indicator. The Continuation indicator passes its values to the Exit indicator, and finally, the Exit indicator passes its values to the Backtest strategy.
This chaining of indicators requires that each module conform to Loxx's GKD protocol, therefore allowing for the testing of every possible combination of technical indicators that make up the six components of the NNFX algorithm.
What does the application of the GKD trading system look like?
Example trading system:
Backtest: Strategy with 1-3 take profits, trailing stop loss, multiple types of PnL volatility, and 2 backtesting styles
Baseline: Hull Moving Average
Volatility/Volume: Hurst Exponent
Confirmation 1: STD-Filtered, Adaptive Exponential HMA as shown on the chart above
Confirmation 2: Williams Percent Range
Continuation: Fisher Transform
Exit: Rex Oscillator
Each GKD indicator is denoted with a module identifier of either: GKD-BT, GKD-B, GKD-C, GKD-V, or GKD-E. This allows traders to understand to which module each indicator belongs and where each indicator fits into the GKD protocol chain.
Giga Kaleidoscope Modularized Trading System Signals (based on the NNFX algorithm)
Standard Entry
1. GKD-C Confirmation 1 Signal
2. GKD-B Baseline agrees
3. Price is within a range of 0.2x Volatility and 1.0x Volatility of the Goldie Locks Mean
4. GKD-C Confirmation 2 agrees
5. GKD-V Volatility/Volume agrees
Baseline Entry
1. GKD-B Baseline signal
2. GKD-C Confirmation 1 agrees
3. Price is within a range of 0.2x Volatility and 1.0x Volatility of the Goldie Locks Mean
4. GKD-C Confirmation 2 agrees
5. GKD-V Volatility/Volume agrees
6. GKD-C Confirmation 1 signal was less than 7 candles prior
Volatility/Volume Entry
1. GKD-V Volatility/Volume signal
2. GKD-C Confirmation 1 agrees
3. Price is within a range of 0.2x Volatility and 1.0x Volatility of the Goldie Locks Mean
4. GKD-C Confirmation 2 agrees
5. GKD-B Baseline agrees
6. GKD-C Confirmation 1 signal was less than 7 candles prior
Continuation Entry
1. Standard Entry, Baseline Entry, or Pullback; entry triggered previously
2. GKD-B Baseline hasn't crossed since entry signal trigger
3. GKD-C Confirmation Continuation Indicator signals
4. GKD-C Confirmation 1 agrees
5. GKD-B Baseline agrees
6. GKD-C Confirmation 2 agrees
1-Candle Rule Standard Entry
1. GKD-C Confirmation 1 signal
2. GKD-B Baseline agrees
3. Price is within a range of 0.2x Volatility and 1.0x Volatility of the Goldie Locks Mean
Next Candle:
1. Price retraced (Long: close < close or Short: close > close )
2. GKD-B Baseline agrees
3. GKD-C Confirmation 1 agrees
4. GKD-C Confirmation 2 agrees
5. GKD-V Volatility/Volume agrees
1-Candle Rule Baseline Entry
1. GKD-B Baseline signal
2. GKD-C Confirmation 1 agrees
3. Price is within a range of 0.2x Volatility and 1.0x Volatility of the Goldie Locks Mean
4. GKD-C Confirmation 1 signal was less than 7 candles prior
Next Candle:
1. Price retraced (Long: close < close or Short: close > close )
2. GKD-B Baseline agrees
3. GKD-C Confirmation 1 agrees
4. GKD-C Confirmation 2 agrees
5. GKD-V Volatility/Volume Agrees
1-Candle Rule Volatility/Volume Entry
1. GKD-V Volatility/Volume signal
2. GKD-C Confirmation 1 agrees
3. Price is within a range of 0.2x Volatility and 1.0x Volatility of the Goldie Locks Mean
4. GKD-C Confirmation 1 signal was less than 7 candles prior
Next Candle:
1. Price retraced (Long: close < close or Short: close > close)
2. GKD-B Volatility/Volume agrees
3. GKD-C Confirmation 1 agrees
4. GKD-C Confirmation 2 agrees
5. GKD-B Baseline agrees
PullBack Entry
1. GKD-B Baseline signal
2. GKD-C Confirmation 1 agrees
3. Price is beyond 1.0x Volatility of Baseline
Next Candle:
1. Price is within a range of 0.2x Volatility and 1.0x Volatility of the Goldie Locks Mean
2. GKD-C Confirmation 1 agrees
3. GKD-C Confirmation 2 agrees
4. GKD-V Volatility/Volume Agrees
]█ Setting up the GKD
The GKD system involves chaining indicators together. These are the steps to set this up.
Use a GKD-C indicator alone on a chart
1. Inside the GKD-C indicator, change the "Confirmation Type" setting to "Solo Confirmation Simple"
Use a GKD-V indicator alone on a chart
**nothing, it's already useable on the chart without any settings changes
Use a GKD-B indicator alone on a chart
**nothing, it's already useable on the chart without any settings changes
Baseline (Baseline, Backtest)
1. Import the GKD-B Baseline into the GKD-BT Backtest: "Input into Volatility/Volume or Backtest (Baseline testing)"
2. Inside the GKD-BT Backtest, change the setting "Backtest Special" to "Baseline"
Volatility/Volume (Volatility/Volume, Backte st)
1. Inside the GKD-V indicator, change the "Testing Type" setting to "Solo"
2. Inside the GKD-V indicator, change the "Signal Type" setting to "Crossing" (neither traditional nor both can be backtested)
3. Import the GKD-V indicator into the GKD-BT Backtest: "Input into C1 or Backtest"
4. Inside the GKD-BT Backtest, change the setting "Backtest Special" to "Volatility/Volume"
5. Inside the GKD-BT Backtest, a) change the setting "Backtest Type" to "Trading" if using a directional GKD-V indicator; or, b) change the setting "Backtest Type" to "Full" if using a directional or non-directional GKD-V indicator (non-directional GKD-V can only test Longs and Shorts separately)
6. If "Backtest Type" is set to "Full": Inside the GKD-BT Backtest, change the setting "Backtest Side" to "Long" or "Short
7. If "Backtest Type" is set to "Full": To allow the system to open multiple orders at one time so you test all Longs or Shorts, open the GKD-BT Backtest, click the tab "Properties" and then insert a value of something like 10 orders into the "Pyramiding" settings. This will allow 10 orders to be opened at one time which should be enough to catch all possible Longs or Shorts.
Solo Confirmation Simple (Confirmation, Backtest)
1. Inside the GKD-C indicator, change the "Confirmation Type" setting to "Solo Confirmation Simple"
1. Import the GKD-C indicator into the GKD-BT Backtest: "Input into Backtest"
2. Inside the GKD-BT Backtest, change the setting "Backtest Special" to "Solo Confirmation Simple"
Solo Confirmation Complex without Exits (Baseline, Volatility/Volume, Confirmation, Backtest)
1. Inside the GKD-V indicator, change the "Testing Type" setting to "Chained"
2. Import the GKD-B Baseline into the GKD-V indicator: "Input into Volatility/Volume or Backtest (Baseline testing)"
3. Inside the GKD-C indicator, change the "Confirmation Type" setting to "Solo Confirmation Complex"
4. Import the GKD-V indicator into the GKD-C indicator: "Input into C1 or Backtest"
5. Inside the GKD-BT Backtest, change the setting "Backtest Special" to "GKD Full wo/ Exits"
6. Import the GKD-C into the GKD-BT Backtest: "Input into Exit or Backtest"
Solo Confirmation Complex with Exits (Baseline, Volatility/Volume, Confirmation, Exit, Backtest)
1. Inside the GKD-V indicator, change the "Testing Type" setting to "Chained"
2. Import the GKD-B Baseline into the GKD-V indicator: "Input into Volatility/Volume or Backtest (Baseline testing)"
3. Inside the GKD-C indicator, change the "Confirmation Type" setting to "Solo Confirmation Complex"
4. Import the GKD-V indicator into the GKD-C indicator: "Input into C1 or Backtest"
5. Import the GKD-C indicator into the GKD-E indicator: "Input into Exit"
6. Inside the GKD-BT Backtest, change the setting "Backtest Special" to "GKD Full w/ Exits"
7. Import the GKD-E into the GKD-BT Backtest: "Input into Backtest"
Full GKD without Exits (Baseline, Volatility/Volume, Confirmation 1, Confirmation 2, Continuation, Backtest)
1. Inside the GKD-V indicator, change the "Testing Type" setting to "Chained"
2. Import the GKD-B Baseline into the GKD-V indicator: "Input into Volatility/Volume or Backtest (Baseline testing)"
3. Inside the GKD-C 1 indicator, change the "Confirmation Type" setting to "Confirmation 1"
4. Import the GKD-V indicator into the GKD-C 1 indicator: "Input into C1 or Backtest"
5. Inside the GKD-C 2 indicator, change the "Confirmation Type" setting to "Confirmation 2"
6. Import the GKD-C 1 indicator into the GKD-C 2 indicator: "Input into C2"
7. Inside the GKD-C Continuation indicator, change the "Confirmation Type" setting to "Continuation"
8. Inside the GKD-BT Backtest, change the setting "Backtest Special" to "GKD Full wo/ Exits"
9. Import the GKD-E into the GKD-BT Backtest: "Input into Exit or Backtest"
Full GKD with Exits (Baseline, Volatility/Volume, Confirmation 1, Confirmation 2, Continuation, Exit, Backtest)
1. Inside the GKD-V indicator, change the "Testing Type" setting to "Chained"
2. Import the GKD-B Baseline into the GKD-V indicator: "Input into Volatility/Volume or Backtest (Baseline testing)"
3. Inside the GKD-C 1 indicator, change the "Confirmation Type" setting to "Confirmation 1"
4. Import the GKD-V indicator into the GKD-C 1 indicator: "Input into C1 or Backtest"
5. Inside the GKD-C 2 indicator, change the "Confirmation Type" setting to "Confirmation 2"
6. Import the GKD-C 1 indicator into the GKD-C 2 indicator: "Input into C2"
7. Inside the GKD-C Continuation indicator, change the "Confirmation Type" setting to "Continuation"
8. Import the GKD-C Continuation indicator into the GKD-E indicator: "Input into Exit"
9. Inside the GKD-BT Backtest, change the setting "Backtest Special" to "GKD Full w/ Exits"
10. Import the GKD-E into the GKD-BT Backtest: "Input into Backtest"
Baseline + Volatility/Volume (Baseline, Volatility/Volume, Backtest)
1. Inside the GKD-V indicator, change the "Testing Type" setting to "Baseline + Volatility/Volume"
2. Inside the GKD-V indicator, make sure the "Signal Type" setting is set to "Traditional"
3. Import the GKD-B Baseline into the GKD-V indicator: "Input into Volatility/Volume or Backtest (Baseline testing)"
4. Inside the GKD-BT Backtest, change the setting "Backtest Special" to "Baseline + Volatility/Volume"
5. Import the GKD-V into the GKD-BT Backtest: "Input into C1 or Backtest"
6. Inside the GKD-BT Backtest, change the setting "Backtest Type" to "Full". For this backtest, you must test Longs and Shorts separately
7. To allow the system to open multiple orders at one time so you can test all Longs or Shorts, open the GKD-BT Backtest, click the tab "Properties" and then insert a value of something like 10 orders into the "Pyramiding" settings. This will allow 10 orders to be opened at one time which should be enough to catch all possible Longs or Shorts.
Requirements
Inputs
Confirmation 1: GKD-V Volatility / Volume indicator
Confirmation 2: GKD-C Confirmation indicator
Continuation: GKD-C Confirmation indicator
Solo Confirmation Simple: GKD-B Baseline
Solo Confirmation Complex: GKD-V Volatility / Volume indicator
Solo Confirmation Super Complex: GKD-V Volatility / Volume indicator
Stacked 1: None
Stacked 2+: GKD-C, GKD-V, or GKD-B Stacked 1
Outputs
Confirmation 1: GKD-C Confirmation 2 indicator
Confirmation 2: GKD-C Continuation indicator
Continuation: GKD-E Exit indicator
Solo Confirmation Simple: GKD-BT Backtest
Solo Confirmation Complex: GKD-BT Backtest or GKD-E Exit indicator
Solo Confirmation Super Complex: GKD-C Continuation indicator
Stacked 1: GKD-C, GKD-V, or GKD-B Stacked 2+
Stacked 2+: GKD-C, GKD-V, or GKD-B Stacked 2+ or GKD-BT Backtest
Additional features will be added in future releases.
Hull Moving Average (HMA)
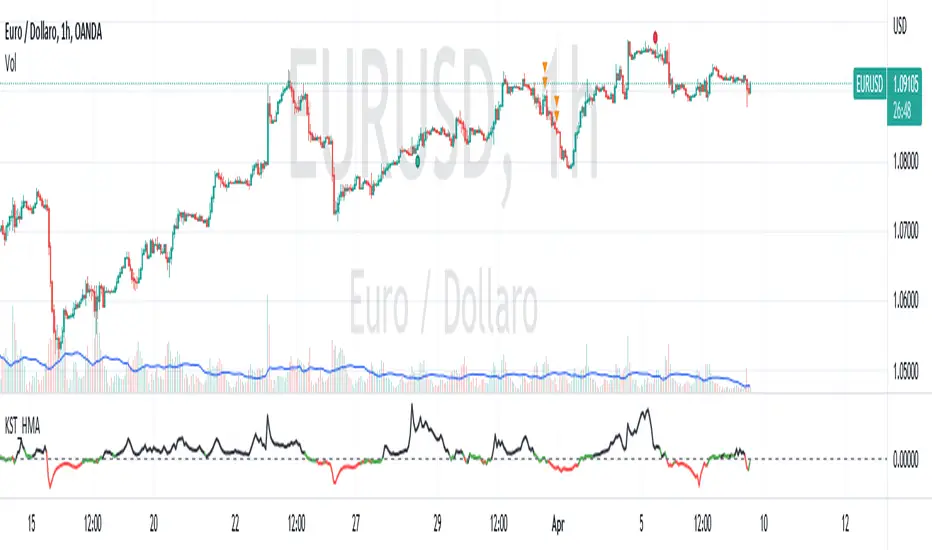
KST con HMA---------- ENGLISH DESCRIPTION ----------
The indicator created is called "KST with HMA" and is used to measure the impulse of an asset's price.
The code begins by defining four variables representing ROC (Rate of Change) period lengths for calculating the KST (Know Sure Thing) and a variable for the length of the HMA (Hull Moving Average).
Next, an HMA function is defined to calculate the Hull Moving Average, a type of weighted moving average that adjusts for price volatility.
ROC values are then calculated for the four periods defined above and KST values are calculated as a weighted sum of the ROC values. These values are then normalized with the HMA and the standard deviation of the HMA is calculated. The normalized value is finally plotted with three different color lines: black for values greater than 1, red for values less than -1, and green for values between -1 and 1.
Finally, a black dashed line is plotted to represent the zero line. The green line indicates a phase of market uncertainty or lateralization, while the indicator can be used to identify buy points above zero and sell points below zero.
---------- ITALIAN DESCRIPTION ----------
L'indicatore creato è chiamato "KST con HMA" e viene utilizzato per misurare l'impulso del prezzo di un asset.
Il codice inizia definendo quattro variabili che rappresentano le lunghezze dei periodi di ROC (Rate of Change) per il calcolo del KST (Know Sure Thing) e una variabile per la lunghezza dell'HMA (Hull Moving Average).
Successivamente viene definita una funzione HMA per il calcolo della Hull Moving Average, un tipo di media mobile ponderata che si adatta alla volatilità del prezzo.
Vengono poi calcolati i valori ROC per i quattro periodi definiti in precedenza e calcolati i valori KST come somma ponderata dei valori ROC. Questi valori vengono poi normalizzati con l'HMA e viene calcolata la deviazione standard dell'HMA. Il valore normalizzato viene infine plottato con tre diverse linee di colore: nero per valori superiori a 1, rosso per valori inferiori a -1 e verde per valori tra -1 e 1.
Infine, viene plottata una linea tratteggiata nera per rappresentare la linea zero. La linea verde indica una fase di incertezza o lateralizzazione del mercato, mentre l'indicatore può essere utilizzato per individuare punti di acquisto sopra lo zero e di vendita al di sotto dello zero.
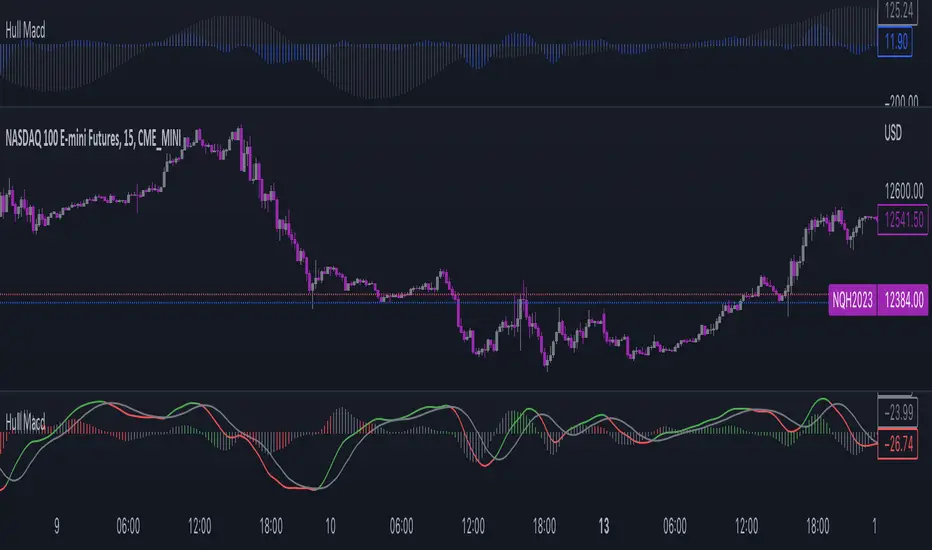
Hull PressureThis amazing oscillator displays the difference between the hull average calculated on the close of the candles and the one calculated between the average of the highs and lows.
This allows the user to identify the pressure of the closing price over the average, useful to identify trends, divergences, and reversals.
This indicator also has two dynamic overbought and oversold areas, calculated over the past extreme highs and lows of the oscillator.

GKD-C Multi HMA Slopes [Loxx]Giga Kaleidoscope GKD-C Multi HMA Slopes is a Confirmation module included in Loxx's "Giga Kaleidoscope Modularized Trading System".
█ Giga Kaleidoscope Modularized Trading System
What is Loxx's "Giga Kaleidoscope Modularized Trading System"?
The Giga Kaleidoscope Modularized Trading System is a trading system built on the philosophy of the NNFX (No Nonsense Forex) algorithmic trading.
What is the NNFX algorithmic trading strategy?
The NNFX (No-Nonsense Forex) trading system is a comprehensive approach to Forex trading that is designed to simplify the process and remove the confusion and complexity that often surrounds trading. The system was developed by a Forex trader who goes by the pseudonym "VP" and has gained a significant following in the Forex community.
The NNFX trading system is based on a set of rules and guidelines that help traders make objective and informed decisions. These rules cover all aspects of trading, including market analysis, trade entry, stop loss placement, and trade management.
Here are the main components of the NNFX trading system:
1. Trading Philosophy: The NNFX trading system is based on the idea that successful trading requires a comprehensive understanding of the market, objective analysis, and strict risk management. The system aims to remove subjective elements from trading and focuses on objective rules and guidelines.
2. Technical Analysis: The NNFX trading system relies heavily on technical analysis and uses a range of indicators to identify high-probability trading opportunities. The system uses a combination of trend-following and mean-reverting strategies to identify trades.
3. Market Structure: The NNFX trading system emphasizes the importance of understanding the market structure, including price action, support and resistance levels, and market cycles. The system uses a range of tools to identify the market structure, including trend lines, channels, and moving averages.
4. Trade Entry: The NNFX trading system has strict rules for trade entry. The system uses a combination of technical indicators to identify high-probability trades, and traders must meet specific criteria to enter a trade.
5. Stop Loss Placement: The NNFX trading system places a significant emphasis on risk management and requires traders to place a stop loss order on every trade. The system uses a combination of technical analysis and market structure to determine the appropriate stop loss level.
6. Trade Management: The NNFX trading system has specific rules for managing open trades. The system aims to minimize risk and maximize profit by using a combination of trailing stops, take profit levels, and position sizing.
Overall, the NNFX trading system is designed to be a straightforward and easy-to-follow approach to Forex trading that can be applied by traders of all skill levels.
Core components of an NNFX algorithmic trading strategy
The NNFX algorithm is built on the principles of trend, momentum, and volatility. There are six core components in the NNFX trading algorithm:
1. Volatility - price volatility; e.g., Average True Range, True Range Double, Close-to-Close, etc.
2. Baseline - a moving average to identify price trend
3. Confirmation 1 - a technical indicator used to identify trends
4. Confirmation 2 - a technical indicator used to identify trends
5. Continuation - a technical indicator used to identify trends
6. Volatility/Volume - a technical indicator used to identify volatility/volume breakouts/breakdown
7. Exit - a technical indicator used to determine when a trend is exhausted
What is Volatility in the NNFX trading system?
In the NNFX (No Nonsense Forex) trading system, ATR (Average True Range) is typically used to measure the volatility of an asset. It is used as a part of the system to help determine the appropriate stop loss and take profit levels for a trade. ATR is calculated by taking the average of the true range values over a specified period.
True range is calculated as the maximum of the following values:
-Current high minus the current low
-Absolute value of the current high minus the previous close
-Absolute value of the current low minus the previous close
ATR is a dynamic indicator that changes with changes in volatility. As volatility increases, the value of ATR increases, and as volatility decreases, the value of ATR decreases. By using ATR in NNFX system, traders can adjust their stop loss and take profit levels according to the volatility of the asset being traded. This helps to ensure that the trade is given enough room to move, while also minimizing potential losses.
Other types of volatility include True Range Double (TRD), Close-to-Close, and Garman-Klass
What is a Baseline indicator?
The baseline is essentially a moving average, and is used to determine the overall direction of the market.
The baseline in the NNFX system is used to filter out trades that are not in line with the long-term trend of the market. The baseline is plotted on the chart along with other indicators, such as the Moving Average (MA), the Relative Strength Index (RSI), and the Average True Range (ATR).
Trades are only taken when the price is in the same direction as the baseline. For example, if the baseline is sloping upwards, only long trades are taken, and if the baseline is sloping downwards, only short trades are taken. This approach helps to ensure that trades are in line with the overall trend of the market, and reduces the risk of entering trades that are likely to fail.
By using a baseline in the NNFX system, traders can have a clear reference point for determining the overall trend of the market, and can make more informed trading decisions. The baseline helps to filter out noise and false signals, and ensures that trades are taken in the direction of the long-term trend.
What is a Confirmation indicator?
Confirmation indicators are technical indicators that are used to confirm the signals generated by primary indicators. Primary indicators are the core indicators used in the NNFX system, such as the Average True Range (ATR), the Moving Average (MA), and the Relative Strength Index (RSI).
The purpose of the confirmation indicators is to reduce false signals and improve the accuracy of the trading system. They are designed to confirm the signals generated by the primary indicators by providing additional information about the strength and direction of the trend.
Some examples of confirmation indicators that may be used in the NNFX system include the Bollinger Bands, the MACD (Moving Average Convergence Divergence), and the Stochastic Oscillator. These indicators can provide information about the volatility, momentum, and trend strength of the market, and can be used to confirm the signals generated by the primary indicators.
In the NNFX system, confirmation indicators are used in combination with primary indicators and other filters to create a trading system that is robust and reliable. By using multiple indicators to confirm trading signals, the system aims to reduce the risk of false signals and improve the overall profitability of the trades.
What is a Continuation indicator?
In the NNFX (No Nonsense Forex) trading system, a continuation indicator is a technical indicator that is used to confirm a current trend and predict that the trend is likely to continue in the same direction. A continuation indicator is typically used in conjunction with other indicators in the system, such as a baseline indicator, to provide a comprehensive trading strategy.
What is a Volatility/Volume indicator?
Volume indicators, such as the On Balance Volume (OBV), the Chaikin Money Flow (CMF), or the Volume Price Trend (VPT), are used to measure the amount of buying and selling activity in a market. They are based on the trading volume of the market, and can provide information about the strength of the trend. In the NNFX system, volume indicators are used to confirm trading signals generated by the Moving Average and the Relative Strength Index. Volatility indicators include Average Direction Index, Waddah Attar, and Volatility Ratio. In the NNFX trading system, volatility is a proxy for volume and vice versa.
By using volume indicators as confirmation tools, the NNFX trading system aims to reduce the risk of false signals and improve the overall profitability of trades. These indicators can provide additional information about the market that is not captured by the primary indicators, and can help traders to make more informed trading decisions. In addition, volume indicators can be used to identify potential changes in market trends and to confirm the strength of price movements.
What is an Exit indicator?
The exit indicator is used in conjunction with other indicators in the system, such as the Moving Average (MA), the Relative Strength Index (RSI), and the Average True Range (ATR), to provide a comprehensive trading strategy.
The exit indicator in the NNFX system can be any technical indicator that is deemed effective at identifying optimal exit points. Examples of exit indicators that are commonly used include the Parabolic SAR, the Average Directional Index (ADX), and the Chandelier Exit.
The purpose of the exit indicator is to identify when a trend is likely to reverse or when the market conditions have changed, signaling the need to exit a trade. By using an exit indicator, traders can manage their risk and prevent significant losses.
In the NNFX system, the exit indicator is used in conjunction with a stop loss and a take profit order to maximize profits and minimize losses. The stop loss order is used to limit the amount of loss that can be incurred if the trade goes against the trader, while the take profit order is used to lock in profits when the trade is moving in the trader's favor.
Overall, the use of an exit indicator in the NNFX trading system is an important component of a comprehensive trading strategy. It allows traders to manage their risk effectively and improve the profitability of their trades by exiting at the right time.
How does Loxx's GKD (Giga Kaleidoscope Modularized Trading System) implement the NNFX algorithm outlined above?
Loxx's GKD v1.0 system has five types of modules (indicators/strategies). These modules are:
1. GKD-BT - Backtesting module (Volatility, Number 1 in the NNFX algorithm)
2. GKD-B - Baseline module (Baseline and Volatility/Volume, Numbers 1 and 2 in the NNFX algorithm)
3. GKD-C - Confirmation 1/2 and Continuation module (Confirmation 1/2 and Continuation, Numbers 3, 4, and 5 in the NNFX algorithm)
4. GKD-V - Volatility/Volume module (Confirmation 1/2, Number 6 in the NNFX algorithm)
5. GKD-E - Exit module (Exit, Number 7 in the NNFX algorithm)
(additional module types will added in future releases)
Each module interacts with every module by passing data between modules. Data is passed between each module as described below:
GKD-B => GKD-V => GKD-C(1) => GKD-C(2) => GKD-C(Continuation) => GKD-E => GKD-BT
That is, the Baseline indicator passes its data to Volatility/Volume. The Volatility/Volume indicator passes its values to the Confirmation 1 indicator. The Confirmation 1 indicator passes its values to the Confirmation 2 indicator. The Confirmation 2 indicator passes its values to the Continuation indicator. The Continuation indicator passes its values to the Exit indicator, and finally, the Exit indicator passes its values to the Backtest strategy.
This chaining of indicators requires that each module conform to Loxx's GKD protocol, therefore allowing for the testing of every possible combination of technical indicators that make up the six components of the NNFX algorithm.
What does the application of the GKD trading system look like?
Example trading system:
Backtest: Strategy with 1-3 take profits, trailing stop loss, multiple types of PnL volatility, and 2 backtesting styles
Baseline: Hull Moving Average
Volatility/Volume: Hurst Exponent
Confirmation 1: Multi HMA Slopes as shown on the chart above
Confirmation 2: Williams Percent Range
Continuation: Fisher Transform
Exit: Rex Oscillator
Each GKD indicator is denoted with a module identifier of either: GKD-BT, GKD-B, GKD-C, GKD-V, or GKD-E. This allows traders to understand to which module each indicator belongs and where each indicator fits into the GKD protocol chain.
Giga Kaleidoscope Modularized Trading System Signals (based on the NNFX algorithm)
Standard Entry
1. GKD-C Confirmation 1 Signal
2. GKD-B Baseline agrees
3. Price is within a range of 0.2x Volatility and 1.0x Volatility of the Goldie Locks Mean
4. GKD-C Confirmation 2 agrees
5. GKD-V Volatility/Volume agrees
Baseline Entry
1. GKD-B Baseline signal
2. GKD-C Confirmation 1 agrees
3. Price is within a range of 0.2x Volatility and 1.0x Volatility of the Goldie Locks Mean
4. GKD-C Confirmation 2 agrees
5. GKD-V Volatility/Volume agrees
6. GKD-C Confirmation 1 signal was less than 7 candles prior
Continuation Entry
1. Standard Entry, Baseline Entry, or Pullback; entry triggered previously
2. GKD-B Baseline hasn't crossed since entry signal trigger
3. GKD-C Confirmation Continuation Indicator signals
4. GKD-C Confirmation 1 agrees
5. GKD-B Baseline agrees
6. GKD-C Confirmation 2 agrees
1-Candle Rule Standard Entry
1. GKD-C Confirmation 1 signal
2. GKD-B Baseline agrees
3. Price is within a range of 0.2x Volatility and 1.0x Volatility of the Goldie Locks Mean
Next Candle:
1. Price retraced (Long: close < close or Short: close > close )
2. GKD-B Baseline agrees
3. GKD-C Confirmation 1 agrees
4. GKD-C Confirmation 2 agrees
5. GKD-V Volatility/Volume agrees
1-Candle Rule Baseline Entry
1. GKD-B Baseline signal
2. GKD-C Confirmation 1 agrees
3. Price is within a range of 0.2x Volatility and 1.0x Volatility of the Goldie Locks Mean
4. GKD-C Confirmation 1 signal was less than 7 candles prior
Next Candle:
1. Price retraced (Long: close < close or Short: close > close )
2. GKD-B Baseline agrees
3. GKD-C Confirmation 1 agrees
4. GKD-C Confirmation 2 agrees
5. GKD-V Volatility/Volume Agrees
PullBack Entry
1. GKD-B Baseline signal
2. GKD-C Confirmation 1 agrees
3. Price is beyond 1.0x Volatility of Baseline
Next Candle:
1. Price is within a range of 0.2x Volatility and 1.0x Volatility of the Goldie Locks Mean
3. GKD-C Confirmation 1 agrees
4. GKD-C Confirmation 2 agrees
5. GKD-V Volatility/Volume Agrees
█ GKD-C Multi HMA Slopes
What is Multi HMA Slopes?
Multi HMA Slopes is an indicator that checks slopes of 5 (different period) Hull Moving Averages and adds them up to show overall trend. To us this, check for color changes from red to green where there is no red if green is larger than red and there is no red when red is larger than green. When red and green both show up, its a sign of chop.
Requirements
Inputs
Confirmation 1 and Solo Confirmation: GKD-V Volatility / Volume indicator
Confirmation 2: GKD-C Confirmation indicator
Outputs
Confirmation 2 and Solo Confirmation Complex: GKD-E Exit indicator
Confirmation 1: GKD-C Confirmation indicator
Continuation: GKD-E Exit indicator
Solo Confirmation Simple: GKD-BT Backtest strategy
Additional features will be added in future releases.

Hull OscillatorThis oscillator comprehends two different indicators:
- The first one is a MACD but calculated using the Hull Moving Average.
- The second one is to show the direction in which the Hull Moving Average is going.
Notice that in the first indicator, the histogram is colored as follows:
- If the volume pressure (difference between the volume-weighted moving average and the normal one) is positive both for the short term and the long term, it's green, if negative it's red, and if not is simply gray.
This tool can be used both for:
- Analyze the direction to have a bias to follow
- Analyze the divergences
- Obtain the signal to enter and exit the trade
- Analyze the market strength with volume to confirm the signal
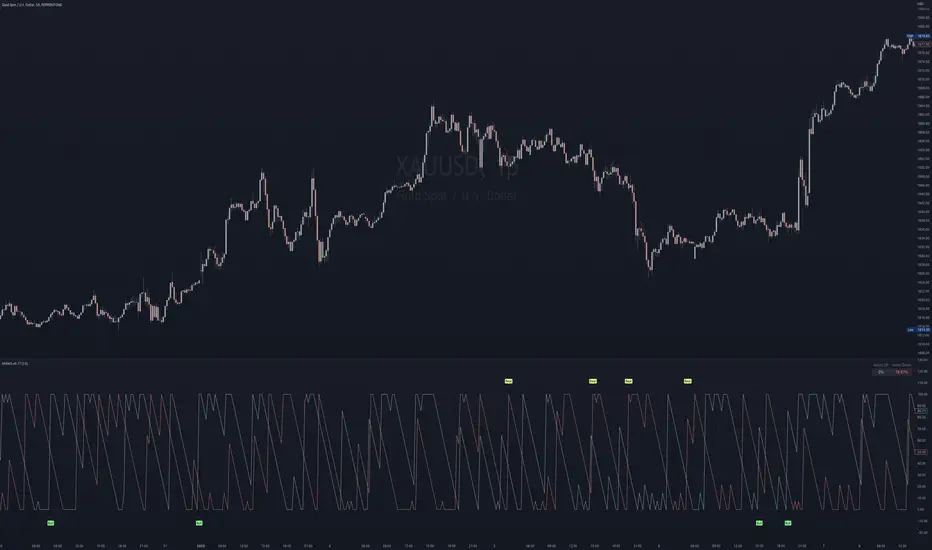
Arron Meter With Alerts [Skiploss]Arron Meter With Alerts is an indicator to identify the trend, and a meter shows the percentage of AroonUP and AroonDown.
Alert Settings
It will be part of a display of bullish and bearish signals by using the condition of the upper line cross lower line and HMA 200 cross under/over EMA 12, and also upper/lower line must be higher than 70%
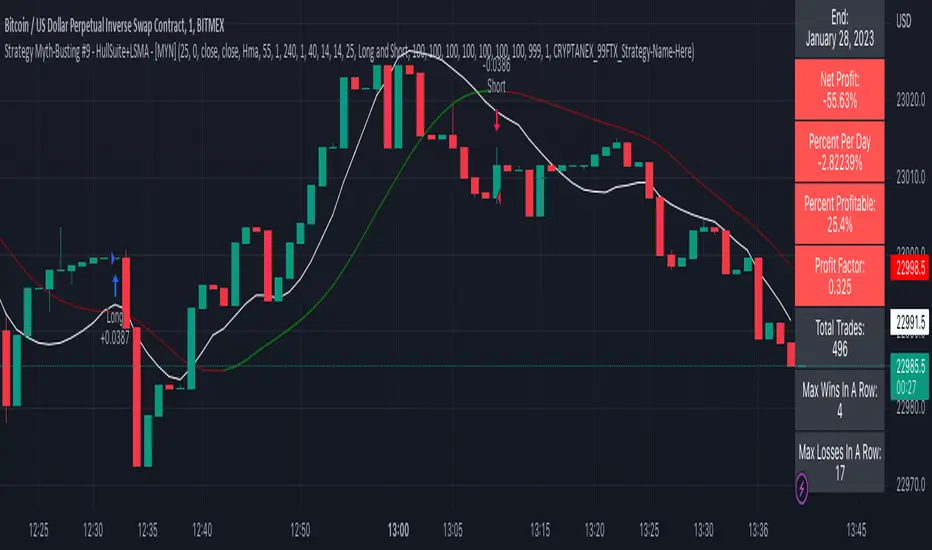
Strategy Myth-Busting #9 - HullSuite+LSMA - [MYN]This is part of a new series we are calling "Strategy Myth-Busting" where we take open public manual trading strategies and automate them. The goal is to not only validate the authenticity of the claims but to provide an automated version for traders who wish to trade autonomously.
Our 9th one is an automated version of the "I Tested The Best 1 Minute Scalping Strategy That Will Blow Your Mind 100 Times" strategy from "Profit Now" who claims to have achieved 36.7% profit scalping XRPUSDT on the 1 minute timeframe in only 15 days. As you can see from the backtest results below, I was unable to substantiate anything remotely close to that that claim on any timeframe or symbol. Myth 10000% busted.
This strategy uses a combination of 2 open-source public indicators: Hull Suite by InSilico and Least Squares Moving Average (LSMA)
The Hull Moving Average (HMA) is a faster version of the traditional moving average and is designed to reduce lag and improve the responsiveness of the average to price changes. In this strategy the HMA is used as a trend-following indicator, When the HMA is rising it is indicative of an upwards trend and when its falling its indicative of a downtrend.
The Least Squares Moving Average (LSMA) used in this strategy is similar to the HMA in that it is designed to reduce lag and improve the responsiveness of the average to price changes. In this strategy the LSMA is used to also not only identify trends but also confirm signals, it also is used to identify possible changes in the trend and market conditions.
When we use these together, the Hull Suite and LSMA indicators provide a complimentary confirmation of trend direction and trend swings. The Hull Suite helps to identify and confirm trends, while the LSMA aids to confirm signals and identify potential changes in market conditions.
The way this strategy is designed is when the Hull Suite HMA is trending up and the LSMA crosses above the HMA, we enter a long condition. When the Hull Suite is trending down and the LSMA crosses below the HMA we take a short position. Because of the low latency of these two indicators this strategy can be used on lower time frames down to 1 minute. On high volatility crypto on the lowest time frames, a 1:4 Risk Ratio should be used. A lower less risk ratio should be used on less volatile archetypes of securities.
If you know of or have a strategy you want to see myth-busted or just have an idea for one, please feel free to message me
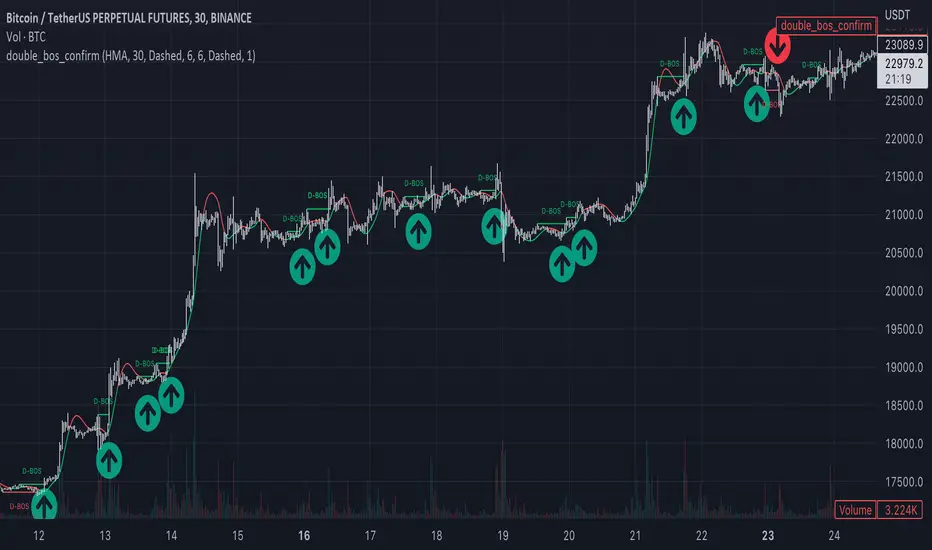
Market Structure Double BOS Confirm
🔥 Overview
🎯 This Double BOS(Break Of Structure) Confirm indicator combined ma-based BOS and classic BOS
to achieve a more credible BOS signal . it works well in most symbols with 2 parameters finetune.
🎯 It's a enhanced version compare with previous script.
🎯 at the same time, I keep D-BOS and BOS separately, you can use them in combination freely.
🔥 Indicator design logic
🎯 there are 3 parts in this indicator.
Part 1: MA-Based BOS
1. use close-in EMA's highest/lowest value mark as SWING High/Low when EMA crossover/under,
not use func ta.pivothigh()/ta.pivotlow()
2. once price reaching EMA’s SWING High/Low, draw a line link High/Low to current bar, labled as BOS
3. more MA-Based BOS details can get from my previous script.
Part 2: Classic BOS
1. use pivothigh/low function to find pivot (decided by left/right swing length)
2. when get new pivothigh, compare with previous high, calculate HH/LH/HL/LL result
3. once bar closed and break pivothigh then labed as BOS
Part 3: Double BOS Confirms
1. when MA-Based BOS and Classic BOS occured at the same bar closed signed as D-BOS
2. when two BOS events one bar apart, signed as D-BOS
🔥 Settings
🎯 there are 13 input properties in script, 4 properties(Bold field) have an impact on the results and the other 9 show display effects.
GRP1
MA_Type : MA type you can choose(EMA/RMA/SMA/HMA/WMA/VWMA), default is HMA
short_ma_len : MA length of your current timeframe on chart, default 30
show_ma_bos_line: whether show ma-based BOS line, default false
GRP2
left_swing_len : pivothigh(source, left,right), it‘s left swing length
right_swing_len : right swing length
show_pivot_bos_line: whether show pivot-based BOS line, default false
GRP3
show_double_bos_line: show double_bos_line, default true
double_bos_linewidth: linewidth, default 2 (Bold line)
double_bos_linestyle: default Dashed
🔥 Usage
🎯 BOS signal usually worked fine in high volatility market, low volatility is meaningless.
🎯 D-BOS will filtered much more signals than ma-based BOS and classic BOS
We can see that it performs well in trending market of different symbols, and BOS is an opportunity to add positions,
D-BOS will filtered much more signals
Double-BOS Confirm : BINANCE:BTCUSDTPERP 30m
MA-Based BOS : BINANCE:BTCUSDTPERP 30m
🎯 Support classic HH/HL label, MA-Based Zigzag
🎯 You can use only D-BOS, MA-BOS or Classic-BOS alone, or D-BOS and one of the other, it's up to you,
but my personal preference is to use D-BOS and MA-BOS in combination
🎯 any questions or suggestion please comment below, I would appreciate it greatly.
Additionally, I plan to publish 20 profitable strategies in 2023; indicatior not one of them,
let‘s witness it together!
Hope this indicator will be useful for you :)
enjoy! 🚀🚀🚀
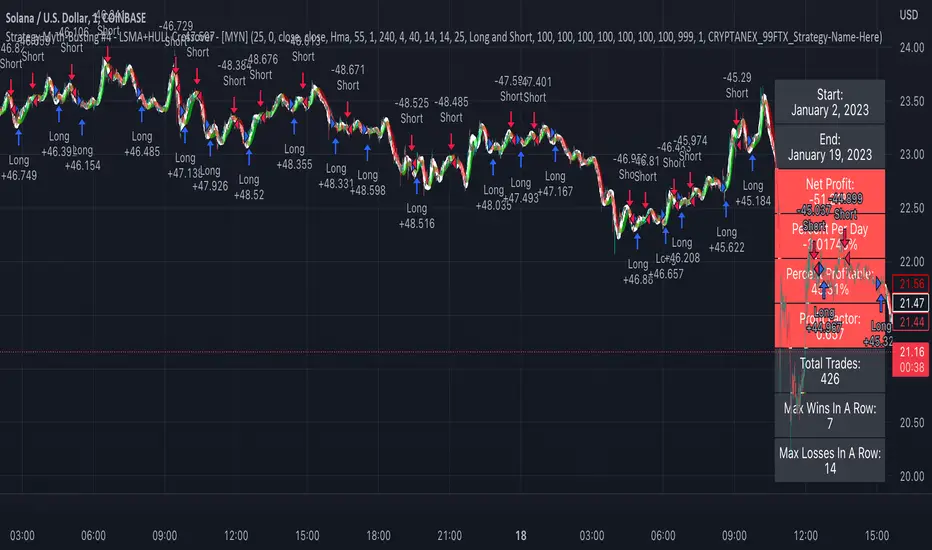
Strategy Myth-Busting #4 - LSMA+HULL Crossover - [MYN]This is part of a new series we are calling "Strategy Myth-Busting" where we take open public manual trading strategies and automate them. The goal is to not only validate the authenticity of the claims but to provide an automated version for traders who wish to trade autonomously.
Our fourth one we are automating is one of the strategies from "I Found The Best 1 Minute Scalping Strategy That Actually Works! ( Beginner Friendly )" from "Trade Domination" who claims to have made 366% profit on the 1 min chart of Solona despite having a 31% win rate in just a few weeks. As you can see from the backtest results below, I was unable to substantiate anything close to that that claim on the same symbol ( SOLUSD ), timeframe (1m) with identical instrument settings that "Trade Domination" was demonstrating with. Strategy Busted.
If you know of or have a strategy you want to see myth-busted or just have an idea for one, please feel free to message me.
This strategy uses a combination of 2 open-source public indicators:
LSMA
Hull Suite by InSilico
Trading Rules
1 min candles
Stop Loss on recent swing High/Low
1:5 Risk Ratio
Enter Long
LSMA cross above Red Hull Suite line
Price has to be above Hull Suite Line
Enter Short
LSMA crosses under green Hull Suite Line
Price has to be below Hull Suite Line
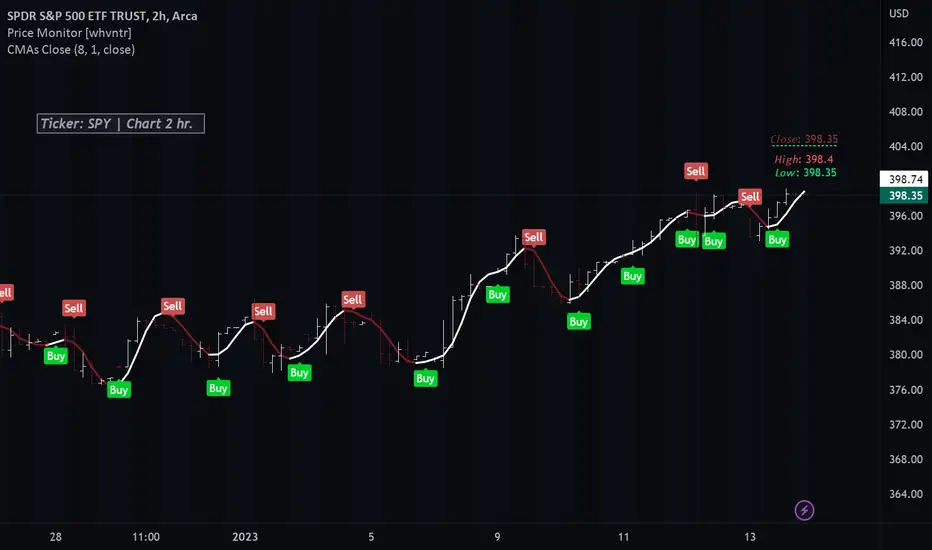
Colored Moving Averages With Close Signals[Whvntr][TradeStation]Plots the first time the close price is above or below the colored portion of the chosen MA. The MA's formula is from TradeStation's indicator: "Colored Moving Averages Can Help You Spot Trends" . I modified that indicator with customizations that include: Buy and Sell signals. Each time the current bar closes above the MA, while it's red (bearish), there's a Sell label at the start of that MA trend. Likewise: each time the current bar closes below the MA, while it's white (bullish), there's a Buy label at the beginning of that MA trend. You can now, also, easily see which MA you are selecting by hovering your cursor over the tooltips icon. I've included a modified Hull MA as default because I've found this SMA combination with the WMA to be a very smooth oscillation. I've also added some different types of MA's. Colored moving averages are helpful to determine when a trend may be reversing.
MA's
1 · Modified Hull MA: (SMA of the WMAs Hull Formula)
2 · Hull MA
3 · Exponential Moving Average
4 · Weighted Moving Average
5 · RMA Moving Average used in RSI
6 · Volume Weighted MA
7 · Simple Moving Average
This indicator isn't endorsed as a guarantee of future, favorable, results.
Market Structure MA Based BOS [liwei666]
🎲 Overview
🎯 This BOS(Break Of Structure) indicator build based on different MA such as EMA/RMA/HMA, it's usually earlier than pivothigh() method
when trend beginning, customer your BOS with 2 parameters now.
🎲 Indicator design logic
🎯 The logic is simple and code looks complex, I‘ll explain core logic but not code details.
1. use close-in EMA's highest/lowest value mark as SWING High/Low when EMA crossover/under,
not use func ta.pivothigh()/ta.pivotlow()
2. once price reaching EMA’s SWING High/Low, draw a line link High/Low to current bar, labled as BOS
3. find regular pattern benefit your trading.
🎲 Settings
🎯 there are 4 input properties in script, 2 properties are meaningful in 'GRP1' another 2 are display config in 'GRP2'.
GRP1
MA_Type: MA type you can choose(EMA/RMA/SMA/HMA), default is 'HMA'.
short_ma_len: MA length of your current timeframe on chart
GRP2
show_short_zz: Show short_ma Zigzag
show_ma_cross_signal: Show ma_cross_signal
🎲 Usage
🎯 BOS signal usually worked fine in high volatility market, low volatility is meaningless.
🎯 We can see that it performs well in trending market of different symbols, and BOS is an opportunity to add positions
BINANCE:BTCUSDTPERP
BINANCE:ETHUSDTPERP
🎯 MA Based signal is earlier than pivothigh()/pivotlow() method when trend beginning. it means higher profit-loss rate.
🎯 any questions or suggestion please comment below.
Additionally, I plan to publish 20 profitable strategies in 2023; indicatior not one of them,
let‘s witness it together!
Hope this indicator will be useful for you :)
enjoy! 🚀🚀🚀

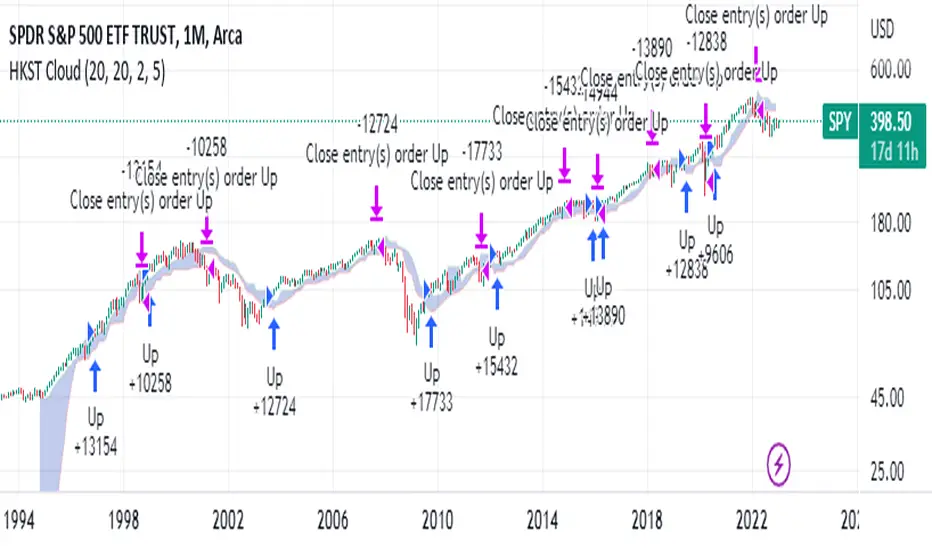
Hull Kaufman SuperTrend Cloud (HKST Cloud)TLDR: This is a long only trend following system that uses highest and lowest values of three trend following indicators to form a "cloud". Enter when the candle high crosses above the highest band. Close if the low or close crosses below the lowest band.
3 indicators
1. Kaufman Adaptive moving Average - set at 20
2. Hull Moving Average (of the Kaufman Adaptive moving average) - set at 20
3. SuperTrend - I believe this is set at 5 periods and 3*atr but this can be changed
Cloud
the upper band is the highest of the 3 indicators
the lower band is the lowest of the 3 indicators
Entry and Exit:
Enter when the high crosses above the upper band of the cloud.
(This means you will only get a long signal if the high was previously below the upper band of the cloud and then crosses over.)
Exit when the low crosses below the lower band of the cloud .
(This means that this rule will only close if the low was previously above the upper band and then crosses under)
The "Exit" may not trigger if the low (the wick) never gets above the band. In this case the long order will close if the closing price is below the cloud.
Logic
Kaufamn is the best moving average i have found at responding to changes in volatility. This means it moves up or down quickly during expansive moves but becoming very flat during relative choppiness. However, getting flat causes the the Kaufman AMA to trigger a lot of false signals when volatility is transitioning from high to low. This is why the Hull moving average (with its rounded turns) keeps a lot of the false continuations contained because usually prices need to decisively move higher in order to over come the Hull moving average which continues to increase/decrease during the candles after an expansive move.
The super trend places a stagnant floor and ceiling which acts as a great stoploss or trigger as price action attempts to trend in a certain direction. The super trend allows for the user to adjust the likely hood of this cloud indicator changing from bullish to bearish based on the volatility of the asset that is being analyzed.
individually all of these are great. Together the trader can use this cloud to create a trend following or anlysis system that captures the bulk of moves.
Not my best explanation but this indicator is actually pretty simple.
Hope this helps. Happy Trades
-Snarky Puppy
Multi-Timeframe MA Based Zigzag[liwei666]🎲 Overview
🎯 This Zigzag indicator build based on different MA such as EMA/HMA/RMA/SMA, support multi-timeframe setting .
you can get customer zigzag indicator by change short/long ma length and high-timeframe config(5m/15m/30m/1h/2h) in any symbol.
🎲 Indicator design logic
🎯 entired logic is simple and code looks complex, I‘ll explain core logic here, code already equipped with detailed comments.
1. use close-in EMA's highest/lowest value mark as SWING High/Low when EMA crossover/under, not use func ta.pivothigh()/ta.pivotlow()
2. when EMA crossover/under plot a char as signal like ●/❄/▲, crossover get blue char crossunder get red char
3. latest zigzag line is not drawn until EMA is turned (crossover/under), but signal is realtime
4. you can see diff zigzag structure when you open high-timeframe config, then find regular pattern benefit your trading.
🎲 Settings
🎯 there are 3 group properties in script, just focus on 5 properties in 'GRP1' ,
'GRP2' and 'GRP3' are display config.
'GRP1':
MA_Type: MA type you can choose(EMA/RMA/SMA/HMA/WMA), default is EMA
short_ma_len: short MA length of your current timeframe on chart
long_ma_len: long MA length of your current timeframe on chart
htf_ma_len: MA length of high timeframe, MA type same as 'MA_Type' config
htf_ma_tf: high timeframe ma length, 15/30/60/120 minute
'GRP2':
• show_short_zz • show_long_zz • show_htf_zz:
'GRP3':
• show_short_ma_line • show_short_ma_signal
• show_long_ma_line • show_long_ma_signal
• show_htf_ma_line • show_htf_ma_signal
🎲 Usage
🎯 As we know, MA based signal usually worked fine in trend market , low volatility is unprofitable.
🎯 One of pattern as the chart show below.
1. success example : after a blue ▲ signal, entry long when blue ● signal appear, marked with green box.
2. failed example: after a blue ▲ signal, a red ▼ signal appear, marked with white box.
🎯 BoS(Break of Structure) based on ma zigzag is a good idea I'm implementing, it will be published in next script.
Additionally, I plan to publish 20 profitable strategies in 2023; this indicatior not one of them,
let‘s witness it together!
Hope this indicator will be useful for you :)
enjoy! 🚀🚀🚀

Volume Weighted Hull Moving Average Bollinger Bands (VWHBB)Title: "Volume Weighted Hull Moving Average Bollinger Bands Indicator for TradingView"
Abstract: This script presents a TradingView indicator that displays Bollinger Bands based on the volume weighted Hull Moving Average (VEHMA) of a financial asset. The VEHMA is a technical analysis tool that combines the reduced lag of the Hull Moving Average (HMA) with volume weighting to provide a more sensitive indicator of market trends and dynamics. The Bollinger Bands are a volatility indicator that plot upper and lower bands around a moving average, which can help traders identify potential trend changes and overbought or oversold conditions. The script allows the user to customize the VEHMA length and Bollinger Band deviation parameters.
Introduction: Bollinger Bands are a popular technical analysis tool used to identify potential trend changes and overbought or oversold conditions in the market. They are constructed by plotting upper and lower bands around a moving average, with the width of the bands determined by the volatility of the asset. The VEHMA is a variant of the Hull Moving Average (HMA) that combines the reduced lag of the HMA with volume weighting to provide a more sensitive indicator of market trends and dynamics.
Methodology: The VEHMA is calculated using a weighted average of two exponential moving averages (EMAs), with the weighting based on the volume of the asset and the length of the moving average. The Bollinger Bands are calculated by plotting the VEHMA plus and minus a standard deviation of the asset's price over a specified period. The standard deviation is a measure of the volatility of the asset and helps to adjust the width of the bands based on market conditions.
Implementation: The script is implemented in TradingView's PineScript language and can be easily added to any chart on the platform. The user can customize the VEHMA length and Bollinger Band deviation parameters to suit their trading strategy. The VEHMA, Bollinger Bands, and fill colors are plotted on the chart to provide a visual representation of the indicator.
Conclusion: The VEHMA Bollinger Bands indicator is a useful tool for traders looking to identify potential trend changes and overbought or oversold conditions in the market. This script provides a convenient and customizable implementation of the indicator for use in TradingView.

HMA Breakout Buy/Sell indicator for Scalping & Intraday - ShyamHi All,
This is a very simple indicator which provides the buy signal, when the moving average lines turns Green and sell signal, when the moving average signal turns red. This can be used for both intraday and scalping method with different timeframes. But best time frame is 5 minutes.
Buy Signal >>> Line turns GREEN (Use trailing SL to cover maximum profit)
Sell Signal >>> Line turns RED (Use trailing SL to cover maximum profit)
No trade >>> Line turns GRAY
Best timeframe >>> 5 minutes
Thanks,
Shyam

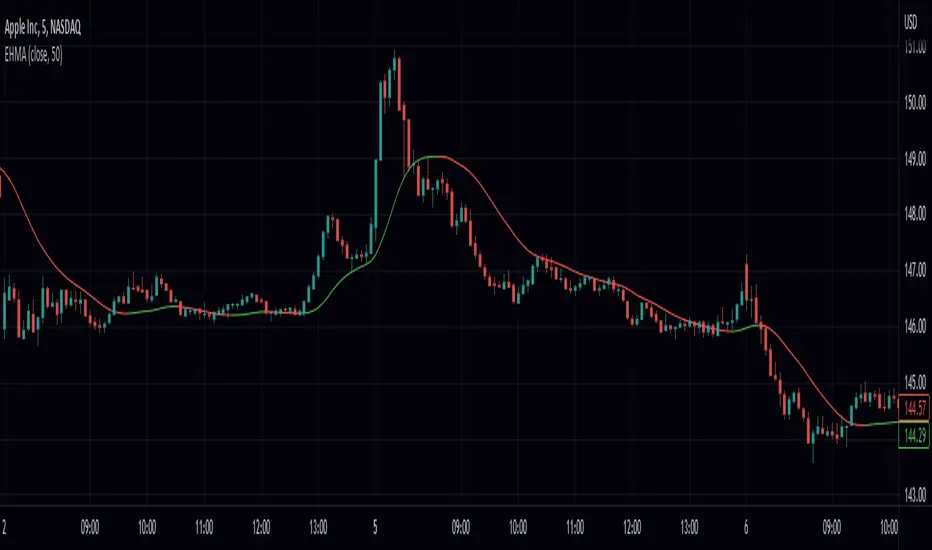
Exponential Hull Moving Average With Alerts (EHMA)Hello! This is simply HMA calculated with EMA's instead of WMA! I have added alerts for the direction of the average.
Heres a recap the traditional HMA:
The Hull Moving Average ( HMA ) attempts to minimize the lag of a traditional moving average while retaining the smoothness of the moving average line. Developed by Alan Hull in 2005, this indicator makes use of weighted moving averages to prioritize more recent values and greatly reduce lag.
Strategy Myth-Busting #20 - HalfTrend+HullButterfly - [MYN]#20 on the Myth-Busting bench, we are automating the " I Found Super Easy 1 Minute Scalping System And Backtest It 100 Times " strategy from " Jessy Trading " who claims 30.58% net profit over 100 trades in a couple of weeks with a 51% win rate and profit factor of 1.56 on EURUSD .
This one surprised us quite a bit. Despite the title of this strategy indicating this is on the 1 min timeframe, the author demonstrates the backtesting manually on the 5 minute timeframe. Given the simplicity of this strategy only incorporating a couple of indicators, it's robustness being able to be profitable in both low and high timeframes and on multiple symbols was quite refreshing.
The 3 settings which we need to pay most attention to here is the Hull Butterfly length, HalfTrend amplitude and the Max Number Of Bars Between Hull and HalfTrend Trigger. Depending on the timeframe and symbol, these settings greatly impact the performance outcomes of the strategy. I've listed a couple of these below.
And as always, If you know of or have a strategy you want to see myth-busted or just have an idea for one, please feel free to message me.
This strategy uses a combination of 3 open-source public indicators:
Hull Butterfly Oscillator by LuxAlgo
HalfTrend by Everget
Trading Rules
5 min candles but higher / lower candles work too.
Stop loss at swing high/low
Take Profit 1.5x the risk
Long
Hull Butterfly gives us green column, Wait for HalfTrend to present an up arrow and enter trade.
Short
Hull Butterfly gives us a red column , Wait for HalfTrend to present a down arrow and enter trade.
Alternative Trading Settings for different time frames
1 Minute Timeframe
Move the Hull Butterfly length from the default 11 to 9
Move the HalfTrend Amplitude from the default 2 to 1
Enabling ADX Filter with a 25 threshold
2 Hour Timeframe
Move the HalfTrend Amplitude from the default 2 to 1
Laddered Take Profits from 14.5% to 19% with an 8% SL

HMA Slope OscillatorA Hull Moving Average (HMA) slope oscillator. It uses a HMA slope to identify up/down trends. Usage is simple: adjust the HMA and signal length according to your needs. Long orders start when the bar changes from under (the zero line) to over the zero line. You can also spot "early" long entries when the bar moves close to the zero line. Short orders should be placed when a red bar appears after blue bars (top of the mountain).
"Play" with the length to find the best settings for your trading strategy.
** I have not added alerts. If you need alerts just let me know and I will be happy to update this indicator.

Outback RSI & Hull [TTF]This indicator was originally made to help users following along with one of our strategies that we call The Outback (hence the name).
One of the component indicators of that strategy is an RSI with a Hull Moving Average added on top of the RSI as an additional reference for the momentum of the RSI. Many people either had difficulty setting this up correctly, or were having issues with the Indicator on Indicator component, so we built this indicator to assist in that regard.
As we continued to use it, we found it to be a pretty sound momentum indicator that had much to offer by enhancing the more normal RSI, and wanted to make this indicator generally available to the public.
The basic premise of this indicator is as follows:
The core is a traditional RSI with a "normal" (usually Simple) moving average
The "secret sauce" is adding a 2nd moving average (a Hull Moving Average, inspired by Insilico's awesome Hull Suite) based off the RSI
By leveraging the RSI's position relative to both the Simple and Hull moving averages, you can better gauge the relative strength of the current momentum, as well as better visualize longer-term momentum direction and strength based on the moving average slopes and direction.

HZlog This indicator is based on HUll (shown ) plus log trend
to control it you need to play with the following :
TF is in minute time - I use this method as it allow us to calibrate it more precisely then regular way of Hull indicator
next is the factor value set to 0.001 ( you can increase it if you want less signals to be )
signals of buy and sell are added
I hope you like this indicator

Hull Butterfly Oscillator [LuxAlgo]The Hull Butterfly Oscillator (HBO) is an oscillator constructed from the difference between a regular Hull Moving Average (HMA) and another with coefficients flipped horizontally.
Levels are obtained from cumulative means of the absolute value of the oscillator. These are used to return dots indicating potential reversal points.
Settings
Length: Number of past price inputs processed by the oscillator.
Levels Multiplier: Determine how far the levels are from 0.
Src: Input source of the indicator.
Usage
The oscillator can be used like most available oscillators. The sign of the HBO allows determining the current trend direction, while divergences with price might indicate potential reversals.
The displayed levels can additionally indicate whether the market is overbought or oversold. When the direction of the oscillator changes while being above the upper or lower level a red dot (if above upper level) or green dot (if under lower level) will be displayed, indicating a potential reversal.
Details
The name of the indicator is directly derived behind the coefficients used for its calculation. Displaying regular Hull coefficients alongside those flipped horizontally slightly resemble a butterfly, the difference between these sets of coefficients allows obtaining the HBO.
This operation allows to obtain a more structured impulse response, potentially giving less undesired performances on the frequency domain compared to simpler operation involving subtracting the HMA to a SMA, EMA or WMA.

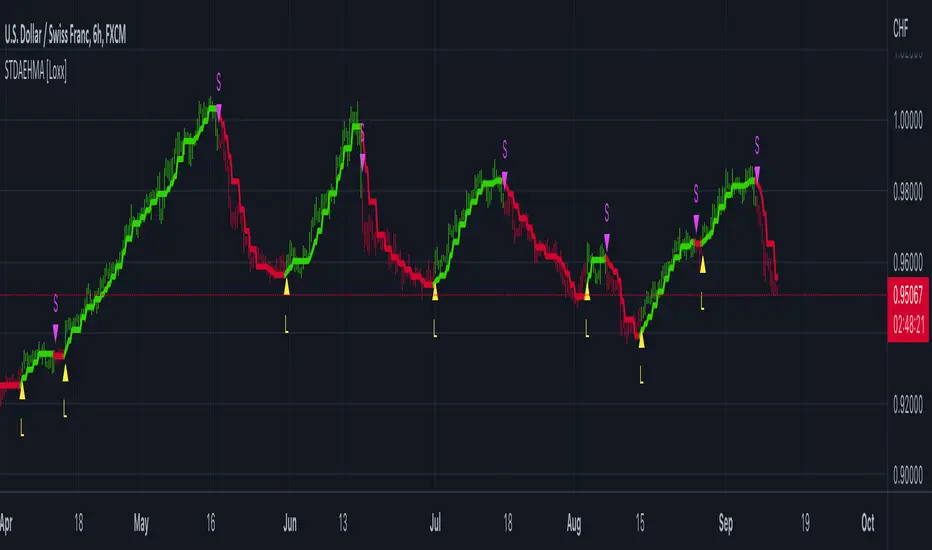
STD-Filtered, Adaptive Exponential Hull Moving Average [Loxx]STD-Filtered, Adaptive Exponential Hull Moving Average is a Kaufman Efficiency Ratio Adaptive Hull Moving Average that uses EMA instead of WMA for its computation. I've also added standard deviation stepping to further smooth the signal. Using EMA instead of WMA turns the Hull into what's called the AEHMA. You can read more about the EHMA here: eceweb1.rutgers.edu
What is the traditional Hull Moving Average?
The Hull Moving Average (HMA) attempts to minimize the lag of a traditional moving average while retaining the smoothness of the moving average line. Developed by Alan Hull in 2005, this indicator makes use of weighted moving averages to prioritize more recent values and greatly reduce lag. The resulting average is more responsive and well-suited for identifying entry points.
What is Kaufman's Efficiency Ratio?
The Efficiency Ratio (ER) was first presented by Perry Kaufman in his 1995 book ‘Smarter Trading‘. It is calculated by dividing the price change over a period by the absolute sum of the price movements that occurred to achieve that change. The resulting ratio ranges between 0 and 1 with higher values representing a more efficient or trending market.
The value of the ER ranges between 0 and 1. It has the value of 1 when prices move in the same direction for the full time over which the indicator is calculated, e.g. n bars period. It has a value of 0 when prices are unchanged over the n periods. When prices move in wide swings within the interval, the sum of the denominator becomes very large compared to the numerator and ER approaches zero.
Some uses for ER:
A qualifier for a trend following trade; a trend is considered “persistent” only when RE is above a certain value, e.g. 0.3 or 0.4 .
A filter to screen out choppy stocks/markets, where breakouts are frequently “fakeouts”.
In an adaptive trading system, helping to determine whether to apply a trend following algorithm or a mean reversion algorithm.
It is used in the calculation of Kaufman’s Adaptive Moving Average (KAMA).
How to calculate the Hull Adaptive Moving Average (HAMA)
Find Signal to Noise ratio (SNR)
Normalize SNR from 0 to 1
Calculate adaptive alphas
Apply EMAs
Included
Bar coloring
Signals
Alerts
Loxx's Expanded Source Types
HMA Slope Variation [Loxx]HMA Slope Variation is an indicator that uses HMA moving average to calculate a slope that is then weighted to derive a signal.
The center line
The center line changes color depending on the value of the:
Slope
Signal line
Threshold
If the value is above a signal line (it is not visible on the chart) and the threshold is greater than the required, then the main trend becomes up. And reversed for the trend down.
Colors and style of the histogram
The colors and style of the histogram will be drawn if the value is at the right side, if the above described trend "agrees" with the value (above is green or below zero is red) and if the High is higher than the previous High or Low is lower than the previous low, then the according type of histogram is drawn.
What is the Hull Moving Average?
The Hull Moving Average ( HMA ) attempts to minimize the lag of a traditional moving average while retaining the smoothness of the moving average line. Developed by Alan Hull in 2005, this indicator makes use of weighted moving averages to prioritize more recent values and greatly reduce lag.
Included
Alets
Signals
Bar coloring
Loxx's Expanded Source Types
