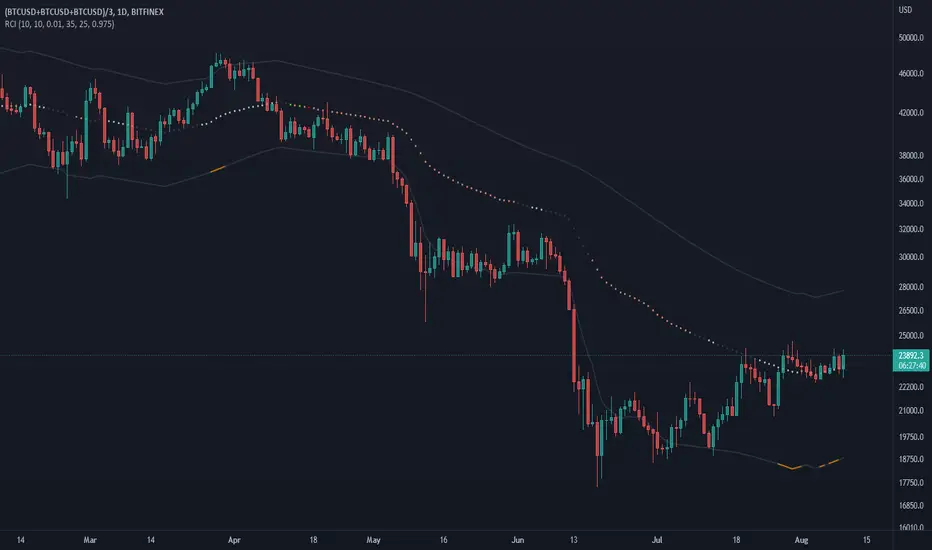
Regression Channel Trend DetectionThis is a regression channel that uses ichimoku to determine trend. The sensitivity is customizable. The centerline will change color according to the trend detected by ichimoku, and each line can act as support/resistance. The bands of the channel also change colors according to how far price is getting away from them. If you notice in this example, the lower band is turning orange when the price is getting too far away from it, suggesting that it may have risen too fast and too soon. This is still in testing so feel free to comment with any suggestions or fixes.
Awan Ichimoku
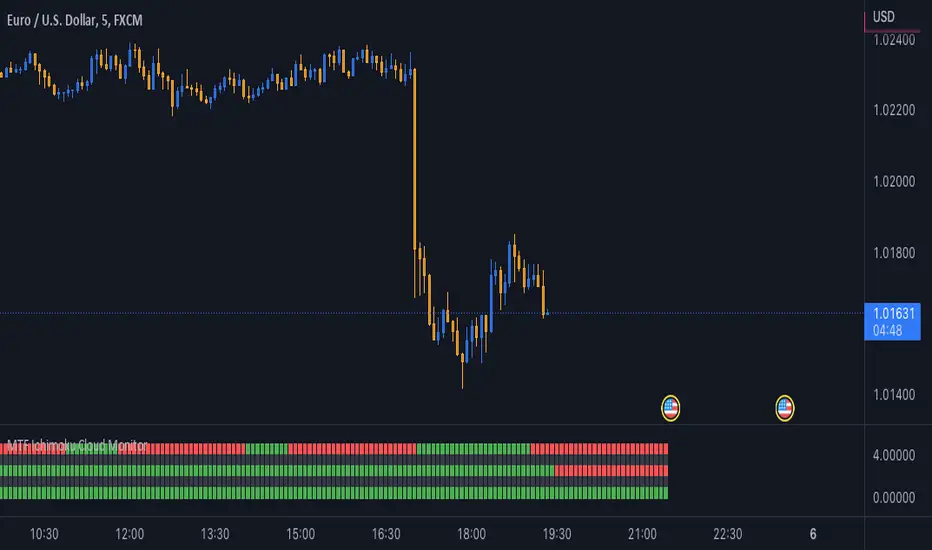
MTF Ichimoku Cloud MonitorIchimoku Kinko Hyo is a technical analysis method that builds on candlestick charting to improve the accuracy of forecast price moves.
his Indicator build for Monitor SenkouSpanA & SenkouSpanB Lines (Kumo Cloud) status and you can watch 3 Time Frames Status on one bar and in one timeframe.
You can select timeframe and set Inputs for lines from Indicator setting.
Good trading to all ...
Chiko-Span Momentum_PineScript_Version5This is Momentum indicator based on "Chiko-span" of Ichimoku Kinko-Hyo.
Differ from normal momentum indicator, this indicator is using "close" and "open" as default parameter which is based on 9 week-candle chart Invented by Ichimoku-Sanjin. And, It is located 26 period before to match chiko-span.
(Parameters can change as you like)
The usage is same as normal momentum indicator so please check momentum indicator usage. However, due to use this indicator, it may support to compare momentum of chiko-span movement and to predict effect 5 lines of ichimoku.
For example, when price break out tenkan-sen, you can measure slope or period of chiko-span momentum and compare previously chiko-span momentum. If momentum is stronger than previously price, we can think that price try to out kijun- sen, touch cloud or break out cloud.
I wish, this indicator helps ichimoku users.
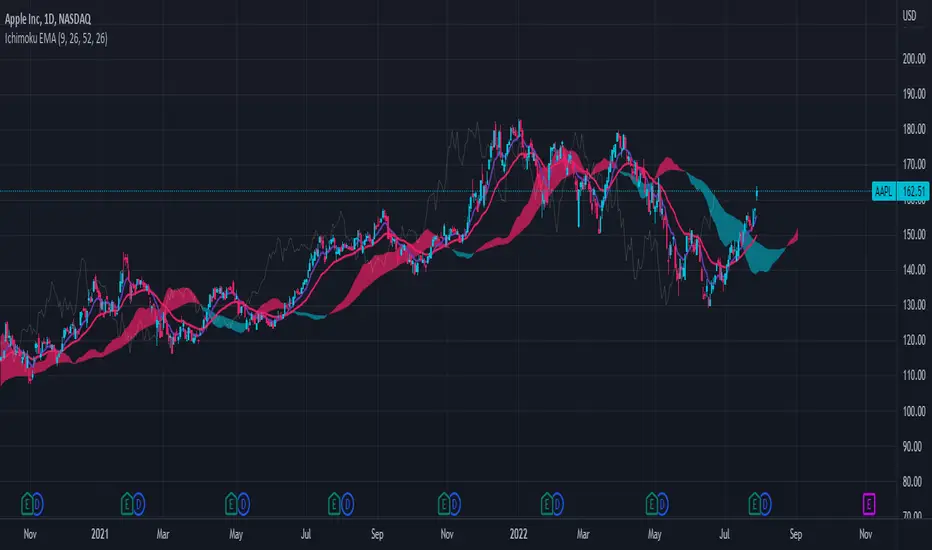
Ichimoku Cloud with EMAThis is a standard Ichimoku Cloud indicator that uses the exponential moving average (EMA) instead of the Tenkan and Kijun Sen.
It provides similar signals as the original but just looks nicer in my opinion.
pickle financialversion 1.0
A multi-use indicator
FEATURES:
1) Robust VWAP with up to 3 deviations that can be adjusted for Session, Week, Month, Quarter, Year, Decade, Century, Earnings , Dividend, & Split intervals
2) 20 customizable Moving Averages that can be changed to EMAs, SMAs , WMAs, SMMAs, and VWMAs; can also be adjusted to Candle Closes, Highs, Lows, Opens, HLC3, HL2 , OHLC4, & HLCC4
-Praise be lady VWAP

Ichimoku ImbalanceYou may have heard the word balance or imbalance
This indicator is designed based on Ichimoku periods to display imbalances in each period
When you see a black mark, it means that one of the Ichimoku periods is saturated or unbalanced
If the current candle was equal to the lowest price on 9/26/52 of the last period and the highest price was equal to the last candle from left on 9/26/52 of the last period
If the current candle was equal to the highest price on 9/26/52 of the last period and the lowest price was equal to the last candle from right on 9/26/52 of the last period
This indicator is a useful and powerful tool for Ichimoku traders to understand overbought and oversold points in different time periods.
Note: This is an auxiliary tool and does not issue buy and sell signals

HLM Trend Line (High-Low-Midpoint / Ichimoku Line)Ichimoku style trend line .
Some strategies call for a custom Ichimoku style line (midpoint of range's high/low).
This allows you to use or replace a single line without having to customize a full Ichimoku setup.

Trendlines Boll Ichi S1 by GammaprodI. How to use this indicator :
------------------------------
I.1. Set your teadingview theme to dark theme.
I.2. Gammaprod indicator is valid for forex, stock and but more valid for crypto.
I.3. Use three timeframe for more validation (choose between those, that fit to your trading style) :
- Timeframe 1m, 5m, and 15m for Scalping
- Timeframe 30m, 1h and 4h for Intraday
- Timeframe 4h, 1D and 1W for Swing Trading
I.4 Always use THREE INDICATORS FROM GAMMAPROD, those three indicators is back to back each other, by the way, I only made those three indicators only (for now) :
- Trendlines Boll Ichi S1 by Gammaprod
- MACD Volume S2 by Gammaprod
- Stoch RSI Divs Zone S2 by Gammaprod
============================================================================
II. How to setting :
--------------------
II.1. Trendlines Boll Ichi Crypto by Gammaprod
II.1.A. Support and Resistance
- Well if you familiar with this indicator you can add it, but recommended for Timeframe 30m or more
II.1.B. Trendlines Primary or Trendlines Secondary
- Timeframe 1m you DON'T NEED Trendlines Primary or Trendlines Secondary
- Timeframe 5m you DON'T NEED Trendlines Secondary, but you CAN ADD Trendlines Primary if you fell it helpful (for me, it is helpful to find where the candles start or the end trend or a consolidation or where the candles will surpass a resistance or a support).
- Timeframe 15m you DON'T NEED Trendlines Secondary, DEFENITELY add Trendlines Primary it will help to find where the candles stop or a consolidation or where the candles will surpass a resistance or a support).
- Timeframe 30m or more, DEFENITELY NEED BOTH Trendlines Primary and Secondary Trendlines, it will help to find where the candle stop or consolidation or where the candle will surpass a resistance or support).
II.1.C. Bollinger, Ichimoku Cloud and Lagging Span
- Please DON'T CHANGE IT at all, it's really helpful to know when and where to make an entry decesion or a trend or a consolidation, if you don't understand how to read it, you better to learn it first (on "how to read" section and "How to OPEN position" the section below)
II.2. Stoch RSI Divs Zone Crypto by Gammaprod (DON'T CHANGE IT)
II.3. MACD Volume Crypto by Gammaprod (DON'T CHANGE IT)
============================================================================
III. How to read :
------------------
III.1. Sell or Buy Priority :
III.1.A. Sell Priority
- Color background on macd and stoch rsi is pink or purple sell is the priority, (if you're not sure to buy, just wait until the best moment to sell)
III.1.B. Buy Priority
- Color background on macd and stoch rsi Teal or light green buy is the priority, (if you're not sure to sell, just wait until the best moment to buy)
III.1.C. Indecision / Golden Moment
- Color background on stoch rsi yellow is indecision / golden moment of reversal pattern (wait until it formed background only on Stoch RSI), please be careful at this moment.
III.2. Trend / Consolidation :
III.2.A. BULLISH trend
- When Stoch RSI and MACD have teal or light green background that's means BULLISH trend, better to confirm by the candle is above green cloud and lagging span (red line) is also above the candle.
III.2.B. BEARISH trend
- When Stoch RSI and MACD have the Pink or purple background that's means BEARISH trend, better to confirm by the candle is above purple cloud and lagging span (red line) is also below the candle.
III.2.C. CONSOLIDATION
- When Stoch RSI have the mix background that's means CONSOLIDATION, better to confirm by the candle is in or near to green / purple cloud and lagging span (red line) is also on the candle.
III.3. Special Mark
III.3.A. Ideal Bullish :
- Near line 20 and green / teal background = When Stoch RSI have the char R / H on lime color label, that's means divergence or hidden divergence for buy position, if you not see this label that's means just a standard confirmation for buy
III.3.B. Not an Ideal Bullish :
- Near line 80 and green / teal background = if this happens make sure you know what happen, it could be a false signal or bullish continual pattern
III.3.C. Ideal Bearish :
- Near line 80 and pink / purple background = When Stoch RSI have the char R / H on lime color label, that's means divergence or hidden divergence for buy position, if you not see this label that's means just a standard confirmation for sell position.
III.3.D. Not an Ideal Bearish:
- Near line 20 and pink / purple background = if this happens make sure you know what happen, it could be a false signal or bearish continual pattern
III.3.E. The Beginning of Reversal (from BEARISH to BULLISH) :
- When Stoch RSI line shaping GREEN position is near 20.
- MACD lines still PINK, position lines is UNDER the HISTOGRAM, but the HISTOGRAM start to SHAPE FALL PINK (light pink) and the BACKGROUND still PINK / PURPLE.
- Position CANDLES NEAR BLUE line, NEAR PURPLE CLOUD, and lagging span (red line) STILL ON the area candle. (it used to be confirmed with the golden moment).
III.3.F. The Beginning of Reversal (from BULLISH to BEARISH) :
- When Stoch RSI line shaping PINK position is near 80.
- MACD lines still GREEN, position lines is ABOVE the HISTOGRAM, but the HISTOGRAM start to SHAPE FALL GREEN (light green) and the BACKGROUND still TEAL / GREEN.
- Position CANDLES NEAR WHITE line, NEAR TEAL CLOUD, and lagging span (red line) STILL ON the area candle. (it used to be confirmed with the golden moment).
III.3.G. False Signals, or It could be a Golden Moment (better to see it on TF 15 or bigger):
- Near line 20 or 80 and yellow background = When Stoch RSI have the char R / H on color label, that's means divergence or hidden divergence for buy / sell position, if you not see this label that's means just a standard confirmation for buy / sell depends on where the Stoch RSI line if near 20 that's means buy, near 80 means sell
============================================================================
IV. How to OPEN position:
-------------------------
IV.1. Bullish
IV.1.A. Trendlines Boll Ichi S1 by Gammaprod
- The candles above the green cloud.
- Lagging span (red line) above the candles.
- then open buy near yellow line (the first option) / blue line (the second option) (always confirm the position with two other indicators below).
IV.1.B. MACD Volume S2 by Gammaprod
- Teal or Green background.
- The lines is shaped or shaping green.
- Better if at the green histogram.
IV.1.C. Stoch RSI Divs Zone S3 by Gammaprod
- Teal or Green background.
- The lines is shaping green.
- Better if on the bottom (at a range 20).
IV.2. Bearish
IV.2.A. Trendlines Boll Ichi S1 by Gammaprod
- The candles below the purple cloud.
- Lagging span (red line) below the candles.
- then open buy near yellow line (the first option) / white line (the second option) (always confirm the position with two other indicators below).
IV.2.B. MACD Volume S2 by Gammaprod
- Pink or purple background.
- The lines are shaped or shaping green.
- Better if at the pink histogram.
IV.2.C. Stoch RSI Divs Zone S3 by Gammaprod
- Pink or purple background.
- The lines are shaping pink.
- Better if the line on the top (at a range 80).
IV.3. Consolidation
IV.3.A. Trendlines Boll Ichi S1 by Gammaprod
- The candles on the cloud (green or purple).
- Lagging span (red line) on the candles.
- then open buy near the white or blue line (always confirm the position with two other indicators below).
IV.3.B. MACD Volume S2 by Gammaprod
- Changing the background.
- The line is near the middle line.
- Have small Histogram.
IV.3.C. Stoch RSI Divs Zone S3 by Gammaprod
- Mix background specially on a timeframe 15m or more.
- The line move fast up and down.
- Better if on the bottom or the top of the lines (at a range 20 or 80).
============================================================================
>> The secret ingredient is comparing the timeframe :
The example scalping (Timeframe 1m, 5m and 15m)
- TF 1m is for making an open position.
- TF 5m is for making a judgement of the trend market.
- TF 15m is to confirm that judgement from TF 5m, be careful if it not similar then it used to be a consolidation or the beginning of the reversal.
There's a lot a way to open the position than above information that i gave it to you, but consider there are a limit chars on this column, I hope it will help your trading and make a more profit on it.

SUPERTREND MIXED ICHI-DMI-DONCHIAN-VOL-GAP-HLBox@RLSUPERTREND MIXED ICHI-DMI-VOL-GAP-HLBox@RL
by RegisL76
This script is based on several trend indicators.
* ICHIMOKU (KINKO HYO)
* DMI (Directional Movement Index)
* SUPERTREND ICHIMOKU + SUPERTREND DMI
* DONCHIAN CANAL Optimized with Colored Bars
* HMA Hull
* Fair Value GAP
* VOLUME/ MA Volume
* PRICE / MA Price
* HHLL BOXES
All these indications are visible simultaneously on a single graph. A data table summarizes all the important information to make a good trade decision.
ICHIMOKU Indicator:
The ICHIMOKU indicator is visualized in the traditional way.
ICHIMOKU standard setting values are respected but modifiable. (Traditional defaults = .
An oriented visual symbol, near the last value, indicates the progression (Ascending, Descending or neutral) of the TENKAN-SEN and the KIJUN-SEN as well as the period used.
The CLOUD (KUMO) and the CHIKOU-SPAN are present and are essential for the complete analysis of the ICHIMOKU.
At the top of the graph are visually represented the crossings of the TENKAN and the KIJUN.
Vertical lines, accompanied by labels, make it possible to quickly visualize the particularities of the ICHIMOKU.
A line displays the current bar.
A line visualizes the end of the CLOUD (KUMO) which is shifted 25 bars into the future.
A line visualizes the end of the chikou-span, which is shifted 25 bars in the past.
DIRECTIONAL MOVEMENT INDEX (DMI) : Treated conventionally : DI+, DI-, ADX and associated with a SUPERTREND DMI.
A visual symbol at the bottom of the graph indicates DI+ and DI- crossings
A line of oriented and colored symbols (DMI Line) at the top of the chart indicates the direction and strength of the trend.
SUPERTREND ICHIMOKU + SUPERTREND DMI :
Trend following by SUPERTREND calculation.
DONCHIAN CHANNEL: Treated conventionally. (And optimized by colored bars when overshooting either up or down.
The lines, high and low of the last values of the channel are represented to quickly visualize the level of the RANGE.
SUPERTREND HMA (HULL) Treated conventionally.
The HMA line visually indicates, according to color and direction, the market trend.
A visual symbol at the bottom of the chart indicates opportunities to sell and buy.
VOLUME:
Calculation of the MOBILE AVERAGE of the volume with comparison of the volume compared to the moving average of the volume.
The indications are colored and commented according to the comparison.
PRICE: Calculation of the MOBILE AVERAGE of the price with comparison of the price compared to the moving average of the price.
The indications are colored and commented according to the comparison.
HHLL BOXES:
Visualizes in the form of a box, for a given period, the max high and min low values of the price.
The configuration allows taking into account the high and low wicks of the price or the opening and closing values.
FAIR VALUE GAP :
This indicator displays 'GAP' levels over the current time period and an optional higher time period.
The script takes into account the high/low values of the current bar and compares with the 2 previous bars.
The "gap" is generated from the lack of overlap between these bars. Bearish or bullish gaps are determined by whether the gap is above or below HmaPrice, as they tend to fill, and can be used as targets.
NOTE: FAIR VALUE GAP has no values displayed in the table and/or label.
Important information (DATA) relating to each indicator is displayed in real time in a table and/or a label.
Each information is commented and colored according to direction, value, comparison etc.
Each piece of information indicates the values of the current bar and the previous value (in "FULL" mode).
The other possible modes for viewing the table and/or the label allow a more synthetic view of the information ("CONDENSED" and "MINIMAL" modes).
In order not to overload the vision of the chart too much, the visualization box of the RANGE DONCHIAN, the vertical lines of the shifted marks of the ICHIMOKU, as well as the boxes of the HHLL Boxes indicator are only visualized intermittently (managed by an adjustable time delay ).
The "HISTORICAL INFO READING" configuration parameter set to zero (by default) makes it possible to read all the information of the current bar in progress (Bar #0). All other values allow to read the information of a historical bar. The value 1 reads the information of the bar preceding the current bar (-1). The value 10 makes it possible to read the information of the tenth bar behind (-10) compared to the current bar, etc.
At the bottom of the DATAS table and label, lights, red, green or white indicate quickly summarize the trend from the various indicators.
Each light represents the number of indicators with the same trend at a given time.
Green for a bullish trend, red for a bearish trend and white for a neutral trend.
The conditions for determining a trend are for each indicator:
SUPERTREND ICHIMOHU + DMI: the 2 Super trends together are either bullish or bearish.
Otherwise the signal is neutral.
DMI: 2 main conditions:
BULLISH if DI+ >= DI- and ADX >25.
BEARISH if DI+ < DI- and ADX >25.
NEUTRAL if the 2 conditions are not met.
ICHIMOKU: 3 main conditions:
BULLISH if PRICE above the cloud and TENKAN > KIJUN and GREEN CLOUD AHEAD.
BEARISH if PRICE below the cloud and TENKAN < KIJUN and RED CLOUD AHEAD.
The other additional conditions (Data) complete the analysis and are present for informational purposes of the trend and depend on the context.
DONCHIAN CHANNEL: 1 main condition:
BULLISH: the price has crossed above the HIGH DC line.
BEARISH: the price has gone below the LOW DC line.
NEUTRAL if the price is between the HIGH DC and LOW DC lines
The 2 other complementary conditions (Datas) complete the analysis:
HIGH DC and LOW DC are increasing, falling or stable.
SUPERTREND HMA HULL: The script determines several trend levels:
STRONG BUY, BUY, STRONG SELL, SELL AND NEUTRAL.
VOLUME: 3 trend levels:
VOLUME > MOVING AVERAGE,
VOLUME < MOVING AVERAGE,
VOLUME = MOVING AVERAGE.
PRICE: 3 trend levels:
PRICE > MOVING AVERAGE,
PRICE < MOVING AVERAGE,
PRICE = MOVING AVERAGE.
If you are using this indicator/strategy and you are satisfied with the results, you can possibly make a donation (a coffee, a pizza or more...) via paypal to: lebourg.regis@free.fr.
Thanks in advance !!!
Have good winning Trades.
**************************************************************************************************************************
SUPERTREND MIXED ICHI-DMI-VOL-GAP-HLBox@RL
by RegisL76
Ce script est basé sur plusieurs indicateurs de tendance.
* ICHIMOKU (KINKO HYO)
* DMI (Directional Movement Index)
* SUPERTREND ICHIMOKU + SUPERTREND DMI
* DONCHIAN CANAL Optimized with Colored Bars
* HMA Hull
* Fair Value GAP
* VOLUME/ MA Volume
* PRIX / MA Prix
* HHLL BOXES
Toutes ces indications sont visibles simultanément sur un seul et même graphique.
Un tableau de données récapitule toutes les informations importantes pour prendre une bonne décision de Trade.
I- Indicateur ICHIMOKU :
L’indicateur ICHIMOKU est visualisé de manière traditionnelle
Les valeurs de réglage standard ICHIMOKU sont respectées mais modifiables. (Valeurs traditionnelles par défaut =
Un symbole visuel orienté, à proximité de la dernière valeur, indique la progression (Montant, Descendant ou neutre) de la TENKAN-SEN et de la KIJUN-SEN ainsi que la période utilisée.
Le NUAGE (KUMO) et la CHIKOU-SPAN sont bien présents et sont primordiaux pour l'analyse complète de l'ICHIMOKU.
En haut du graphique sont représentés visuellement les croisements de la TENKAN et de la KIJUN.
Des lignes verticales, accompagnées d'étiquettes, permettent de visualiser rapidement les particularités de l'ICHIMOKU.
Une ligne visualise la barre en cours.
Une ligne visualise l'extrémité du NUAGE (KUMO) qui est décalé de 25 barres dans le futur.
Une ligne visualise l'extrémité de la chikou-span, qui est décalée de 25 barres dans le passé.
II-DIRECTIONAL MOVEMENT INDEX (DMI)
Traité de manière conventionnelle : DI+, DI-, ADX et associé à un SUPERTREND DMI
Un symbole visuel en bas du graphique indique les croisements DI+ et DI-
Une ligne de symboles orientés et colorés (DMI Line) en haut du graphique, indique la direction et la puissance de la tendance.
III SUPERTREND ICHIMOKU + SUPERTREND DMI
Suivi de tendance par calcul SUPERTREND
IV- DONCHIAN CANAL :
Traité de manière conventionnelle.
(Et optimisé par des barres colorées en cas de dépassement soit vers le haut, soit vers le bas.
Les lignes, haute et basse des dernières valeurs du canal sont représentées pour visualiser rapidement la fourchette du RANGE.
V- SUPERTREND HMA (HULL)
Traité de manière conventionnelle.
La ligne HMA indique visuellement, selon la couleur et l'orientation, la tendance du marché.
Un symbole visuel en bas du graphique indique les opportunités de vente et d'achat.
*VI VOLUME :
Calcul de la MOYENNE MOBILE du volume avec comparaison du volume par rapport à la moyenne mobile du volume.
Les indications sont colorées et commentées en fonction de la comparaison.
*VII PRIX :
Calcul de la MOYENNE MOBILE du prix avec comparaison du prix par rapport à la moyenne mobile du prix.
Les indications sont colorées et commentées en fonction de la comparaison.
*VIII HHLL BOXES :
Visualise sous forme de boite, pour une période donnée, les valeurs max hautes et min basses du prix.
La configuration permet de prendre en compte les mèches hautes et basses du prix ou bien les valeurs d'ouverture et de fermeture.
IX - FAIR VALUE GAP
Cet indicateur affiche les niveaux de 'GAP' sur la période temporelle actuelle ET une période temporelle facultative supérieure.
Le script prend en compte les valeurs haut/bas de la barre actuelle et compare avec les 2 barres précédentes.
Le "gap" est généré à partir du manque de recouvrement entre ces barres.
Les écarts baissiers ou haussiers sont déterminés selon que l'écart est supérieurs ou inférieur à HmaPrice, car ils ont tendance à être comblés, et peuvent être utilisés comme cibles.
NOTA : FAIR VALUE GAP n'a pas de valeurs affichées dans la table et/ou l'étiquette.
Les informations importantes (DATAS) relatives à chaque indicateur sont visualisées en temps réel dans une table et/ou une étiquette.
Chaque information est commentée et colorée en fonction de la direction, de la valeur, de la comparaison etc.
Chaque information indique la valeurs de la barre en cours et la valeur précédente ( en mode "COMPLET").
Les autres modes possibles pour visualiser la table et/ou l'étiquette, permettent une vue plus synthétique des informations (modes "CONDENSÉ" et "MINIMAL").
Afin de ne pas trop surcharger la vision du graphique, la boite de visualisation du RANGE DONCHIAN, les lignes verticales des marques décalées de l'ICHIMOKU, ainsi que les boites de l'indicateur HHLL Boxes ne sont visualisées que de manière intermittente (géré par une temporisation réglable ).
Le paramètre de configuration "HISTORICAL INFO READING" réglé sur zéro (par défaut) permet de lire toutes les informations de la barre actuelle en cours (Barre #0).
Toutes autres valeurs permet de lire les informations d'une barre historique. La valeur 1 permet de lire les informations de la barre précédant la barre en cours (-1).
La valeur 10 permet de lire les information de la dixième barre en arrière (-10) par rapport à la barre en cours, etc.
Dans le bas de la table et de l'étiquette de DATAS, des voyants, rouge, vert ou blanc indique de manière rapide la synthèse de la tendance issue des différents indicateurs.
Chaque voyant représente le nombre d'indicateur ayant la même tendance à un instant donné. Vert pour une tendance Bullish, rouge pour une tendance Bearish et blanc pour une tendance neutre.
Les conditions pour déterminer une tendance sont pour chaque indicateur :
SUPERTREND ICHIMOHU + DMI : les 2 Super trends sont ensemble soit bullish soit Bearish. Sinon le signal est neutre.
DMI : 2 conditions principales :
BULLISH si DI+ >= DI- et ADX >25.
BEARISH si DI+ < DI- et ADX >25.
NEUTRE si les 2 conditions ne sont pas remplies.
ICHIMOKU : 3 conditions principales :
BULLISH si PRIX au dessus du nuage et TENKAN > KIJUN et NUAGE VERT DEVANT.
BEARISH si PRIX en dessous du nuage et TENKAN < KIJUN et NUAGE ROUGE DEVANT.
Les autres conditions complémentaires (Datas) complètent l'analyse et sont présents à titre informatif de la tendance et dépendent du contexte.
CANAL DONCHIAN : 1 condition principale :
BULLISH : le prix est passé au dessus de la ligne HIGH DC.
BEARISH : le prix est passé au dessous de la ligne LOW DC.
NEUTRE si le prix se situe entre les lignes HIGH DC et LOW DC
Les 2 autres conditions complémentaires (Datas) complètent l'analyse : HIGH DC et LOW DC sont croissants, descendants ou stables.
SUPERTREND HMA HULL :
Le script détermine plusieurs niveaux de tendance :
STRONG BUY, BUY, STRONG SELL, SELL ET NEUTRE.
VOLUME : 3 niveaux de tendance :
VOLUME > MOYENNE MOBILE, VOLUME < MOYENNE MOBILE, VOLUME = MOYENNE MOBILE.
PRIX : 3 niveaux de tendance :
PRIX > MOYENNE MOBILE, PRIX < MOYENNE MOBILE, PRIX = MOYENNE MOBILE.
Si vous utilisez cet indicateur/ stratégie et que vous êtes satisfait des résultats,
vous pouvez éventuellement me faire un don (un café, une pizza ou plus ...) via paypal à : lebourg.regis@free.fr.
Merci d'avance !!!
Ayez de bons Trades gagnants.

Ichimoku Kinko HyoThis indicator is adding to the original indicator Ichimoku Cloud some visual informations.
Be aware of settings that are by default 10, 30, 60, while in the original indicator, default settings are 9, 26, 52. These are commonly consider like "crypto settings".
Tenkan = blue line
Kijun = orange line
SSB = red line
This indicator display three categories of signals that are given by the Ichimoku indicator:
- tenkan / kijun crosses ;
- breaks of mid prices for the different time horizon ;
- bar coloring depending of the trend
Let's review more in deep each of these elements.
Tenkan / Kijun crosses
When the tenkan crossover the kijun, this is called gold cross and it's display by a green triangle at the bottom of the chart.
When the tenkan crossunder the kijun, this is called death cross and it's display by a red triangle at the top of the chart.
I advise to not enter long or short only on this signal because it can be fake, especially during ranges.
To confirm the signal, we need to wait for a movement of the kijun in the same side of the cross. See first arrow on the chart.
Breaks of mid prices
Ichimoku is composed of three han-le lines that displays mid-price of the last candles depending on the settings (10, 30, 60).
Tenkan show us the mid-price of the last 10 candles (short term)
Kijun show us the mid-price of the last 30 candles (mid term)
SSB show us the mid-price of the last 60 candles (long term)
Break of tenkan by the price is the first signal that Ichimoku gives us before a reversal of the trend. This signal is display by a blue triangle.
Then, happened the break of kijun line follow by the break of the SSB. These are display respectively by an orange triangle and a red triangle.
Same advise, don't enter long or short only on break of these lines.
However, tenkan and kijun breaks can be used as exit point.
Bar coloring
The bar coloring display the strength of the trend:
- green candle: strong bullish trend - this happen when the current price is above tenkan, kijun and SSB ;
- blue candle: potential starting of a bullish trend - this happen when the current price is above tenkan and kijun but below the SSB ;
- no colored candle: no trend, market is in a range - this happen when the current price is above tenkan and below kijun and SSB or when the current price is below tenkan and above kijun and SSB ;
- orange candle: potential starting of a bearish trend - this happen when the current price is below tenkan and kijun but above SSB ;
- red candle: strong bearish trend - this happen when the current price is below tenkan, kijun and SSB
How to use to enter / exit trades
First of all, we need confirmations to enter in the side of the trend.
The first signal that the indicator gives us is the break of tenkan, follow by the break of kijun. Candles becomes blue / orange depending of the side.
Then, we wait for a cross of tenkan and kijun. This cross has to be confirmed by a movement of kijun. A flat kijun tell us this is a fake cross.
When the movement of kijun happened in the same side of the cross it is possible to enter a trade if you are aggresive.
Otherwise, you can wait for the third signal to take place: break of SSB, candle become green / red, depending on the side.
You can then enter a trade.
Then hold the position and wait to exit for break of tenkan or kijun, depending on your horizon (short / mid term).
If you have other questions or some features that are missing, pm me. Thanks.

Ichimoku [2022] [v5] [keivanipchihagh]A more personalized ichimoki indicator with more configurations.
This indicator is exactly like the original ichimoku indicator, but with 104 Line (x4 timeframe) , 208 Line (x8 timeframe) , Quality Line and Tenken-sen & Kijun-sen crossovers added as well. The extras added to the indicator can simply be hidden in order to make the chart look less full.
104 Line : The formula is to average the highest and lowest point of the last 104 candles. This is to see the x4 time-frame as well, which shows a strong support and resistance line.
208 Line : The formula is to average the highest and lowest point of the last 208 candles. This is to see the 84 time-frame as well, which shows even a stronger support and resistance line.
Quality Line : It's exactly the same the Kijun-sen but with a positive offset of 26.
Tenken-sen & Kijun-sen Crossoveers : Just to make it easier to see the crossovers.
In future updates, I'm going to add more components and make it more insightful than it currently is. Ideas would be appreciated (:
Ichimoku PeeksThis indicator uses the Ichimoku Tenkan / Kijun trend line formulas to predict what those values will be in the future if current price action does not violate the period highs and lows.
Because of the way Ichimoku formulates the trend, it contains (but does not visualize) this predictive information in a way that moving averages do not.
Sharp chart readers can infer upcoming changes by counting back candles, but the process can be automated, as I've shown here.
This description does not seem to be editable so implementation details and usage will be covered in code commentary.
Ichimoku Kinko Hyo [+Conditions]version 5 script - Future Cloud visible at real-time
This Ichimoku Indicator has 30 conditions identified for usage such:
Thick cloud identification (relative to the historic cloud thickness), Chikou in open area, Thin cloud identification (Relative to %), Price movements near Tenkan and Kijun and many more.
p.s. use 'calc_on_every_tick=false' in strategies to avoid repainting

Ichimoku Cloud Smooth OscillatorThe Ichimoku Cloud is a powerful indicator to track trends. By smoothing it and placing it in a separate chart, the signals can be easily identified without cluttering the display. The bold line is the signal: green indicates a buy signal while red indicates a sell signal. Gray represents a possible change in direction and the lack of a trend. The thinner line is the width of the cloud which can be used to further determine the direction.

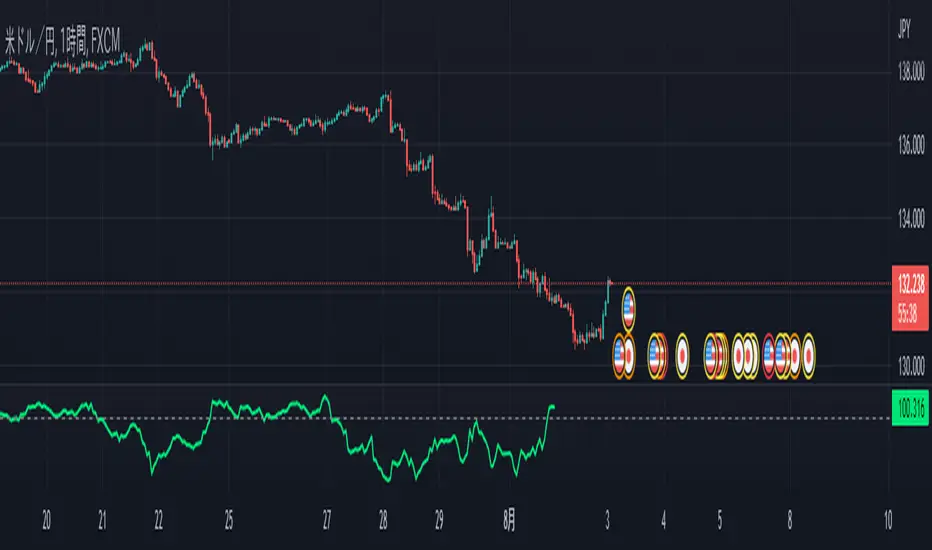
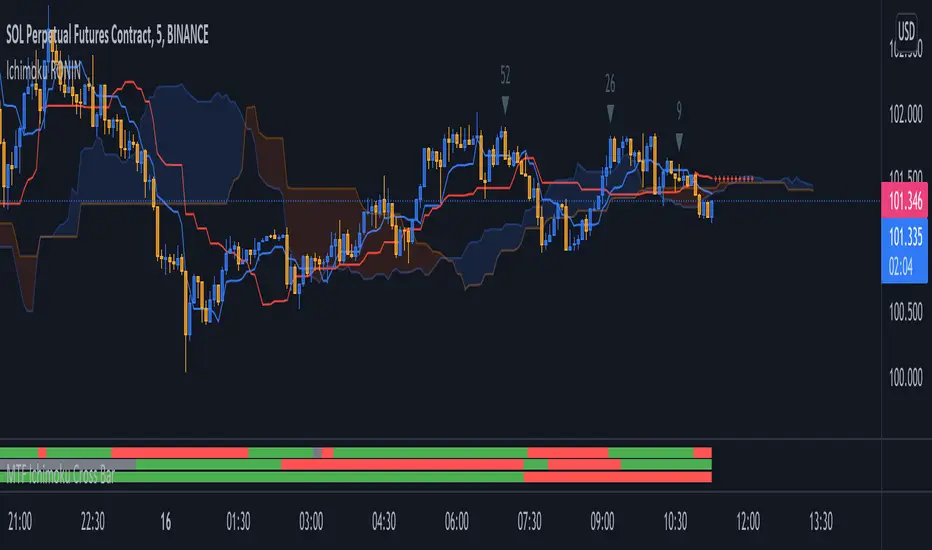
MTF Ichimoku Cross MonitorIchimoku Kinko Hyo is a technical analysis method that builds on candlestick charting to improve the accuracy of forecast price moves and Crossing TenkanSen ((HH + LL)/2 for the last 9 periods) & KijunSen (HH + LL)/2 for the last 26 periods) is One of major strategies on Ichimoku.
This Indicator build for Monitor Tenkansen & Kijunsen Lines status and you can watch 3 Time Frames Status on one bar and in one timeframe.
You can select timeframe and set Inputs for lines from Indicator setting.
Good trading to all ...
MTF Ichimoku Analysis[tanayroy]Ichimoku can state market conditions better than any indicator or group of indicators(My own perspective). Ichimoku works seamlessly in different timeframes. Analysis of Ichimoku in different timeframes can give you the bigger picture of the market.
This indicator analyzes six different timeframes with Ichimoku in depth. Default timeframes are 5M, 30M, 60M, D, W, and M. You can change the default timeframes from the setting.
As we are dealing with many relations, we can define the relationship with a simple score to get the trend strength.
Ichimoku Analysis:
Relationship of Price(P) with Ichimoku indicators: Here we are analyzing the current price and Ichimoku indicators. The position of price with respect to Ichimoku indicators states the market condition clearly.
Price(P) and Kumo(C): P > C = Bullish (↑). P < C = Bearish (↓). P <> C = consolidation or no trend(↔). Score: ±2
Price(P) and Tenkan Sen(T): P >= T = Bullish (↑). P < T = Bearish (↓). Score: ±0.5
Price(P) and Kijun Sen(K): P >= K = Bullish (↑). P < T = Bearish (↓). Score: ±0.5
Price(26 bars ago) and Chiku(L): L >= P(26) = Bullish (↑). L < P(26) = Bearish (↓). Score: ±0.5
Tenkan Sen and Kijun Sen Relation. Tenkan Sen depicts short-term trends and Kijun depicts mid-term trends. So this relationship is important for analyzing the current trend of the market.
Tenkan Sen(T) and Kijun Sen(K): T >= K = Bullish (↑). T < K = Bearish (↓). Score: ±2
Direction of Ichimoku indicators.
The direction of Ichimoku indicators helps us to understand the trend strength.
Tenkan Sen's(T) direction: Upward slope = Bullish (↑). Downward slope = Bearish (↓). Flat=consolidation or no trend(↔). Score: ±0.5
Kijun Sen's(K) direction: Upward slope = Bullish (↑). Downward slope = Bearish (↓). Flat=consolidation or no trend(↔). Score: ±0.5
Senkou A(A) direction: Upward slope = Bullish (↑). Downward slope = Bearish (↓). Flat=consolidation or no trend(↔). Score: ±0.5
Senkou B(A) direction: Upward slope = Bullish (↑). Downward slope = Bearish (↓). Flat=consolidation or no trend(↔). Score: ±0.5
Cloud and other Ichimoku indicators:
Kumo or Cloud is very important in the Ichimoku system. Analyzing its relation with other indicators is important to detect the overall market condition.
Kumo(C) and Tenkan Sen(T): T >= C = Bullish (↑). T < C = Bearish (↓). T <> C = consolidation or no trend(↔). Score: ±0.5
Kumo(C) and Kijun Sen(K): K >= C = Bullish (↑). K < C = Bearish (↓). K <> C = consolidation or no trend(↔). Score: ±0.5
Kumo(C) and Chiku(L): L >= C = Bullish (↑). L < C = Bearish (↓). L <> C = consolidation or no trend(↔). Score: ±0.5
Kumo(C) Shadow: By analyzing the last 252 bars(you can change this option) we are analyzing the Kumo shadow behind the current price. If Kumo shadow is present behind the price, trend strength will be weakened. Score: ±0.5
Kumo(C) Future (Senkou A(A) and Senkou B(B)): A >= B = Bullish (↑). A < B = Bearish (↓). Score: ±0.5
Chiku(L) Analysis:
Vertical and Horizontal Chiku analysis will tell us about the possible consolidation of the price.
Chiku Vertical: if the price consolidates for the next 5 bars(You can change this option) will it run into the price. Please remember we are placing the current price 26 bars ago and we are interested to see the current price in open space for a clear trend. Score: ±0.5
Chikou Horizontal: If Chiku is in open space (Not running into the price), we want to review Chiku vertically i.e how much percentage of fall or rise of the current price can cause Chiku to run into the price.
So, the maximum trend score is ±10.5.
Ichimoku signals:
We know, that the crossover of Ichimoku indicators provides important signals. In this section, you can see all the crossover i.e when they happened (Bars ago)
Distance between price and Tenkan Sen and Kijun Sen: We know, the price come back to Tenkan/Kijun if it goes far away from Tenkan/Kijun. So it is important to note the distance between Tenkan and Price.
Please note that this indicator is not a strategy or buy/sell signal. It just shows you the picture of Ichimoku in multiple timeframes. I am working on some strategies of Ichimoku and will publish the same when my research is complete.
If you want to analyze Ichimoku in a single timeframe, please review the following indicator.
To maintain the table size you can use the shorthand notation from the setting.
Table with detailed analysis:
Table with shorthand notation:
Please comment if you want any clarification or found any bugs to report.

MZ Adaptive Ichimoku Cloud (Volume, Volatility, Chikou Filter) This study is a functional enhancement to conventionally used Ichimoku Clouds . It uses particular effective adaptive parameters (Relative Volume Strength Index (MZ RVSI ), Volatility and Chikou Backward Trend Filter) to adapt dynamic lengths for Kijun-sen, Tenkan-sen, Senkou-span and Chikou .
This study uses complete available Ichimoku Clouds trading methodology to provide trade confirmations. Its still in experimental phase so will be updated accordingly.
ADAPTIVE LENGTH PARAMETERS
Relative Volume Strength Index (MZ RVSI )
For adaptive length, I tried using Volume and for this purpose I used my Relative Volume Strength Index " RVSI " indicator. RVSI is the best way to detect if Volume is going for a breakout or not and based on that indication length changes.
RVSI breaking above provided value would indicate Volume breakout and hence dynamic length would accordingly make Ichimoku Clouds more over-fitted to better act as support and resistance . Similar case would happen if Volume goes down and dynamic length becomes more under-fit.
Original RVSI Library and study can be found here:
Volatility
Average true range is used as volatility measurement and detection tool. Dual ATR condition would decide over-fitting or under-fitting of curve.
Chikou Backward Trend Filter
Chikou is basically close value of ticker offset to close and it is a good for indicating if close value has crossed potential Support/Resistance zone from past. Chikou is usually used with 26 period.
Chikou filter uses a lookback length calculated from provided lookback percentage and checks if trend was bullish or bearish within that lookback period.
Original Chikou Filter library and study can be found here:
ADAPTIVE ICHIMOKU CLOUD
Tenkan-Sen (Conversion Line)
Tenkan-sen is a moving average that is calculated by taking the average of the high and the low for the last nine periods conventionally but in this study its length is dynamically adapted based on Volume, Volatility and Chikou filter. Default adaption range is set to 9-30 which I found universally applicable to almost every market on all time-frames.
Kijun-Sen (Base Line)
The Kijun-Sen is usually considered a support/resistance line which also acts as an indicator of price movements in the future and takes a longer period into consideration, usually 26 periods compared to Tenkan-Sen’s nine periods is used conventionally. In this study, its length is set to vary in range of 20-60 based on adaptive parameters.
Senkou-Span (Leading Span)
Senkou-Span A : Senkou Span A is the average of the highs and lows of Tenkan-Sen and Kijun-Sen so it automatically adapts accroding to dynamic lengths of Tenkan and Kijun.
Senkou-Span B : Senkou Span B is usually calculated by averaging highs and lows of the past 52 periods and plotting it 26 points to the right but this study uses adaptive parameters to adapt its dynamic length in range of 50-120 which makes Kumo (Ichimoku Cloud) a better area for support and resistance. I don’t consider its necessary to adapt Kumo’s displacement to the right, so I used conventional 26 period as offset.
Chikou -Span (Lagging Span)
The Chikou Span, also known as the lagging span is formed by taking the price source and offsetting it back 26 periods to the left but I used adaptive length in range 26-50 which makes this tool a better option to check for Chikou -Price cross check in wide range.
TRADE SIGNALS & CONFIRMATIONS
Volume : RVSI used to detect volume breakout about given point. By default, On Balance Volume based RVSI is selected for all dynamic length adaption and also for trade confirmations.
Cross(Tenkan,Kijun) : Easiest way to detect trend as if Tenkan is above Kijun then market is uptrend and vice versa.
Volatility : High volatility is a good way to confirm if price is on the move or not.
Tenkan = Kijun : Because of a wide range of Tenkan and Kijun length; their value can become equal before reversal.
Chikou > Source : A very conventional way to detect price momentum as if Chikou is above price then market is in uptrend and vice versa.
Chikou Momentum : Another simpler way to represent Chikou > Source as if momentum of price source is uptrend then price will tend to follow.
Source > Kumo : Using the best tool of Ichimoku Clouds i.e. Kumo. If price crosses both Senkou-Span A & B then market has broken potential resistance leading to a good uptrend and vice versa.
Source > Tenkan : Better way to detect price trend in short term.
Chikou Backward Trend Filter : Different from Chikou >Source in a way that Chikou filter makes sure that price crosses highest/lowest within defined period.
CHARTING
Bars Coloring : Bars coloring is set as following :
src > tenkan-Sen and src > kijun-Sen : Strong uptrend detection and shown by green bars.
src < tenkan-Sen and src < kijun-Sen : Strong downtrend detection and shown by green bars.
src > tenkan-Sen and src < kijun-Sen : Better way to detect bottom reversals as if price comes above tenkan but remains below kijun; that’s early signs of recovery. Light red bars are used for this by default.
src < tenkan-Sen and src > kijun-Sen : Better way to detect top reversals as if price comes below tenkan but remains above kijun; that’s early signs of losing potential in uptrend. Dark Grey bars are used for this by default.
Kumo Coloring : Following steps are used to derive Kumo’s dynamic color:
Average of Senkou-span A and B is calculated.
RSI with 14 period of that average is calculated.
Gradient color based on calculated RSI values with 0-100 range is derived which is final Kumo color.
Chikou Span Coloring : Dynamic coloring from Chikou Filter is used as Indicator’s Chikou ’s color.
Signals Overlay : Red and Green small triangles are used as signals overlay.

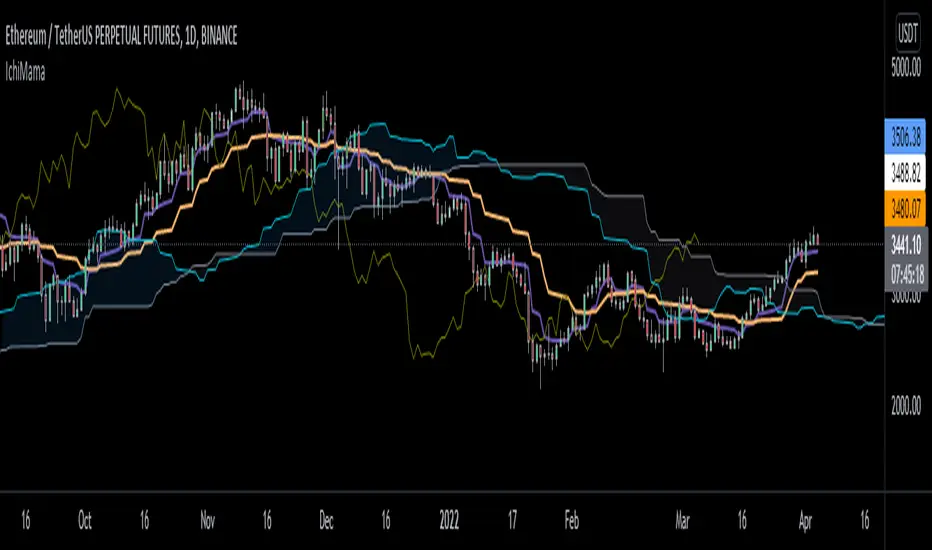
IchiMAMA (Experimental)Goichi Hosoda's "Ichimoku Kinkō Hyō" is a widely used Trend Following indicator and can be defined as a "system" rather than an indicator.
Published in the late 1960's, consisting of 5 lines.
TenkanSen (Conversion Line) = of the last 9 bars
KijunSen (Base Line) = of the last 26 bars
SenkouSpanA (Leading Span A) = Average of Tenkan&KijunSen shifted -> 26 bars
SenkouSpanB (Leading Span B) = of the last 52 bars
ChikouSpan (Lagging Span) = Price shifted <- 26 bars
On the other hand, Mesa Adaptive Moving Average developed by John Ehlers around early 2000's shows similarities with Hosoda's Tenkan and KijunSen using a different calculation method. For futher info: www.mesasoftware.com
I find MAMA superior to TenkanSen and KijunSen in terms of crossing signals.
Ichimoku:
Thus, decided to replace TenkanSen and KijunSen of regular Ichimoku with MAMA&FAMA of Ehlers and calculated SenkouSpanA accordingly. SenkouSpanB and ChikouSpan stays the same as per Ichimoku's logic. (Periods are 30 by default for cryptocurrencies. If stocks then 26)
IchiMAMA:
This is purely experimental and educational. Hope you'll like it :)
I'd like to thank @everget for MAMA&FAMA
and @KivancOzbilgic for Ichimoku Kinkō Hyō and Volume Based Colored Bars
Ichimoku VariationsThe Ichimoku cloud is traditionally constructed from the highest high and lowest low for a number of periods. This script allows for it to be transformed and calculated like more traditional moving averages (e.g. simple moving average, exponential moving average). Since the Ichimoku is normally a system of moving average-like lines, maybe someone out there will learn something from being able to switch to sma, ema, etc etc.
In general, I think no TA indicator is a magic bullet, and you should just use what you like!
Credit: This script utilizes the "Color Gradient Framework" tutorial by LucF (PineCoders) to create gradient visuals, which are also customizable for the user.
Recommended modes:
default
SMA
EMA
SMMA
WMA
VWMA
Tillson T3
Not Recommended (These moving averages are too fast, and probably will require adjusting settings to something like the 20-60-120-30 to make more sense):
HMA
EHMA
TEMA
ALMA
LSMA

Ichimoku Buy/Sell Signals of manual MTF Tenkan crossing KijunIchimoku Buy/Sell Signals based on fast, small time frame Tenkans crossing longer timeframes Kijuns - Manual MTF Analysis
This code marks the potential change of direction based on the input of one timeframe's Ichimoku Tenkan (conversion) line crossing over a higher, longer timeframe's Ichimoku Kijun (base) line.
Feel free to change the inputs if need be and to hide the yellow box. Use Ichimoku rules of Tenkan, Kijun, Lagging Span, and Cloud for Take profit/Stop Losses. It is best to wait 3-5 minutes after the signal to enter to confirm the trend and to confirm if the Lagging Span has broken key levels. I refer to the book Trading with Ichimoku - A Practical Guide to Low-Risk Ichimoku Strategies by Karen Peloille as the Ichimoku rulebook. Good luck.
For day trading/scalping/intraday - 1min/3min/5min
Tenkan Line Timeframe = 1min
Kijun Line Timeframe = 5min
For swing trading - multiple days/weeks - 4HR/Daily/Weekly Charts
Tenkan Line Timeframe = day
Kijun Line Timeframe = week

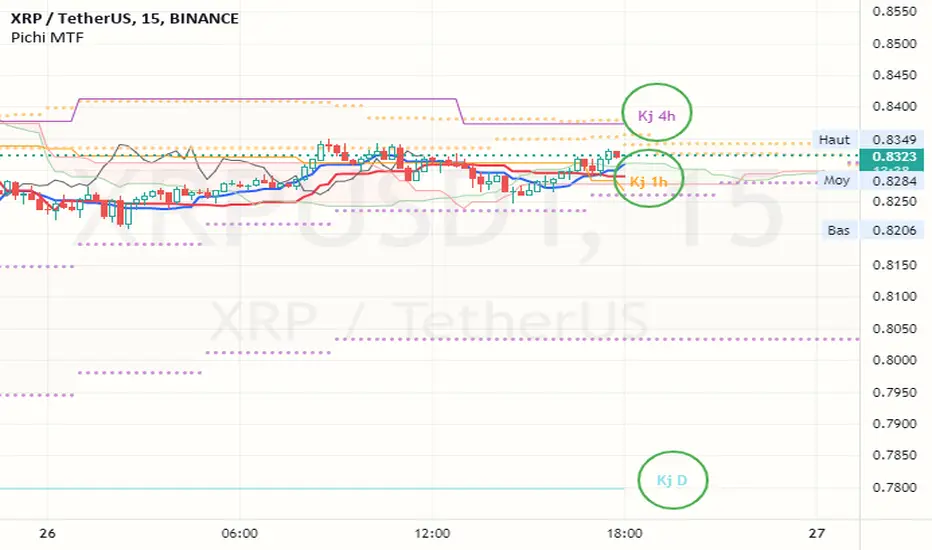
Pax24 MTF IchimokuPax24 Multiple Time Frames and Adaptative Ichimoku Cloud.
(based on the scripts : MTF Selection Framework by PineCoders and MTF ichimoku by anthonyf50)
Possible display :
- four differents Ichimoku, 1 current and 3 from higher UT (depending on your actual UT)
- Tenkan, Kijun, Chikou and Kumo for all
- labels : offset from line, color if you change style and with/without abbreviation
The 3 upper ichimoku you can display depends of your actual Time Frame :
- M1, M3 => M5 M15 H1
- M5 => M15 H1 H4
- M15, M30, M45 => H1 H4 D
- H1, H2, H3 => H4 D W
- H4, H6, H12 => D W M
- D => W M
- W => M
- M => none other
To add the indicator on your graph, go to "Indicators" then search for "Pax24 MTF Ichimoku" and add the script to your favorites.
-------- CONFIGURATION -------
Base : ichimoku numbers
ichimoku and +1 +2 +3 : Show the first ichimoku (actual UT) and 3 others (higher UT)
for each :
Tenkan : Show the Tenkan
Kijun : Show the Kijun
Chikou : Show the Chikou (Lagging span)
Kumo : Show the Kumo
Label : Show the labels
Offset : Label offset
Color : Label color (because you can't change the style of the label in "Style")
Abbreviation : Label abbreviation (Tk = Tenkan)
If you want to best see others UT kumo, change transparency in style for Kumo
There may be slow display since TradingView requires a minimum of candles to make these calculations. Just zoom out and then zoom in to fix the problem (especially for kumo).
Ichimoku Cloud MasterIchimoku Cloud Master aims to provide the ichimoku trader with easy alert functionality to not miss out on valuable trade setups. The key purpose of this script is to better visualise crucial moments in Ichimoku trading. These alerts should not be used for botting in my opinion as they always need a human to confirm the ichimoku market structure. For example, is the Kijun-Sen flat and too far away from price? A good ichimoku trader will not enter at such a point in time.
Explanation of script:
Chikou(lagging span): pink line, this is price plotted 26 bars ago. People ignore the power of this it is crucial to see how chikou behaves towards past price action as seen in the chart below where we got an entry at red arrow because chikou bounced from past fractal bottom.
Kijun-Sen(base line): Black line or color coded line. This is the equilibrium of last 26 candles. To me this is the most important line in the system as it attracts price.
Kijun = (Highest high of 26 periods + Lowest low of 26 periods) ÷ 2
Tenkan-Sen(conversion line): Blue line. This is the equilibrium of last 9 candles. In a strong uptrend price stays above this line.
Tenkan = (Highest high of 9 periods + Lowest low of 9 periods) ÷ 2
Senkou A (Leading span A)= Pink cloud line, this is the average of the 2 components projected 26 bars in the future.
Senkou A = (Tenkan + Kijun) ÷ 2
Senkou B (Leading span B) = Green cloud line, this is the 52 day equilibrium projected 26 bars in the future.
Senkou B = (Highest high of prior 52 periods + Lowest low of prior 52 periods) ÷ 2
Notice how the distance between Chikou and the cloud is also 52 bars. This is all part of Hosoda's numbers which I am not going to explain here.
Fractals: These are the black triangles you find at key turning point. If you want to know how they work reseach williams fractals. I've used fractals with a period of 9 as it is an ichimoku number. These fractals are useful when working with ichimoku wave theory. Again I will not explain that here but in further education
Fractal Support: Ability to extend lines from the fractals which can be used as an entry/exit mechanism in your trading. For example wait for tenkan to cross kijun and then enter on fractal breakout.
Signals:
Crossing of Chikou (lagging span) with past Kijun-Sen: this will color code the Bars / Kijun-Sen (you can turn this off in options)
The script also has a signal for this, this will be the green and purple diamonds. Where green is bullish and purple is bearish.
wy is this important?
When current price plotted 26 candles back (chikou) crosses over the past equilibrium (kijun-sen) this usualy means price has moved past resistance levels where sellers come in. This indicates a switch in market structure and price is bullish from this point, this is the same in the other direction.
Kumo Twist: when the kumo cloud (future) has a crossover from for example green to red (bull to bear). The script plots these using the colored cross symbols as seen in the picture above. A chikou cross + a Kumo twist at same bar of next to eachother below the cloud can be a great entry sign: this would be an entry after cross in the chart above.
Kijun Bounce: when in an uptrend the price retraces back to Kijun-Sen and starts to go back up. These are marked by the yellow circles as seen in chart below:
low below Kijun-Sen and close above it
Strong Trend: when Tenkan is above Kijun, price above cloud, future cloud green, chikou above close, chikou above Kijun we establish a strong bullish trend. For bearish the exact opposite. The script has a function to send an alert at the start of such trends and to plot them with small colored circles above the bars.
Customisation:
I've added options to disable specific aspects of the indicator for those traders who do not want to use all aspects of the indicator. In the customisation tab I've given each part a clear title so you can use your own colors/shapes.
The perfect entry?
Further info:
Look into my education pane, I will be adding education in the future. The chance of me making a more advanced version of the script including line forecasting etc is rather high so watch out for that.
For those who want to master this system I recommend reading the book:
How to make money with the ichimoku system by Balkrishna M. Sadekar
Or the originals books by Hosoda the inventor of Ichimoku if you can get your hands on them and can read Japanese.
Almost all info about the ichimoku system you find on the internet will lose you money because they reduce the system to simple signals that do not generate money.
I will be providing educational material on tradingview using this indicator.
