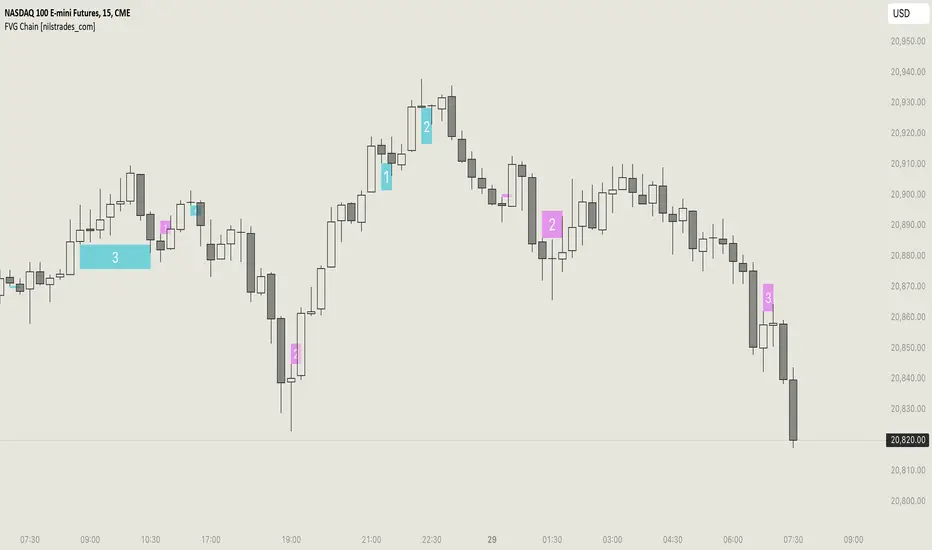
FVG Chain (Consecutive Fair Value Gaps / Imbalances)This indicator detects fair value gaps that are created out of the touch of older fair value gaps, hence creating an "FVG chain".
It counts +1 for the chain whenever a new price leg's FVG is touched.
You can use the current FVG Chain count, as well as the high, low, and price leg high/low of the current FVG as input source in external indicators. Check the data window to see the plot values.
How FVGs are detected:
Bullish: The low of the current confirmed bar is above the high of 2 bars back.
Bearish: The high of the current confirmed bar is below the low of 2 bars back.
A bullish FVG chain is broken if:
The current FVG's price leg low is broken.
The previous bar closed below the FVG, and the current confirmed bar closed below the previous bar.
A bearish FVG chain is broken if:
The current FVG's price leg high is broken.
The previous bar closed above the FVG, and the current confirmed bar closed above the previous bar.
Imbalance
Implied Fair Value Gap (IFVG) ICT [TradingFinder] Hidden FVG OTE🔵 Introduction
The Implied Fair Value Gap (IFVG) is distinctive due to its unique three-candlestick formation, which differentiates it from conventional Fair Value Gaps.
Implied fair value represents an estimated worth of an asset—often a business or its goodwill—based on the price likely to be received in a structured transaction between market participants at a specific point in time.
In the ever-evolving world of technical analysis, pinpointing price reversal points and market anomalies can significantly enhance trading strategies and decision-making for traders and investors. Among the advanced concepts gaining traction in this field is the Implied Fair Value Gap (IFVG), introduced by the renowned analyst Inner Circle Trader (ICT).
This tool has proven to be an effective method for identifying hidden supply and demand zones in financial markets, offering a unique edge to traders looking for high-probability setups.
Unlike traditional gaps that are visible on price charts, IFVG is a hidden gap that doesn’t appear explicitly on the chart and thus requires specialized technical analysis tools for accurate identification.
This hidden gap can signal potential price reversals and offers traders insight into high-liquidity areas where price is likely to react. This article will guide you through using the ICT Implied Fair Value Gap Indicator effectively, covering its settings, usage strategies, and key features to help you make informed decisions in the market.
🟣 Bullish Implied FVG
🟣 Bearish Implied FVG
🔵 How to Use
The IFVG indicator is designed to assist traders in recognizing hidden support and resistance zones by identifying Bullish and Bearish IFVG patterns. With this tool, traders can make better-informed decisions about suitable entry and exit points for their trades based on these patterns.
🟣 Bullish Implied Fair Value Gap
This pattern occurs in an uptrend when a large bullish candlestick forms, with the wicks of the previous and following candles overlapping the body of the central candlestick.
This overlap creates a demand zone or a hidden support level, which can act as an ideal entry point for buy trades. Often, when the price returns to this area, it is likely to resume its upward trend, presenting a profitable buying opportunity.
🟣 Bearish Implied Fair Value Gap
This pattern is similar but forms in downtrends. Here, a large bearish candlestick appears on the chart, with the wicks of adjacent candles overlapping its body. This overlap defines a supply zone or a hidden resistance level and serves as a signal for potential sell trades.
When the price returns to this zone, it often continues its downward trend, providing an optimal point for entering sell trades.
The IFVG indicator also includes various filters that traders can use to refine their analysis based on market conditions. These filters, including Very Aggressive, Aggressive, Defensive, and Very Defensive, allow users to customize the IFVG zones' width, offering flexibility according to the trader’s risk tolerance and trading style.
🟣 Example Trading Scenarios
Suppose you’re in a strong uptrend and the IFVG indicator identifies a Bullish IFVG zone. In this scenario, you could consider entering a buy trade when the price retraces to this zone, expecting the uptrend to resume. Conversely, in a downtrend, a Bearish IFVG zone can signal a favorable entry point for short trades when the price revisits this area.
🔵 Settings
Implied Block Validity Period: This parameter specifies the validity period of each identified block, taking into account the number of bars that have passed since its formation. Proper adjustment of this period helps traders focus only on relevant zones, increasing the accuracy of the analysis.
Mitigation Level OB : This option defines the mitigation level for supply and demand blocks (Order Blocks), with settings including Proximal, 50% OB, and Distal.
Depending on the selected level, the indicator will focus on closer, mid-range, or farther points for block identification, allowing traders to adjust for the level of precision required.
Implied Filter : Activating this filter allows traders to apply conditions based on the width of the IFVG zones. With options like Very Aggressive and Very Defensive, traders can control the width of IFVG zones to suit their risk management strategy—whether they prefer high-risk setups or low-risk setups.
Display and Color Settings : This section enables users to customize the appearance of the IFVG zones on their charts. Traders can set different colors for Bullish and Bearish zones, allowing for easier distinction and improved visualization.
Alert Settings : One of the standout features of the IFVG indicator is the alert system. By setting up alerts, users can be notified whenever the price approaches a demand or supply zone.
Alerts can be customized to trigger Once Per Bar (one alert per bar) or Per Bar Close (alert at the close of each bar), ensuring that traders stay updated on critical price movements without needing to monitor the chart continuously.
🔵 Conclusion
The ICT Implied Fair Value Gap (IFVG) indicator is a powerful and sophisticated tool in technical analysis, allowing professional traders to identify hidden supply and demand zones and use them as entry and exit points for buy and sell trades.
This indicator’s automatic detection of IFVG zones helps traders uncover hidden trading opportunities that can enhance their analysis.
While the IFVG indicator offers numerous advantages, it is important to use it in conjunction with other technical analysis tools and sound risk management practices.
IFVG alone does not guarantee profitability in trading; it works best when combined with other indicators such as volume analysis and trend-following indicators for a comprehensive trading strategy.

Fair Value Gaps Advanced [smart-money-indicators]This indicator is a tool to support the "SMC" strategy.
This indicator does not provide entry or exit signals.
This indicator is a tool to mark key price areas.
This indicator is a tool to mark key time areas.
This indicator is particularly distinguished by its high customizability of tools,
setting it apart from the indicators currently available on the TradingView platform.
This Fair Value Gaps or Imbalance Indicator marks liquidity areas using boxes.
Fair Value Gaps are created in high-momentum conditions, leaving an area that, in theory and as supported by backtesting, tends to be revisited.
The following settings can be configured:
Show only one-sided Gaps
- Only Fair Value Gaps formed by three consecutive bullish or bearish candles are displayed.
Extend Fair Value Gap
-The box is extended to the current candle.
Draw Mid Line
- A 50% line of the Fair Value Gap is drawn.
Extend Mid Line
-The midline is extended to the current candle.
Remove filled Fair Value Gap
-Filled Fair Value Gaps are removed.
Enable inverse Fair Value Gap
- When a bullish Fair Value Gap is broken, it creates a bearish resistance area.
- When a bearish Fair Value Gap is broken, it creates a bullish support area.
-Display Last X active Buyside Fair Value Gaps
-Display Last X active Sellside Fair Value Gaps
-Display Last X active Buyside Inverse Fair Value Gaps
-Display Last X active Sellside Inverse Fair Value Gaps

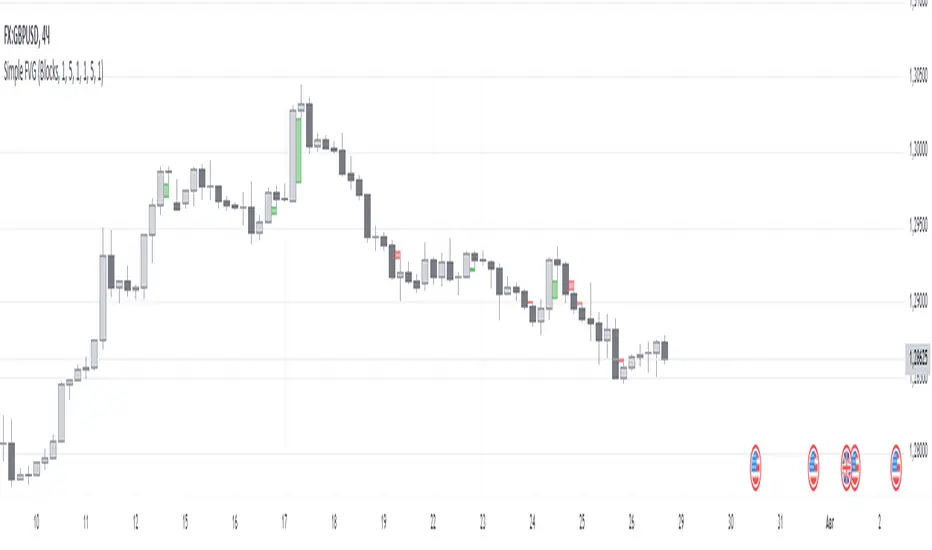
Simple FVGSimple FVG - Fair Value Gap Indicator
Overview:
The "Simple FVG" script is designed for use with TradingView to identify and visually display Fair Value Gaps (FVG) on a trading chart. This indicator highlights both bullish and bearish imbalances based on specific candlestick patterns, helping traders to quickly identify potential trading opportunities.
Key Features:
Bullish and Bearish Imbalances:
Bullish Imbalances: This script identifies bullish imbalances where the price exhibits a gap upward. The conditions for detecting a bullish imbalance are:
The high of the second candle is greater than the high of the first candle.
The low of the third candle is greater than the high of the first candle.
Bearish Imbalances: This script identifies bearish imbalances where the price exhibits a gap downward. The conditions for detecting a bearish imbalance are:
The low of the second candle is less than the low of the first candle.
The high of the third candle is less than the low of the first candle.
Customizable Display:
Bullish Blocks: Users can toggle the display of bullish imbalance blocks with customizable colors and border settings.
Bearish Blocks: Users can toggle the display of bearish imbalance blocks with customizable colors and border settings.
Color and Border Settings: Adjust the color, border color, and border width of the blocks for both bullish and bearish imbalances according to user preferences.
Visual Representation:
Drawing Blocks: The script draws filled boxes on the chart to represent identified imbalances. These blocks span from the start of the first candlestick to the end of the third candlestick, providing a clear visual indicator of the price gap.
How It Works:
Identification Logic:
The script analyzes three consecutive candles to determine if an imbalance exists.
It compares the highs and lows of these candles to establish bullish or bearish conditions.
Drawing Mechanism:
Once an imbalance condition is met, the script calculates the top and bottom levels of the imbalance block based on the high of the first candle and the low of the third candle for bullish imbalances, and vice versa for bearish imbalances.
It then draws these blocks on the chart using the specified colors and border settings.
Usage Instructions:
Add the Indicator:
Apply the "Simple FVG" indicator to your TradingView chart.
Customize Settings:
Use the input options to enable or disable the display of bullish and bearish blocks.
Adjust the colors and border settings for the imbalance blocks as needed.
Interpret Imbalances:
Look for the drawn blocks to identify potential areas where price imbalances have occurred.
Use this information to inform your trading decisions.
Originality and Value:
The "Simple FVG" script offers a unique approach to visualizing Fair Value Gaps by focusing on specific candlestick patterns. It provides traders with a tool to easily identify and analyze price imbalances, enhancing chart analysis and trading strategy development.
Chart Information:
Ensure to show the complete symbol, timeframe, and script name information on your chart for clarity and reference.
For further details and usage guidelines, refer to the TradingView House Rules.
Note: This script adheres to TradingView's guidelines for originality and usefulness, offering a practical tool for traders seeking to enhance their chart analysis.
This description adheres to TradingView's requirements by providing a detailed explanation of the script's functionality, how it works, and how users can benefit from it.
Volume Gaps and ImbalancesThis Pine script indicator is designed to visually depict price inefficiencies, as identified by Volume Imbalances (VI) or Gaps. A Volume Gap is a scenario where the wicks of two successive candles don’t intersect, while an Imbalance occurs when only the wicks overlap, leaving the bodies apart. These zones of inefficiency frequently act as magnets for price, with the market striving rebalance in accordance with ICT principles.
Relevance:
Volume Gaps/Imbalances are zones of highly inefficient price delivery as per ICT concepts and represent a very strong draw to price. Price will often seek to rebalance those zones to ensure efficient price delivery. Consequently, these zones can provide good targets for entries in the opposite direction or take profit targets for previous entries in the direction of the Gap/Imbalance.
How It Works:
The indicator keeps track of all Gaps/Imbalances from the beginning of the available history. It automatically removes all mitigated Gaps/Imbalances, which are situations where the price has at least reached the bottom of a bullish gap or the top of a bearish gap.
On the last bar, the most recent valid gaps are highlighted with a box drawn from the start to the end of the gap. The start of a bullish gap is determined by the highest price of the previous candle’s open or close, while for bearish gaps, it’s the lowest price of the previous candle’s open or close. Conversely, the end of a bullish gap is the lowest price of the current candle’s open or close, and for bearish gaps, it’s the highest price of the current candle’s open or close.
To enhance the indicator’s speed and minimize chart noise, only the most recent gaps will be displayed, up to the limit set in the indicator settings.
Each displayed VI/GAP will indicate the size of the imbalance in ticks. For imbalances greater than 3 ticks, which represent stronger draws of liquidity, the color transparency will be reduced, and the text will be made more prominent. Volume Gaps are also marked with a 🧲 emoji for easy visual identification.
The indicator will automatically extend the boxes representing valid imbalances to the current bar for as long as the imbalance is not mitigated.
If an imbalance has been tapped, but not mitigated, the indicator will append 🚩emoji to denote that the imbalance has been partially mitigated and may no longer have as strong of a draw for price.
Configurability:
A user may configure the number of imbalances to show, the setting applies to bullish/bearish imbalances individually. This setting can be set to any value from 1 – 50.
Appearance wise, color, style and color transparency of each box representing an imbalance can be configured. The imbalance box label can be configured by setting the text size, along with the vertical & horizontal alignment.
What makes this indicator different:
Designed with high performance in mind, to reduce impact on chart render time.
Only keeps valid imbalances on the chart, with a limit on the # drawn
Indicates the size of the gap and provides visual markets to denote stronger, weaker and partially mitigated gaps

FVG & IFVG ICT [TradingFinder] Inversion Fair Value Gap Signal🔵 Introduction
🟣 Fair Value Gap (FVG)
To spot a Fair Value Gap (FVG) on a chart, you need to perform a detailed candle-by-candle analysis.
Here’s the process :
Focus on Candles with Large Bodies : Identify a candle with a substantial body and examine it alongside the preceding candle.
Check Surrounding Candles : The candles immediately before and after the central candle should have long shadows.
Ensure No Overlap : The bodies of the candles before and after the central candle should not overlap with the body of the central candle.
Determine the FVG Range : The gap between the shadows of the first and third candles forms the FVG range.
🟣 ICT Inversion Fair Value Gap (IFVG)
An ICT Inversion Fair Value Gap, also known as a reverse FVG, is a failed fair value gap where the price does not respect the gap. An IFVG forms when a fair value gap fails to hold the price and the price moves beyond it, breaking the fair value gap.
This marks the initial shift in price momentum. Typically, when the price moves in one direction, it respects the fair value gaps and continues its trend.
However, if a fair value gap is violated, it acts as an inversion fair value gap, indicating the first change in price momentum, potentially leading to a short-term reversal or a subsequent change in direction.
🟣 Bullish Inversion Fair Value Gap (Bullish IFVG)
🟣 Bearish Inversion Fair Value Gap (Bearish IFVG)
🔵 How to Use
🟣 Identify an Inversion Fair Value Gap
To identify an IFVG, you first need to recognize a fair value gap. Just as fair value gaps come in two types, inversion fair value gaps also fall into two categories:
🟣 Bullish Inversion Fair Value Gap
A bullish IFVG is essentially a bearish fair value gap that is invalidated by the price closing above it.
Here’s how to identify it :
Identify a bearish fair value gap.
When the price closes above this bearish fair value gap, it transforms into a bullish inversion fair value gap.
This gap acts as support for the price and drives it upwards, indicating a reduction in sellers' strength and an initial shift in momentum towards buyers.
🟣 Bearish Inversion Fair Value Gap
A bearish IFVG is primarily a bullish fair value gap that fails to hold the price, with the price closing below it.
Here’s how to identify it :
Identify a bullish fair value gap.
When the price closes below this gap, it becomes a bearish inversion fair value gap.
This gap acts as resistance for the price, pushing it downwards. A bearish inversion fair value gap signifies a decrease in buyers' momentum and an increase in sellers' strength.
🔵 Setting
🟣 Global Setting
Show All FVG : If it is turned off, only the last FVG will be displayed.
S how All Inversion FVG : If it is turned off, only the last FVG will be displayed.
FVG and IFVG Validity Period (Bar) : You can specify the maximum time the FVG and the IFVG remains valid based on the number of candles from the origin.
Switching Colors Theme Mode : Three modes "Off", "Light" and "Dark" are included in this parameter. "Light" mode is for color adjustment for use in "Light Mode".
"Dark" mode is for color adjustment for use in "Dark Mode" and "Off" mode turns off the color adjustment function and the input color to the function is the same as the output color.
🟣 Logic Setting
FVG Filter
When utilizing FVG filtering, the number of identified FVG areas undergoes refinement based on a specified algorithm. This process helps to focus on higher quality signals and eliminate noise.
Here are the types of FVG filters available :
Very Aggressive Filter : Introduces an additional condition to the initial criteria. For an upward FVG, the highest price of the last candle must exceed the highest price of the middle candle. Similarly, for a downward FVG, the lowest price of the last candle should be lower than the lowest price of the middle candle. This mode minimally filters out FVGs.
Aggressive Filter : Builds upon the Very Aggressive mode by considering the size of the middle candle. It ensures the middle candle is not too small, thereby eliminating more FVGs compared to the Very Aggressive mode.
Defensive Filter : In addition to the conditions of the Very Aggressive mode, the Defensive mode incorporates criteria regarding the size and structure of the middle candle. It requires the middle candle to have a substantial body, with specific polarity conditions for the second and third candles relative to the first candle's direction. This mode filters out a significant number of FVGs, focusing on higher-quality signals.
Very Defensive Filter : Further refines filtering by adding conditions that the first and third candles should not be small-bodied doji candles. This stringent mode eliminates the majority of FVGs, retaining only the highest quality signals.
Mitigation Level FVG and IFVG : Its inputs are one of "Proximal", "Distal" or "50 % OB" modes, which you can enter according to your needs. The "50 % OB" line is the middle line between distal and proximal.
🟣 Display Setting
Show Bullish FVG : Enables the display of demand-related boxes, which can be toggled on or off.
Show Bearish FVG : Enables the display of supply-related boxes along the path, which can also be toggled on or off.
Show Bullish IFVG : Enables the display of demand-related boxes, which can be toggled on or off.
Show Bearish IFVG : Enables the display of supply-related boxes along the path, which can also be toggled on or off.
🟣 Alert Setting
Alert FVG Mitigation : If you want to receive the alert about FVG's mitigation after setting the alerts, leave this tick on. Otherwise, turn it off.
Alert Inversion FVG Mitigation : If you want to receive the alert about Inversion FVG's mitigation after setting the alerts, leave this tick on. Otherwise, turn it off.
Message Frequency : This parameter, represented as a string, determines the frequency of announcements. Options include: 'All' (triggers the alert every time the function is called), 'Once Per Bar' (triggers the alert only on the first call within the bar), and 'Once Per Bar Close' (activates the alert only during the final script execution of the real-time bar upon closure). The default setting is 'Once per Bar'.
Show Alert time by Time Zone : The date, hour, and minute displayed in alert messages can be configured to reflect any chosen time zone. For instance, if you prefer London time, you should input 'UTC+1'. By default, this input is configured to the 'UTC' time zone.
Display More Info : The 'Display More Info' option provides details regarding the price range of the order blocks (Zone Price), along with the date, hour, and minute. If you prefer not to include this information in the alert message, you should set it to 'Off'.

ICT Balance Price Range [UAlgo]The "ICT Balance Price Range " indicator identifies and visualizes potential balance price ranges (BPRs) on a price chart. These ranges are indicative of periods where the market exhibits balance between bullish and bearish forces, often preceding significant price movements.
🔶 What is Balanced Price Range (BPR) ?
Balanced Price Range is a concept based on Fair Value Gap. Balanced price range (BPR) is the area on price chart where two opposite fair value gaps overlap.
When price approaches the Balanced Price Range (BPR), we assume that the price will react quickly and strongly here. This is because its the combination of two fair value gaps and being a good point of interest for smart money traders.
🔶 Key Features:
Bars to Consider: Determines the number of bars to evaluate for BPR conditions.
Threshold for BPR: Sets the minimum range required for a valid BPR to be identified.
Remove Old BPR: Option to automatically remove invalidated BPRs from the chart.
Bearish/Bullish Box Color: Customizable colors for visual representation of bearish and bullish BPRs.
🔶 Disclaimer
This indicator is provided for educational and informational purposes only.
It should not be considered as financial advice or a recommendation to buy or sell any financial instrument.
The use of this indicator involves inherent risks, and users should employ their own judgment and conduct their own research before making any trading decisions. Past performance is not indicative of future results.
🔷 Related Scripts
Fair Value Gaps (FVG)

RunRox - Backtesting System (ASMC)Introducing RunRox - Backtesting System (ASMC), a specially designed backtesting system built on the robust structure of our Advanced SMC indicator. This innovative tool evaluates various Smart Money Concept (SMC) trading setups and serves as an automatic optimizer, displaying which entry and exit points have historically shown the best results. With cutting-edge technology, RunRox - Backtesting System (ASMC) provides you with effective strategies, maximizing your trading potential and taking your trading to the next level
🟠 HOW OUR BACKTESTING SYSTEM WORKS
Our backtesting system for the Advanced SMC (ASMC) indicator is meticulously designed to provide traders with a thorough analysis of their Smart Money Concept (SMC) strategies. Here’s an overview of how it works:
🔸 Advanced SMC Structure
Our ASMC indicator is built upon an enhanced SMC structure that integrates the Institutional Distribution Model (IDM), precise retracements, and five types of order blocks (CHoCH OB, IDM OB, Local OB, BOS OB, Extreme OB). These components allow for a detailed understanding of market dynamics and the identification of key trading opportunities.
🔸 Data Integration and Analysis
1. Historical Data Testing:
Our system tests various entry and exit points using historical market data.
The ASMC indicator is used to simulate trades based on predefined SMC setups, evaluating their effectiveness over a specified time period.
Traders can select different parameters such as entry points, stop-loss, and take-profit levels to see how these setups would have performed historically.
2. Entry and Exit Events:
The backtester can simulate trades based on 12 different entry events, 14 target events, and 14 stop-loss events, providing a comprehensive testing framework.
It allows for testing with multiple combinations of entry and exit strategies, ensuring a robust evaluation of trading setups.
3. Order Block Sensitivity:
The system uses the sensitivity settings from the ASMC indicator to determine the most relevant order blocks and fair value gaps (FVGs) for entry and exit points.
It distinguishes between different types of order blocks, helping traders identify strong institutional zones versus local zones.
🔸 Optimization Capabilities
1. Auto-Optimizer:
The backtester includes an auto-optimizer feature that evaluates various setups to find those with the best historical performance.
It automatically adjusts parameters to identify the most effective strategies for both trend-following and counter-trend trading.
2. Stop Loss and Take Profit Optimization:
It optimizes stop-loss and take-profit levels by testing different settings and identifying those that provided the best historical results.
This helps traders refine their risk management and maximize potential returns.
3. Trailing Stop Optimization:
The system also optimizes trailing stops, ensuring that traders can maximize their profits by adjusting their stops dynamically as the market moves.
🔸 Comprehensive Reporting
1. Performance Metrics:
The backtesting system provides detailed reports, including key performance metrics such as Net Profit, Win Rate, Profit Factor, and Max Drawdown.
These metrics help traders understand the historical performance of their strategies and make data-driven decisions.
2. Flexible Settings:
Traders can adjust initial balance, commission rates, and risk per trade settings to simulate real-world trading conditions.
The system supports testing with different leverage settings, allowing for realistic assessments even with tight stop-loss levels.
🔸 Conclusion
The RunRox Backtesting System (ASMC) is a powerful tool for traders seeking to validate and optimize their SMC strategies. By leveraging historical data and sophisticated optimization algorithms, it provides insights into the most effective setups, enhancing trading performance and decision-making.
🟠 HERE ARE THE AVAILABLE FEATURES
Historical backtesting for any setup – Select any entry point, exit point, and various stop-loss options to see the results of your setup on historical data.
Auto-optimizer for finding the best setups – The indicator displays settings that have shown the best results historically, providing valuable insights.
Auto-optimizer for counter-trend setups – Discover entry and exit points for counter-trend trading based on historical performance.
Auto-optimizer for stop-loss – The indicator shows stop-loss points that have been most effective historically.
Auto-optimizer for take-profit – The indicator identifies take-profit points that have performed well in historical trading data.
Auto-optimizer for trailing stop – The indicator presents trailing stop settings that have shown the best historical results.
And much more within our indicator, all of which we will cover in this post. Next, we will showcase the possible entry points, targets, and stop-loss options available for testing your strategies
🟠 ENTRY SETTINGS
12 Event Triggers for Trade Entry
Extr. ChoCh OB
Extr. ChoCh FVG
ChoCh
ChoCh OB
ChoCh FVG
IDM OB
IDM FVG
BoS FVG
BoS OB
BoS
Extr. BoS FVG
Extr. BoS OB
3 Trade Direction Options
Long Only: Enter long positions only
Short Only: Enter short positions only
Long and Short: Enter both long and short positions based on trend
3 Levels for Order Block/FVG Entries
Beginning: Enter the trade at the first touch of the Order Block/FVG
Middle: Enter the trade when the middle of the Order Block/FVG is reached
End: Enter the trade upon full filling of the Order Block/FVG
*Three levels work only for Order Blocks and FVG. For trade entries based on BOS or CHoCH, these settings do not apply as these parameters are not available for these types of entries
You can choose any combination of trade entries imaginable.
🟠 TARGET SETTINGS
14 Target Events, Including Fixed % and Fixed RR (Risk/Reward):
Fixed - % change in price
Fixed RR - Risk Reward per trade
Extr. ChoCh OB
Extr. ChoCh FVG
ChoCh
ChoCh OB
ChoCh FVG
IDM OB
IDM FVG
BoS FVG
BoS OB
BoS
Extr. BoS FVG
Extr. BoS OB
3 Levels of Order Block/FVG for Target
Beginning: Close the trade at the first touch of your target.
Middle: Close the trade at the midpoint of your chosen target.
End: Close the trade when your target is fully filled.
Customizable Parameters
Easily set your Fixed % and Fixed RR targets with a user-friendly input field. This field works only for the Fixed and Fixed RR entry parameters. When selecting a different entry point, this field is ignored
Choose any combination of target events to suit your trading strategy.
🟠 STOPLOSS SETTINGS
14 Possible StopLoss Events Including Entry Orderblock/FVG
Fixed - Fix the loss on the trade when the price moves by N%
Entry Block
Extr. ChoCh OB
Extr. ChoCh FVG
ChoCh
ChoCh OB
ChoCh FVG
IDM OB
IDM FVG
BoS FVG
BoS OB
BoS
Extr. BoS FVG
Extr. BoS OB
3 Levels for Order Blocks/FVG Exits
Beginning: Exit the trade at the first touch of the order block/FVG.
Middle: Exit the trade at the middle of the order block/FVG.
End: Exit the trade at the full completion of the order block/FVG.
Dedicated Field for Setting Fixed % Value
Set a fixed % value in a dedicated field for the Fixed parameter. This field works only for the Fixed parameter. When selecting other exit parameters, this field is ignored.
🟠 ADDITIONAL SETTINGS
Trailing Stop, %
Set a Trailing Stop as a percentage of your trade to potentially increase profit based on historical data.
Move SL to Breakeven, bars
Move your StopLoss to breakeven after exiting the entry zone for a specified number of bars. This can enhance your potential WinRate based on historical performance.
Skip trade if RR less than
This feature allows you to skip trades where the potential Risk-to-Reward ratio is less than the number set in this field.
🟠 EXAMPLE OF MANUAL SETUP
For example, let me show you how it works on the chart. You select entry parameters, stop loss parameters, and take profit parameters for your trades, and the strategy automatically tests this setup on historical data, allowing you to see the results of this strategy.
In the screenshot above, the parameters were as follows:
Trade Entry: CHoCH OB (Beginning)
Stop Loss: Entry Block
Take Profit: Break of BOS
The indicator will automatically test all possible trades on the chart and display the results for this setup.
🟠 AUTO OPTIMIZATION SETTINGS
In the screenshot above, you can see the optimization table displaying various entry points, exits, and stop-loss settings, along with their historical performance results and other parameters. This feature allows you to identify trading setups that have shown the best historical outcomes.
This functionality will enhance your trading approach, providing you with valuable insights based on historical data. You’ll be aware of the Smart Money Concept settings that have historically worked best for any specific chart and timeframe.
Our indicator includes various optimization options designed to help you find the most effective settings based on historical data. There are 5 optimization modes, each offering unique benefits for every trader
Trend Entry - Optimization of the best settings for trend-following trades. The strategy will enter trades only in the direction of the trend. If the trend is upward, it will look for long entry points and vice versa.
Counter Trend Entry - Finding setups against the trend. If the trend is upward, the script will search for short entry points. This is the opposite of trend entry optimization.
Stop Loss - Identifying stop-loss points that showed the best historical performance for the specific setup you have configured. This helps in finding effective exit points to minimize losses.
Take Profit - Determining targets for the configured setup based on historical performance, helping to identify potentially profitable take profit levels.
Trailing Stop - Finding optimal percentages for the trailing stop function based on historical data, which can potentially increase the profit of your trades.
Ability to set parameters for auto-optimization within a specified range. For example, if you choose FixRR TP from 1 to 10, the indicator will automatically test all possible Risk Reward Take Profit variations from 1 to 10 and display the results for each parameter individually.
Ability to set initial deposit parameters, position commissions, and risk per trade as a fixed percentage or fixed amount. Additionally, you can set the maximum leverage for a trade.
There are times when the stop loss is very close to the entry point, and adhering to the risk per trade values set in the settings may not allow for such a loss in any situation. That’s why we added the ability to set the maximum possible leverage, allowing you to test your trading strategy even with very tight stop losses.
Duplicated Smart Money Structure settings from our Advanced SMC indicator that you can adjust to match your trading style flexibly. All these settings will be taken into account during the optimization process or when manually calculating settings.
Additionally, you can test your strategy based on higher timeframe order blocks. For example, you can test a strategy on a 1-minute chart while displaying order blocks from a 15-minute timeframe. The auto-optimizer will consider all these parameters, including higher timeframe order blocks, and will enter trades based on these order blocks.
Highly flexible dashboard and results optimization settings allow you to display the tables you need and sort results by six different criteria: Profit Factor, Profit, Winrate, Max Drawdown, Wins, and Trades. This enables you to find the exact setup you desire, based on these comprehensive data points.
🟠 ALERT CUSTOMIZATION
With this indicator, you can set up buy and sell alerts based on the test results, allowing you to create a comprehensive trading strategy. This feature enables you to receive real-time signals, making it a powerful tool for implementing your trading strategies.
🟠 STRATEGY PROPERTIES
For backtesting, we used realistic initial data for entering trades, such as:
Starting balance: $1000
Commission: 0.01%
Risk per trade: 1%
To ensure realistic data, we used the above settings. We offer two methods for calculating your order size, and in our case, we used a 1% risk per trade. Here’s what it means:
Risk per trade: This is the maximum loss from your deposit if the trade goes against you. The trade volume can change depending on your stop-loss distance from the entry point. Here’s the formula we use to calculate the possible volume for a single trade:
1. quantity = percentage_risk * balance / loss_per_1_contract (incl. fee)
Then, we calculate the maximum allowed volume based on the specified maximum leverage:
2. max_quantity = maxLeverage * balance / entry_price
3. If quantity < max_quantity, meaning the leverage is less than the maximum allowed, we keep quantity. If quantity > max_quantity, we use max_quantity (the maximum allowed volume according to the set leverage).
This way, depending on the stop-loss distance, the position size can vary and be up to 100% of your deposit, but the loss in each trade will not exceed the set percentage, which in our case is 1% for this backtest. This is a standard risk calculation method based on your stop-loss distance.
🔸 Statistical Significance of Trade Data
In our strategy, you may notice there weren’t enough trades to form statistically significant data. This is inherent to the Smart Money Concept (SMC) strategy, where the focus is not on the number of trades but rather on the risk-to-reward ratio per trade. In SMC strategies, it’s crucial to avoid taking numerous uncertain setups and instead perform a comprehensive analysis of the market situation.
Therefore, our strategy results show fewer than 100 trades. It’s important to understand that this small sample size isn’t statistically significant and shouldn’t be relied upon for strategy analysis. Backtesting with a small number of trades should not be used to draw conclusions about the effectiveness of a strategy.
🔸 Versatile Use Cases
The methods of using this indicator are numerous, ranging from identifying potentially the best-performing order blocks on the chart to creating a comprehensive trading strategy based on the data provided by our indicator. We believe that every trader will find a valuable application for this tool, enhancing their entry and exit points in trades.
Disclaimer
Past performance is not indicative of future results. The results shown by this indicator do not guarantee similar outcomes in the future. Use this tool as part of a comprehensive trading strategy, considering all market conditions and risks.
How to access
For access to this indicator, please read the author’s instructions below this post

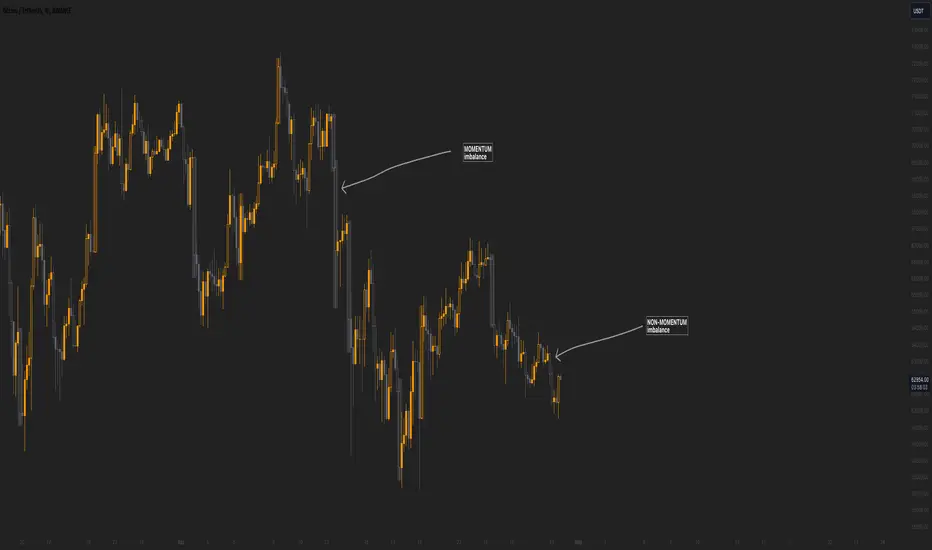
Momentum imbalance (internal liquidity) by CUWe have developed a sophisticated indicator to detect momentum, imbalance, and internal liquidity within financial markets. Designed to leverage real-time data analysis, this tool aims to assist traders in making more informed decisions.
The momentum component of the indicator calculates the rate at which prices move. By measuring price changes over a specific period, the indicator can show whether an asset is likely to continue rising or falling. This helps traders identify when a trend is gaining strength or beginning to wane.
Market imbalance is analyzed by observing the disparity in buy and sell orders. Our indicator identifies significant deviations between supply and demand, which can indicate potential turning points or accelerations in market movement. This aspect is crucial for understanding the underlying forces that influence price changes.
Regarding internal liquidity, our indicator measures the market depth and the availability of liquid assets. This component is essential for assessing how easily assets can be bought or sold without significantly impacting the price. High internal liquidity indicates a healthy market where transactions are executed quickly and efficiently, while low liquidity can lead to increased volatility and potential price manipulation.
By integrating these three components, our indicator provides a holistic view of market dynamics, enabling traders to operate more strategically and with greater confidence.
Fair Value Gaps (FVG) [UAlgo]A fair value gap is especially popular among price action traders and occurs when there are inefficiencies or imbalances in the market, or when the buying and selling are not equal. Fair value gaps can become a magnet for the price before continuing in the same direction.
🔶 Key Features :
Fair Value Gap Identification:
Bullish fair value gaps occur when the current market price exceeds the previous high. The indicator identifies bullish gaps by comparing the low of the current candle with the high of the candle two candles ago . If the low of the current candle is higher than the high two candles ago and the closing price of the previous candle is also higher than the high two candles ago, a bullish fair value gap is detected.
Bearish fair value gaps occur when the current market price falls below the previous low. The indicator identifies bearish gaps by comparing the high of the current candle with the low of the candle two candles ago. If the high of the current candle is lower than the low two periods ago and the closing price of the previous candle is also lower than the low two candles ago, a bearish fair value gap is detected.
Fair Value Gap Filter :
ATR measures market volatility by analyzing the range of price movements over a specified period. It provides insights into the average price range that a security experiences within a given timeframe. After the ATR is calculated, a Simple Moving Average (SMA) is computed for the ATR values. This moving average smoothens out the ATR data, providing a clearer indication of the average volatility levels over time.
When the filter is active, fair value gaps are identified only if they occur during periods of relatively higher volatility, as indicated by the ATR being greater than the SMA. This helps in refining and obtaining the detection of stronger fair value gaps
An example with FVG filtering off:
An example with FVG filtering on:
Customizable Settings: Users have the flexibility to customize various parameters to suit their trading preferences. They can adjust settings such as the number of fair value gaps displayed, mitigation method (either based on closing prices or wicks), and apply filters based on Average True Range (ATR) to refine gap detection.
🔶 Disclaimer :
Use with Caution: Trading involves significant risk, and this indicator should be used with caution. While it can help identify potential trading opportunities, it does not guarantee profits and may sometimes provide false signals.
Not Financial Advice: The information provided by the Fair Value Gaps indicator is for educational and informational purposes only and should not be considered as financial advice. Traders should conduct their own research and consult with financial professionals before making any trading decisions.
Past Performance: Past performance is not indicative of future results. Historical price movements analyzed by the indicator may not accurately predict future market behavior.

Market Structure (Range) & Internal Liquidity
This indicator will simplify the price-action reading of any trader/investor by decluttering his/her charts from un-important & confusing candles to highlight the true momentum candles which are usually formed by institutional buying/selling .
The indicator will be a good tool in the arsenal of the following styles of Trading/Investing
Smart Money / Liquidity Concepts
Price Action Concepts
Demand & Supply Concepts
Support & Resistance Concepts
UNIQUE FEATURES:
1. Market Structure - Range & Internal Liquidity:
Unlike other liquidity indicators, this indicator only highlights liquidity levels of significant importance. Not every intermediate high & low in a chart are worthy of noticing, hence by enabling the 'Swings' & 'Range (BoS)' feature in the indicator settings, the structure highs and lows (external liquidity) in a chart can be identified.
Any other liquidity levels within a market range (Range between structural High & Low) is known as internal liquidity which price targets to collect enough orders before heading towards the external liquidity levels.
2. Gaps (Fair Value Gaps / Imbalance):
Not every imbalance / gap between candles are important & trade-worthy. This feature of the indicator is different from the other widely available imbalance indicators & only highlights gaps formed by true momentum candles. Gaps between unimportant inside bars are not highlighted, as these bars occur in the absence of momentum.
3. True Price Action:
Looking at the two charts below, we can clearly observe the difference between price action of a confusing normal chart & the simplified price action highlighted by the indicator. This feature declutters the charts by only highlighting the candles a trader / investor should notice in a chart.
This feature when used in confluence with the liquidity levels feature & gap feature of the indicator, helps identify the true demand & supply zones (order blocks) in a chart.
Before
After
4. Zig Zag Lines:
This unique feature which is useful to Identify & Backtest different entry types taught by Smart Money Traders . This feature helps the trader understand the True Fractal Nature of price. This can also be seen as an alternate to the default line chart feature.
Examples of Entry Types taken by Smart Money Traders
ADDITIONAL FEATURES:
(These features are essential addons to trade liquidity. However, these are derived from publicly available indicators from the Tradingview library, but with a different interpretation for a better visualization of charts & or to time better trade entries without cluttering the charts)
a. Inside Bar & Outside Bars:
Identify not just a single Inside Bar as highlighted by other indicators, but to highlight a series of candles which are within a master candle range and are exhibiting unimportant sideways price action.
Outside Bars only relevant to momentum candles are highlighted, ignoring candles that occur within a master candle range. Highs & Lows of such Outside Bars are used by aggressive traders to identify liquidity levels in the charts.
b. Highs & Lows of previous Monthly / Weekly / Daily & Hourly Candles:
This feature draws Highs & Lows of previous Monthly / Weekly / Daily & Hourly Candles on the extreme right hand side of the chart to keep the charts clean.
Additionally for Hourly time frame, the indicator includes a setting to select the hourly candle time frame (60 min / 75 min / 240 min), which are personal and different for each trader.
UNDERLYING CONCEPT:
In the image below we see how a large majority of Traders / Investors incorrectly mark Structure markings, mistaking a raid of internal liquidity as a Break of Structure, thereby taking trades opposite to the broader trend of the markets
However, this indicator has a higher accuracy of identifying the correct price structure by only marking a structure high or low, when a subsequently opposite side liquidity is taken/raided. Further the broader trend of the markets can be easily identified by looking as to which side the Break of Structure has happened. (This is visible in the indicator in the form of 'Range' feature, so if a Range High is broken then it is understood to be in an uptrend & vice versa)
The underlying core functionality of the indicator is best displayed by the image below
USECASE OF THE INDICATOR:
Before taking any Buying/Selling position in the markets, a Trader / Investor must analyze the price action on the following parameters
HTF & LTF Trend Identification (To judge if trade is Pro-Trend or Counter-Trend)
Is Price at a High Probability Area of Interest?
Is Price satisfying the trade entry conditions?
Let us see how this indicator can be used as a complete trading system in itself and addresses each of the above parameters
Disclaimer: Illustrations shown below are just for understanding the features of the indicator & does not guarantee profitability. Every trader must back test their setups to arrive at a setup with an edge (positive expectancy) before they start actively trading the setup.
1. HTF & LTF Trend Identification (Pro-Trend / Counter-Trend) using 'Range (BoS)' feature of the indicator
Let's assume a Day Trader, uses hourly chart (75 min) to frame his Higher Time Frame (HTF) ideas & 15min charts (LTF) for trade entries
Looking at the chart below the Trader concludes that the HTF has most recently broken the structure to the downside and is considered Bearish till price action is below the range high of 48600 levels. It can also be concluded that the price is currently in a Bullish retracement.
The Trader can choose to take both Pro-Trend or Counter-Trend Trades, timing the trade entries using the LTF charts.
Looking at the LTF chart below, it is evident that price on LTF has also broken structure to the downside and is now aligned with the HTF Bearish Trend. The Trader will now look to get into short trades, to take trades both in line with HTF & LTF trend.
2. Let's identify if Price is at a High Probability Area of Interest, using either single or combination of the 'Swings' / 'Gaps' / 'Outside Bars' / 'HL of previous M,W,D, H candles' features of the indicator
Definition of High Probability Level / Area differs from each Traders perspective depending upon which of the Trading Styles (mentioned in the beginning) does one use.
Smart Money Traders
SMC Traders are known to get into trades early and their high R:R trades are taken mostly at a High Probability Area of Interest which are identified by them on HTF, by looking for candles with imbalance (gaps) & or candles which have taken out a previous liquidity and then having creating imbalance (gaps).
Also Turtle Soups is one of the favorite setups for SMC traders, where a trader enters a trade on LTF (typically 1 min/3min & 5min) after grabbing HTF liquidity lying at H/L of outside bar / previous monthly, weekly, daily or hourly candles.
Demand & Supply Traders
Some of the Best Demand & Supply Traders have the patience to wait for trades and take trades at the extreme Demand & Supply Zones within a market Range.
As illustrated below, the extreme hourly supply zone just below the structure high, which has the confluence of imbalance and Bearish HTF confirmation resulted in a good R:R trade.
Price Action Traders & Support & Resistance Traders
From the illustration below we can see how the 15 min Range breakdown confirms the breakdown of the Inverted Cup Pattern for Price Action Traders & Support & Resistance Traders using the same area of breakdown as the new Resistance to enter Short trades
3. Let's identify if Price is satisfying the Trade Entry Conditions using the 'Zig-Zag Lines' feature
Statistics say that majority (> 80%) of Traders blow up their accounts multiple times or completely give up and never achieve profitability.
One of the primary reasons for this is Traders punching trades randomly and without having proper Setup or rules for entering Trades.
Also in order to arrive at rules or execute the different entry models (couple of examples highlighted earlier) taught by different Trainers, a Trader needs to learn to visualize charts in a similar format to what the trainers are teaching.
The Zig-Zag lines feature is a form of line chart that joins the swing high points to the swing low points on the chart to represent the True Price action & a proper fractal nature of the markets, unlike the line chart which is formed by only by joining the closing value of each candle.
From the image below we can see that the Zig-Zag lines feature eliminates the randomness visible in the line chart and is a more smoother chart. Using this feature one can back test the various entry models widely available on the internet or arrive at a user specific model which he/she is comfortable with.
CONCLUSION:
Trading with a deeper understanding of Price Action allows a Trader/Investor to enter or exit trades with ease. Price Action trading allows individuals to keep their charts clean and stay away from the other lagging technical indicators and enter trades much earlier than other technical indicators.
This indicator attempts in simplifying the understanding of price action for every one and identify potential high probability areas / levels where one should enter / exit trades.
This indicator will be an important tool in the arsenal of any Trader / Investor to take better informed trades, however it does not guarantee profitability of a Trader, due to the randomness of the markets & external factors that influence each trader.
GET ACCESS:
Refer Author's instructions below to get access to the indicator

Fair Value Gaps Mitigation Oscillator [LuxAlgo]The Fair Value Gaps Mitigation Oscillator is an oscillator based on the traditional Fair Value Gaps (FVGs) imbalances. The oscillator displays the current total un-mitigated values for the number of FVGs chosen by the user.
The indicator also displays each New FVG as a bar representing the current ratio of the New FVG in relation to the current un-mitigated total for its direction.
🔶 USAGE
When an FVG forms, it is often interpreted as strong market sentiment in the direction of the gap. For example, an upward FVG during an uptrend is typically seen as a confirmation of the strength and continuation of the trend, as it indicates that buyers are willing to purchase at higher prices without much resistance, suggesting strong demand and positive sentiment.
By analyzing the mitigation (or lack thereof), we can visualize the increase of directional strength in a trend. This is where the proposed oscillator is useful.
🔶 DETAILS
The oscillator's values are expressed as Percentages (%). Each FVG is allocated 100% of the total of its width with a max potential value of 100 and minimum potential value of 0.
Based on the "FVG Lookback" Input, the FVGs are scaled to fit within the range of +1 to -1. Using a higher "FVG Lookback" value will allow you to get indications of longer-term trends.
A higher value of the normalized bullish FVG areas suggest a stronger and cleaner uptrend, while lower values of the bearish the normalized bullish FVG areas suggest a stronger and cleaner downtrend.
+1 or -1 indicates that there is a Full Lookback of FVGs, and each one is fully un-mitigated, and the opposite direction of FVGs is entirely Mitigated.
When the price closes over/under or within an FVG it begins to get mitigated, when this happens the % of mitigation is subtracted from the total.
When a New FVG is formed, a Histogram bar is created representing the ratio of the current FVG's width to the total width off all un-mitigated FVGs.
The entire bar represents 100% of total un-mitigated FVG Width.
The filled area represents the current FVG's width relative to the whole.
A 50% hash mark is also displayed for reference.
🔶 SETTINGS
FVG Lookback - Determines the number of FVGs (Bullish and Bearish Pairs) to keep in memory for analysis.

Implied Orderblock Breaker (Zeiierman)█ Overview
The Implied Order Block Breaker (Zeiierman) is a tool designed to identify enhanced order blocks with imbalances. These enhanced order blocks represent areas where there is a rapid price movement. Essentially, this indicator uses order blocks and suggests that a swift price movement away from these levels, breaking the current market structure, could indicate an area that the market has not correctly valued. This technique offers traders a unique method to identify potential market inefficiencies and imbalances, serving as a guide for potential price revisits.
The indicator doesn't scan for imbalances in the traditional sense — where there's an absence of trades between two price levels — but instead, it identifies quick movements away from key levels that suggest where an imbalance might exist. Relying on crossovers and cross-unders in conjunction with pivot points and examining the high/low within the same period provides an innovative method for traders to spot these potentially undervalued or overvalued areas in the market. These inferred imbalances can be crucial for traders looking for price levels where the market might make significant moves.
█ How It Works
Bullish
Crossover: The closing price of a bar crosses above a pivot high, which is an indication that buyers are in control and pushing the price upwards.
New Low Within Period: There is a lower low within the same period as the pivot high. This suggests that after setting a high, the market pulled back to set a new low, potentially leaving a price gap on the way up as the price quickly recovers.
Bearish
Crossunder: The closing price of a bar crosses under a pivot low, indicating that sellers are taking control and driving the price down.
New High Within Period: There is a higher high within the same period as the pivot low. This condition suggests that the market rallied to a new high before falling back below the pivot low, potentially leaving a gap on the way down.
█ How to Use
The enhanced order blocks are often revisited, and the price may aim to 'fill' the potential imbalance created by the rapid price movement, thereby presenting traders with potential entry or exit points. This approach aligns with the idea that imbalances are frequently revisited by the market, and when combined with the context of Order Blocks, it provides even more confluence.
Example
Here, if the price drops rapidly after setting a new high—crossing under the pivot low—it may skip over certain price levels, creating a 'gap' that signifies an area where the price might have been overvalued (imbalance), which the market may revisit for a potential price correction or revaluation.
█ Settings
Period: Determines the number of bars used for identifying pivot highs and lows. A higher value gives more significant but less frequent signals, while a lower value increases sensitivity but might give more false positives.
Pivot Surrounding: Specifies the number of candles to analyze around a pivot point. Increasing this value broadens the analysis range, potentially capturing more setups but possibly including less significant ones.
-----------------
Disclaimer
The information contained in my Scripts/Indicators/Ideas/Algos/Systems does not constitute financial advice or a solicitation to buy or sell any securities of any type. I will not accept liability for any loss or damage, including without limitation any loss of profit, which may arise directly or indirectly from the use of or reliance on such information.
All investments involve risk, and the past performance of a security, industry, sector, market, financial product, trading strategy, backtest, or individual's trading does not guarantee future results or returns. Investors are fully responsible for any investment decisions they make. Such decisions should be based solely on an evaluation of their financial circumstances, investment objectives, risk tolerance, and liquidity needs.
My Scripts/Indicators/Ideas/Algos/Systems are only for educational purposes!

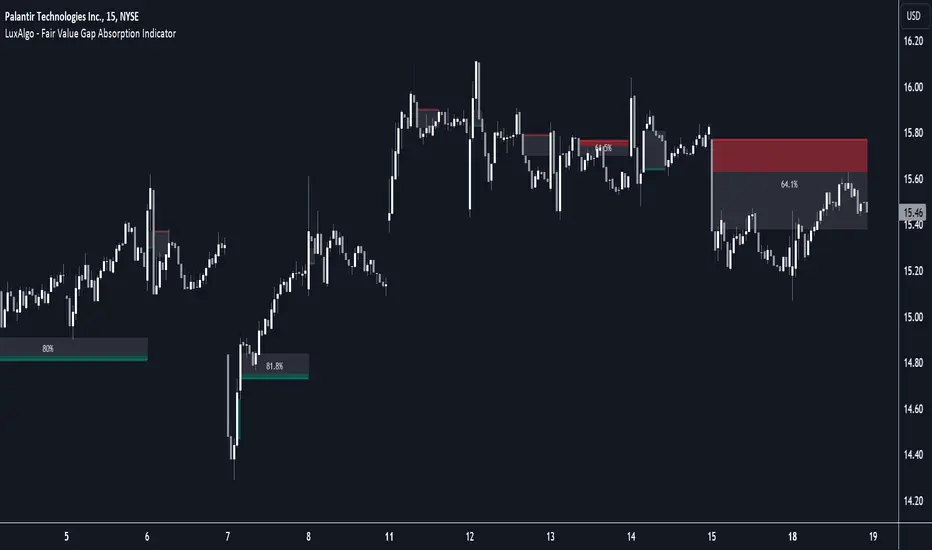
Fair Value Gap Absorption Indicator [LuxAlgo]The Fair Value Gap Absorption Indicator aims to detect fair value gap imbalances and tracks the mitigation status of the detected fair value gap by highlighting the mitigation level till a new fair value gap is detected.
The Fair Value Gap (FVG) is a widely utilized tool among price action traders to detect market inefficiencies or imbalances. These imbalances arise when buying or selling pressure is significant, resulting in a large upward or downward move, leaving behind an imbalance in the market.
🔶 USAGE
A fair value gap appears in a triple-candle pattern when there is a large candle whose previous candle’s high and subsequent candle’s low do not fully overlap the large candle. The space between these wicks is known as the fair value gap.
Price can come back to these imbalance areas and mitigate them, however, this is sometimes a process involving multiple bars, the displayed imbalances by the indicator allow tracking the current mitigation level of a displayed imbalance.
Fair value gaps can become a magnet for the price before continuing in the same direction. Traders commonly wait for the price to revert toward the fair value gap to clear out the imbalance before continuing to move toward the prevailing trend.
🔶 SETTINGS
🔹Fair Value Gaps
Fair Value Gap Width Filter: defines the filtering multiplier, please refer to the tooltip of the input option for further details.
Bullish, Imbalance and Mitigation: color customization option.
Bearish, Imbalance and Mitigation: color customization option.
Display Percentage of Mitigation: Display the percentage of the mitigation areas.
Historical Fair Value Gaps: toggles the visibility of the historical fair value gaps.
🔶 LIMITATIONS
Please note that filtering cannot be applied for the first 144 (atr fixed-length) candles since the atr value won't be present that is used for filtering.
🔶 RELATED SCRIPTS
Fair-Value-Gap
HTF-Fair-Value-Gap
Liquidity-Voids-FVG
Imbalance indicator (Multi-TimeFrame)(USA) Imbalance Indicator (Multi-TimeFrame) is an indicator designed to visualize the imbalance between two adjacent candles on a chart by drawing rectangles. It helps identify the dominance of buyers or sellers during the price's impulsive movement in an uptrend or downtrend.
Here's how the indicator works:
It determines the trend direction (up or down) based on the closing prices of the last three candles. An uptrend is identified if all three candles closed above their openings, and a downtrend if they closed below.
Depending on the trend direction, the indicator calculates the imbalance between candles. The imbalance is expressed as the difference between the low of the next candle and the high of the previous candle for an uptrend or the low of the previous candle and the high of the next candle for a downtrend. The imbalance value should be greater than 0.
When an imbalance is detected, the indicator draws a rectangle on the chart. The rectangle starts at the candle with the detected imbalance, the upper border is at the top of the imbalance, and the lower border is at the bottom of the imbalance.
The color of the rectangle depends on the trend direction: green for an uptrend and red for a downtrend.
The rectangle continues dynamically to the right until it is intersected by the next candles by 50% or more (by default). The intersection can occur in various combinations (shadow, body, or shadow + body of the candle). Once this happens, the rectangle ends on the last overlapping candle. The height overlap percentage is adjustable in the range of 1 to 100, with a default value of 50%.
Use the Imbalance Indicator to identify potential price reversal zones. Algorithms aim to cover the imbalance and trade the range in which it formed, representing a potential magnet for the price.
In the multi-timeframe version of the indicator, along with the current timeframe, rectangles from timeframes: 15 minutes, 1 hour, 4 hours, and 1 day are displayed by default (and can be adjusted in settings). Other timeframes (e.g., 1 week and 1 month or 30 minutes) can be selected in the settings.
You can activate/deactivate the display of imbalances from different timeframes of your choice by setting the corresponding checkbox.
Additionally, rectangles from different timeframes have different default levels of transparency, decreasing with increasing timeframe.
Frames on additional timeframes are disabled by default in transparency settings; adjust as needed in color settings.
Like in the previous version, you can customize the color scheme of rectangles for each timeframe individually.
Information display about timeframes other than the current one on imbalances is available and can be disabled in settings for each timeframe individually.
For your convenience, in the buyers' interest zone, a label is placed at 50% of the rectangle's width, spanning 3 candles. Now you can set a limit order right at the label without relying on Fibonacci retracements.
(RUS) Imbalance indicator (Multi-TimeFrame) - это индикатор, предназначенный для визуализации имбаланса между двумя соседними свечами на графике путем рисования прямоугольников. Он помогает определить доминирование покупателей или продавцов во время импульсного движение цены на восходящем или нисходящем тренде.
Вот как работает индикатор:
Он определяет направление тренда (вверх или вниз) на основе закрытия последних трех свечей. Тренд вверх определяется, если все три свечи закрылись выше своих открытий, а тренд вниз - если ниже.
В зависимости от направления тренда, индикатор вычисляет имбаланс между свечами. Имбаланс выражается в виде разницы между низом следующей свечи и верхом предыдущей свечи для восходящего тренда или между низом предыдущей свечи и верхом следующей свечи для нисходящего тренда. Значение имбаланса должно быть больше 0.
Если имбаланс обнаружен, индикатор рисует прямоугольник на графике. Прямоугольник начинается на свече с найденным имбалансом, верхняя граница прямоугольника находится на верхней границе имбаланса, а нижняя граница - на нижней границе имбаланса.
Цвет прямоугольника зависит от направления тренда: зеленый для восходящего тренда и красный для нисходящего тренда.
Прямоугольник продолжается вправо динамически, пока его не пересекут следующие свечи на 50% или более (по умолчанию). Пересечение может произойти различными комбинациями (тень, тело или тень + тело свечи). Как только это происходит, прямоугольник заканчивается на последней перекрывающей его свече. Процент перекрытия по высоте настраивается в интервале от 1 до 100, по умолчанию значение 50%.
Используйте Imbalance Indicator для определения зон вероятного возврата цены. Алгоритмы стремятся перекрыть имбаланс и проторговать диапазон, в котором он образовался, это потенциальный магнит для цены.
В мульти-таймфреймной версии индикатора, наряду с текущим таймфреймом, при первом запуске (и до момента, пока вы не измените это в настройках), отображаются прямоугольники с таймфреймов:
15 минут,
1 час,
4 часа,
1 день.
При этом другие таймфреймы (например 1 неделя и 1 месяц или 30 минут) можно выбрать в настройках.
Вы можете активировать/деактивировать отображение имбалансов с разных таймфреймов по вашему выбору, установив соответствующую галочку.
Кроме того, прямоугольники с разных таймфреймов по умолчанию имеют различную степень прозрачности, которая уменьшается по мере увеличения таймфрейма
Рамки на дополнительных таймфреймах, по умолчанию отключены настройками прозрачности, при необходимости измените это в настройках цвета.
Как и в предыдущей версии, вы можете настраивать под себя цветовую схему прямоугольников, причём для каждого таймфрейма в отдельности.
На имбалансах с отличных от текущего таймфреймов, доступно отображение информации о таймфрейме, данная опция отключается в настройках для каждого таймфрейма в отдельности.
Для вашего удобства, в зоне интереса покупателей, на 50% прямоугольника сделана метка шириною в 3 свечи, теперь не нужно натигивать фибо, можете сразу выставить лимитку по метке.

Footprint Chart + Volume ProfileFootprint charts provide volume information to candlestick charts. This indicator specifically provides the quantity of Market Orders executed on each side of the Order Book, thereby showing you the number of contracts that had hit the bid or the offer - and it does so on each bar.
In addition, it visualises a Volume Profile for each bar, providing you an even better visualisation, contrasted to that which renders the numbers alone.
This Footprint Chart calculates executed orders by getting the change in volume for every price move and pooling them on their corresponding "tick bucket". Their specific "tick bucket" is calculated on the nearest "tick", the size of which you will provide by setting the "Tick Size/ Increment" to whichever tick size you need .
For instance, volume changes on a price of 10.4 on a 1 tick Footprint Chart will be recorded as part of the nearest whole number(10), while on a 3 tick Footprint Chart, it will be recorded as part of 9 as it is the nearest multiple of 3.
Calculating the "tick bucket" this way is most conservative, however, if you would like it calculated differently — Having the volume changes recorded on the succeeding tick, e.g. Recording 10.4 as 12 on a 3 tick Footprint Chart. Simply set the "Tick Basket Assignment" to "Next Tick", While setting the same to "Previous Tick" records volume changes on the preceding tick. Default is "Nearest Tick".
How to read the Footprint Chart?
This Footprint Chart depicts a portion of the Depth of Market, arranged in such a way that the left side represents the bid, while the right side represents the ask. It is therefore natural that orders hitting the bid (Market Sells) are to be placed on the Left Side of the chart while orders hitting the ask (Market Buys) are to be placed on the Right Side. This way, you can visualise how the current price came to be, as well as observe with the several order flow analysis concepts and ideas you can apply. In summary, numbers on the Left represents Sell Orders and numbers on the Right represents Buy Orders.
If, however, you wish to see only the total volume that transacted within the bar, you may do so by toggling the "Split Buy and Sell" option.
Footprint Chart showing only the total volume:
Furthermore, this chart has its own candles, the width of which can be adjusted accordingly.
Volume Profile
This Footprint Chart offers a Stacked Volume Profile and an Unstacked Volume Profile, the former renders a Volume Profile which compares the buys from the sells, the better to visualise levels of activity, the latter renders a standard Volume Profile which shows the total volume that transacted on a price tick.
The type of Volume Profile that this Footprint Chart renders is similar to that of a Periodic Volume Profile, which renders Volume Profiles for every bar on the chart. Furthermore, the width of each Volume Profile bar of this Footprint Chart is relative to the largest volume transacted on the current session, the session beginning from the point you have opened the Footprint Chart until the 500th bar, capped for optimisational purposes, and shall adjust the session start accordingly once this limit had been reached. The Volume Profile bars' width will therefore change agreeably to each significant volume update, and sized relatively with that of the others.
Optimisation
This Footprint Chart utilises several drawings and calculations for attaining its visuals, the arrangement of which makes it more pleasing and easier to understand. Several optimisations have been implemented within the code, e.g. utilising queues, however, if you wish for it to be even more optimised, you can use an "Unstacked" Volume Profile, using larger tick sizes, as well as using 0 decimal placements for the Footprint Chart.
Furthermore, deselecting "Use Stacked Bars" will allow more boxes to be drawn, and will double the amount of boxes the volume profile can use.
Limitations
No historical tick data have yet been made available for use and so this Footprint Chart only has realtime data at its disposal. Historical footprints are therefore not rendered, the boundary of which is delineated by a vertical broken line.
Tips
This Footprint Chart is best viewed on a chart of its own, and it is therefore ideal to clear the chart of other candles by hiding them or utilising a line chart alternatively . In addition, stretch the time scale to its utmost capacity, the better to see properly the Volume Profile, as well as stretch the price scale to a proper height, the better to read the footprint volumes inscribed on the indicator.
Warnings
Changing settings may cause the Footprint Chart to reset. If, in case you have been accumulating Footprint Charts and wish to change some settings for the benefit of your charting, it is best to take a snapshot of your chart prior, for recent changes may cause resets to occur.

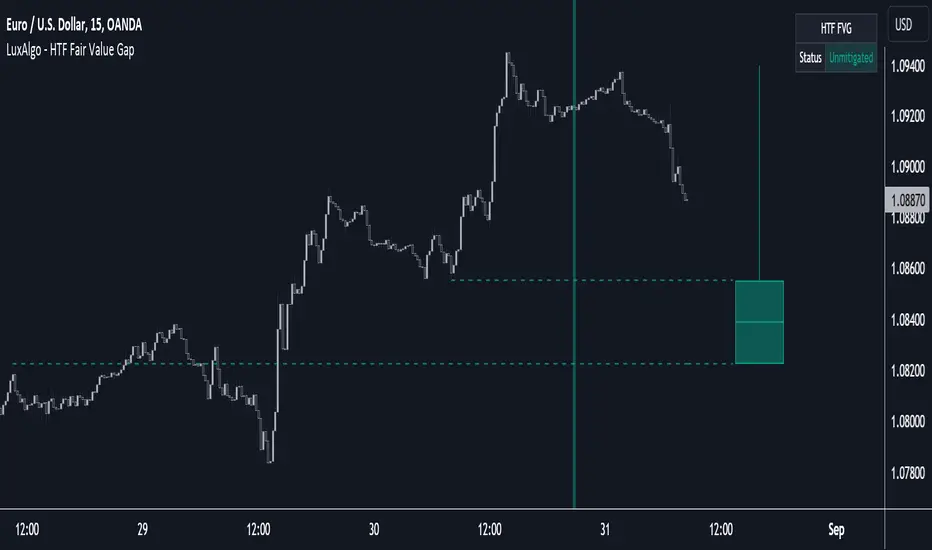
HTF Fair Value Gap [LuxAlgo]The HTF Fair Value Gap indicator aims to display the exact time/price locations of fair value gaps within a higher user-selected chart timeframe.
🔶 USAGE
The indicator can be used to detect higher time frame fair value gaps. Detected historical HTF FVG are displayed as changes in chart background colors, with a green color indicating a bullish FVG and red a bearish FVG.
The most recent HTF FVG is displayed as a candle to the right of the most recent price candle. Dashed lines indicate the exact location of the FVG upper and lower extremities.
The wicks of the FVG candle indicate the price deviation from the FVG extremities after its formation and can help determine where the FVG is located within a trend.
A "Status" dashboard is included to indicate if the FVG is mitigated or not. This is also indicated by the border of the FVG candle, with a solid border indicating an unmitigated FVG.
🔶 SETTINGS
Timeframe: Chart timeframe used to retrieve the fair value gaps
🔹 Style
Offset: Offset to the right (in bars) of the FVG candle from the most recent bar.
Width: Width (in bars) of the FVG candle.
🔹 Dashboard
Show Dashboard: Determine whether to display the dashboard or not.
Location: Location of the dashboard on the chart.
Size: Size of the dashboard on the chart.
Liquidity Levels/Voids (VP) [LuxAlgo]The Liquidity Levels/Voids (VP) is a script designed to detect liquidity voids & levels by measuring traded volume at all price levels on the market between two swing points and highlighting the distribution of the liquidity voids & levels at specific price levels.
🔶 USAGE
Liquidity is a fundamental market force that shapes the trajectory of assets.
The creation of a liquidity level comes as a result of an initial imbalance of supply/demand, which forms what we know as a swing high or swing low. As more players take positions in the market, these are levels that market participants will use as a historical reference to place their stops. When the levels are then re-tested, a decision will be made. The binary outcome here can be a breakout of the level or a reversal back to the mean.
Liquidity voids are sudden price changes that occur in the market when the price jumps from one level to another with little trading activity (low volume), creating an imbalance in price. The price tends to fill or retest the liquidity voids area, and traders understand at which price level institutional players have been active.
Liquidity voids are a valuable concept in trading, as they provide insights about where many orders were injected, creating this inefficiency in the market. The price tends to restore the balance.
🔶 SETTINGS
The script takes into account user-defined parameters and detects the liquidity voids based on them, where detailed usage for each user-defined input parameter in indicator settings is provided with the related input's tooltip.
🔹 Liquidity Levels / Voids
Liquidity Levels/Voids: Color customization option for Unfilled Liquidity Levels/Voids.
Detection Length: Lookback period used for the calculation of Swing Levels.
Threshold %: Threshold used for the calculation of the Liquidity Levels & Voids.
Sensitivity: Adjusts the number of levels between two swing points, as a result, the height of a level is determined, and then based on the above-given threshold the level is checked if it matches the liquidity level/void conditions.
Filled Liquidity Levels/Voids: Toggles the visibility of the Filled Liquidity Levels/Voids and color customization option for Filled Liquidity Levels/Voids.
🔹 Other Features
Swing Highs/Lows: Toggles the visibility of the Swing Levels, where tooltips present statistical information, such as price, price change, and cumulative volume between the two swing levels detected based on the detection length specified above, Coloring options to customize swing low and swing high label colors, and Size option to adjust the size of the labels.
🔹 Display Options
Mode: Controls the lookback length of detection and visualization.
# Bars: Lookback length customization, in case Mode is set to Present.
🔶 RELATED SCRIPTS
Liquidity-Voids-FVG
Buyside-Sellside-Liquidity
Swing-Volume-Profiles

MTF FVGThis script finds Imbalance (Fair Value Gap (FVG)) on multi timeframes.
If needed all TF can be used at once: 1, 3, 5, 15, 30, 45, 60, 120, 180, 240, D, W.
It finds FVG on any desired TF that is greater or equal than TF on the chart.
FVG stands for fair value gap, which is a three-candle structure that indicates an imbalance or inefficiency in the market. An imbalance means that the buying and selling is not equal, and there is a gap between the fair value and the market value of an asset. A bullish FVG shows that the market value is lower than the fair value, and a bearish FVG shows the opposite.
FVG takes place in a series of 3 candles when the middle candle gaps up or down. This signals strong buying or selling pressure in the direction of the gap. When a gap occurs the wicks of the candles do not overlap each other.
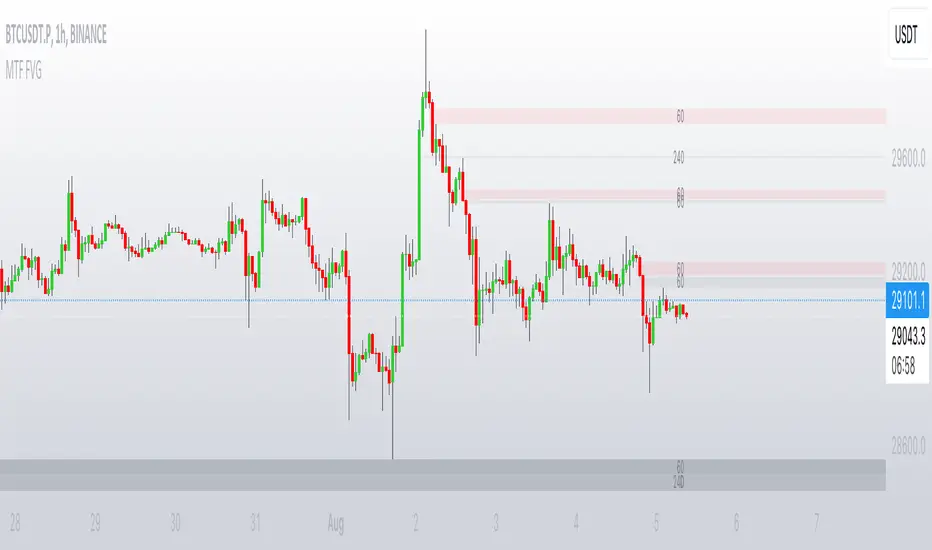
Liquidity Voids (FVG) [LuxAlgo]The Liquidity Voids (FVG) indicator is designed to detect liquidity voids/imbalances derived from the fair value gaps and highlight the distribution of the liquidity voids at specific price levels.
Fair value gaps and liquidity voids are both indicators of sell-side and buy-side imbalance in trading. The only difference is how they are represented in the trading chart. Liquidity voids occur when the price moves sharply in one direction forming long-range candles that have little trading activity, whilst a fair value is a gap in price.
🔶 USAGE
Liquidity can help you to determine where the price is likely to head next. In conjunction with higher timeframe market structure, and supply and demand, liquidity can give you insights into potential price movement. It's essential to practice using liquidity alongside trend analysis and supply and demand to read market conditions effectively.
The peculiar thing about liquidity voids is that they almost always fill up. And by “filling”, we mean the price returns to the origin of the gap. The reason for this is that during the gap, an imbalance is created in the asset that has to be made up for. The erasure of this gap is what we call the filling of the void. And while some voids waste no time in filling, some others take multiple periods before they get filled.
🔶 SETTINGS
The script takes into account user-defined parameters and detects the liquidity voids based on them, where detailed usage for each user-defined input parameter in indicator settings is provided with the related input's tooltip.
🔹 Liquidity Detection
Liquidity Voids Threshold: Act as a filter while detecting the Liquidity Voids. When set to 0 basically means no filtering is applied, increasing the value causes the script to check the width of the void compared to a fixed-length ATR value
Bullish: Color customization option for Bullish Liquidity Voids
Bearish: Color customization option for Bearish Liquidity Voids
Labels: Toggles the visibility of the Liquidity Void label
Filled Liquidity Voids: Toggles the visibility of the Filled Liquidity Voids
🔹 Display Options
Mode: Controls the lookback length of detection and visualization
# Bars: Lookback length customization, in case Mode is set to Present
🔶 RELATED SCRIPTS
Buyside-Sellside-Liquidity
Fair-Value-Gaps

sc_Imbalance indicatorThe script helps to identify imbalance trade candles on the chart.
Prices after a rip-up candle (color in gray, default) will often see subsequent prices backfilling the rip-up candle ie. prices after the rip-up imbalance will fall back down. The opposite is true for flush-down candles (color in purple, default). This indicator allows a quick seeing of which imbalance candle that not been backfilled yet and present opportunities in trading the stock with potential target price based on the imbalance candle.
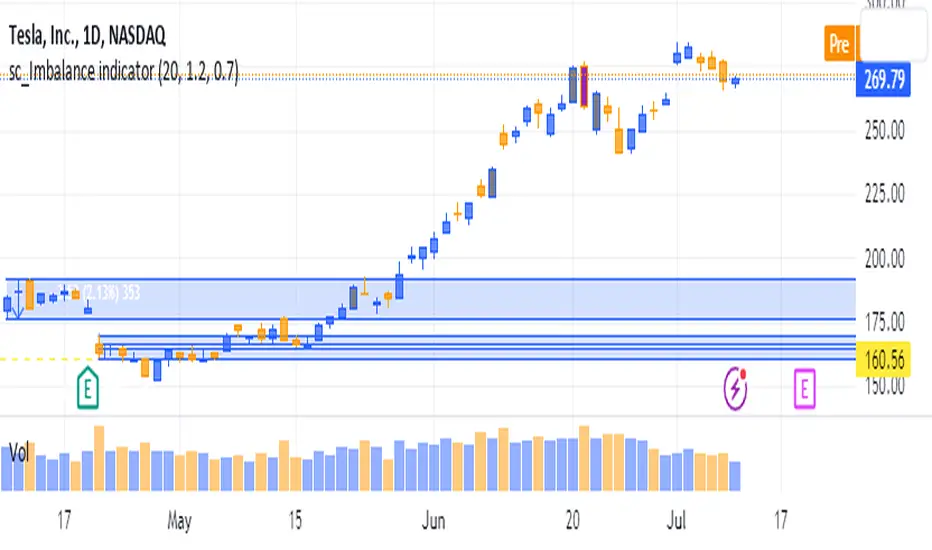
MTF Smart Money ConceptsOverview
This indicator displays major elements of Smart Money Concepts and price action trading with multi-timeframes(MTF) and layered market structures with color visualization.
What is Smart Money Concepts?
Smart Money Concepts(SMC) is one of the methodologies to interpret how financial market moves and to analyze it and execute trades, focusing on liquidity and order flow of financial institutions.
Smart money means the funds invested by large financial institutions such as banks, institutional traders/investors, market makers, hedge funds etc. contrary to retail traders/investors' money.
It is important to note that there is no proof or evidence that those institutions move the market as described in Smart Money Concepts.
Personally speaking, it is one of the interpretation of the market and another angle to view the market just like other technical analysis methodologies such as Elliott Wave Principle, Gann Theory, Wyckoff Method and even traditional price action trading.
Importance of MTF Analysis
MTF analysis(a.k.a Topdown analysis) is the foundation to technically analyze charts and the most fundamental skill in trading because lower timeframes are always influenced by upper timeframes where large financial institutions operate.
How to use
This indicator is designed to help traders analyze how the market moves in terms of SMC and price action with multi-timeframes and color visualization of the market structures, which makes this indicator unique and different from other indicators.
There is two key settings that you can use based on your trading style.
1.Upper timeframe selection
You have two options to determine upper timeframe; Auto mode and Manual mode.
When Auto mode selected, upper timeframe will be determined based on chart timeframe as follows.
Chart timeframe => Upper timeframe
1M=>15M
5M/15M=>1H
30M/1H=>4H
4H=>D
D=>W
W=>M
If you select Manual mode, you can fix an upper timeframe.
2.High/low settings
This affects all other settings of the indicator and most importantly designs the market structure.
This is the key setting to determine how you view the market as price action trading is all about highs and lows and story of how highs and lows have been created with the market structure.
You can specify left bars and right bars to identify swing highs/lows and these highs/lows become the basis to design the market structure and determine how SMC elements are displayed.
Example:
Left bar&right bar: 10
You can see bigger wave(magenta line) in the market structure(stepped line).
(Magenta line is a drawn object by manual)
Left bar&right bar: 4
With this setting, you can see smaller wave in the market structure.
Since market moves like wave as there is a lot of wave theories in financial investment/trading industry such as Elliott wave, Wolf wave etc., users can define market structure with this setting depending on what degree of wave they aim to trade.
Functions:
MTF Order Block
Concept
Order block is a block of orders where buying orders and selling orders are accumulated. Order blocks are created when the institutions move the market up and down, temporality placing orders in an opposite direction to the way they want to move, in order to match their own orders with counter-orders.
Visualization by the indicator
The indicator displays both chart timeframe's order blocks and upper timeframe's order blocks(MTF).
You can also select from two options how to display order blocks;
1. Show all order blocks
2. Show strong order blocks only
Note: Strong order blocks mean order blocks created at strong highs/lows. See also strong high/low below.
Alerts can be set when prices reach strong order blocks.
MTF Fair Value Gap(FVG)/Imbalance
Concept
Fair Value Gap(FVG)(Imbalance) is a void generated among three consecutive candlesticks.
FVG(s) is created when the market moves so rapidly generating buy side or sell side order imbalances.
FVG(s) is characterized by price action that prices tend to come back to the area where FVG(s) exists, filling in the space among the candlesticks.
Visualization by the indicator
The indicator displays both chart timeframe's FVG and upper timeframe's FVG.
MTF Liquidity Grab
Concept
Liquidity grab is price action to sweep liquidity for the institutions to move the market.
This price action often happens because the size of their orders is so huge and they need a bunch of counter-orders to match their orders. This is why prices sometimes come to areas where liquidity rest and swipe them before the market goes up/down.
Liquidity visualization
Where does liquidity rest?
The answer is above highs(buy side liquidity) and below lows(sell side liquidity).
Among all highs and lows, swing highs and lows are where liquidity is accumulated the most because swing highs and lows can be created only by the institutions, therefore massive liquidity is indicated.
Visualization by the indicator
The indicator displays liquidity dots so that users can easily identify where liquidity rests and liquidity grab of both a chart timeframe and an upper timeframe.
Alerts can be set when liquidity grab happens.
MTF Strong High/Low
Concept
Strong high/low literally means strong highs and lows among all highs and lows including swing highs and lows.
There is a few different definitions of strong high/low in price action trading and the definition in this indicator is as follows.
Strong high
A high that that breaks higher low or lower low
Strong low
A low that breaks lower high or higher high
Visualization by the indicator
The indicator displays strong highs and lows of both a chart timeframe and an upper timeframe.
MTF Market Structure Visualization
Concept
Market structure is a series of price movement with highs and lows which outlines the way the market directs. It is a basis to see trend occurrence, trend reversal and sideways and analyzing the market structures in multi-timeframes is the most fundamental technical skill in trading/investment.
Visualization by the indicator
The indicator displays market structures of both a chart timeframe and an upper timeframe and provide color visualization depending on bullish and bearish market structures.
The definition of bullish and bearish market structure is as follows.
Bullish market structure
When a price breaks a Lower High or Higher High
Bearish market structure
When a price breaks a Higher Low or Lower Low
Settings
All the functions above, colors and line settings are parameterized and can be turned on/off depending on users’ needs.
———————————————————————————
概要
Smart Money Concepts(SMC)およびプライスアクショントレードにおける重要な要素をマルチタイムフレームで表示することのできるインジケーターです。
相場構造(Market structure)をマルチタイムフレームで表示し、相場構造の強弱を色で可視化することができます。
Smart Money Concepts(スマートマネーコンセプト)とは?
Smart Money Concepts(以下SMC) は金融市場がどのように動くかを解釈し、分析し、取引を執行するための相場理論の一つであり、Liquidity(リクイディティ)および機関投資家のオーダーフロー(注文の流れ)に焦点を置いていることが特徴です。
Smart Money(スマートマネー)とは、銀行や機関投資家、マーケットメーカー、ヘッジファンドといった金融機関が動かす資金を意味し、個人投資家の資金と対をなす概念です。
重要な点は、実際に上記の金融機関がSmart Money Conceptsで語られているような相場の動かし方をしているかどうかを証明する明確なエビデンスはないということです。
個人的には、エリオット波動理論やギャン理論、ワイコフ理論、伝統的なプライスアクショントレーディングの方法論と同様に、マーケットの動きを解釈するための一つの方法論であり、マーケットの動きを別の角度から見る枠組みと捉えています。
マルチタイムフレーム(MTF)分析の重要性
MTF分析はチャートをテクニカルに分析する上での基礎であり、トレードにおいて最も重要なスキルです。なぜなら下位のタイムフレームは上記のような金融機関が資金運用を行う上位のタイムフレームの影響を常に受けるためです。
使い方
このインジケーターは、SMCまたはプライスアクショントレードの観点から、トレーダーがマーケットをマルチタイムフレームで分析することを支援するために開発しています。
相場構造(Market structure/マーケットストラクチャー)を方向性に応じて色で可視化することができるため、視覚的に相場の構造を判断できることがこのインジケータのユニークな点であり、他のインジケーターと異なる点です。
ユーザーのトレードスタイルに応じて、以下の二つの設定を行うことができます。
1.上位足の決定方法
ユーザーは上位足のタイムフレームを決定するにあたり、AutoモードとManualモードを選択することができます。
Autoモードを選択した場合、上位足はチャートのタイムフレームに応じて以下のように決定されます。
チャートタイムフレーム => 上位足タイムフレーム
1M=>15M
5M/15M=>1H
30M/1H=>4H
4H=>D
D=>W
W=>M
Manualモードを選択すると上位足のタイムフレームを固定することができます。
2.High/low(高値/安値) 設定
当設定はインジケーターの他の全ての機能に影響し、また最も重要である相場構造の定義に影響します。
当設定はユーザーがマーケットをどのように見るか(=どの程度の粒度)を決定する重要な設定です。なぜならプライスアクショントレードは、高値、安値とそれらが相場構造をどのように構築してきたかの一連の流れを分析することが全てだからです。
ユーザーは相場構造を決定付けるスイングハイ·スイングローを特定するためのバーの本数を設定することができます。ここで設定した内容が、相場構造を定義し、以下で説明するSMCの要素の表示を決定することになります。
例:
Left bar&right bar(左右のバーの数): 10
この場合、ステップラインで示した相場構造の中に大きな波(マゼンタの波)を見ることができます。
(マゼンタのラインは手動で描いたオブジェクト)
Left bar&right bar: 4
この設定では、上記に比べて小さい波を描いていることが確認できます。
相場理論の中にエリオット波動理論やウォルフ波動といった数多くの波動理論があることからわかるように、相場は波として動きます。どの粒度の波を狙うかというトレーダーのスタイルに応じて、設定を変更することができます。
機能
MTFオーダーブロック
コンセプト
オーダーブロックとは買い注文と売り注文が一連となって蓄積されたオーダー(注文)のブロックのことです。
オーダーブロックは機関投資家が相場を動かす際に、本来意図する方向とは一時的に逆に動かすことで、彼ら自身の注文をマッチングさせるための反対注文を発生させることで形成されます。
インジケーターによる表示
インジケーターはチャートタイムフレームのオーダーブロックと上位足のオーダーブロックの両方を表示することができます。
また、オーダーブロックの表示オプションとして、
1.全てのオーダーブロックを表示
2.Strong(ストロング)オーダーブロックのみを表示
を選択することが可能です。
注: StrongオーダーブロックはStrong High/Lowで形成されるオーダーブロックを指します。(下記参照)
また、オーダーブロック到達でのアラート設定も可能です。
MTFフェアーバリューギャップ(FVG)/インバランス
コンセプト
フェアーバリューギャップ(FVG)/インバランスとは連続する3つのローソク足の間に形成される溝(Gap)のことです。
フェアーバリューギャップはマーケットが非常に早く動いたことにより、買いオーダーと売りオーダーの需給バランスが崩れることによって発生します。
フェアーバリューギャップには、価格がフェアーバリューギャップが発生したエリアまで戻ってくる傾向があるという特徴が存在します。
インジケーターによる表示
インジケーターはチャートタイムフレームのフェアーバリューギャップと上位足のフェアーバリューギャップの両方を表示することができます。
MTF Liquidity Grab(リクイディティ·グラブ)
コンセプト
Liquidity(リクイディティ)とはマネー、つまり注文です。
Liquidity Grab(リクイディティ·グラブ)とは、機関投資家がマーケットを動かす際にLiquidityを取得するプライスアクションのことを指します。
このプライスアクションは、機関投資家が処理する注文サイズが非常に大きいため、自身の注文を出す際に大量の反対注文を必要とすることからしばしば発生します。
これが、価格がLiquidity(注文)の集まっているエリアに接近し、それら注文をスワイプ(狩り取る)した後に上昇·下落する理由です。
Liquidityの可視化
一般的にLiquidityは高値の上(buy side liquidity)、安値の下(sell side liquidity)に存在します。
全ての高値·安値の中で、スイングハイ·ローがliquidityが最も蓄積されているエリアということができます。なぜならスイングハイ·ローは機関投資家の注文によってのみ形成されるからです。
インジケーターによる表示
ユーザーがLiquidityポイントを簡単に識別できるようにLiquidityをドット表示することが可能です。またチャートタイムフレームと上位足の両方のLiquidity Grabを表示することができます。
Liquidity Grab発生時にアラートも設定可能です。
MTF Strong High/Low(ストロングハイ·ロー)
コンセプト
Strong high/lowは文字通り、強い高値·安値のことを指します。
トレーダーの間でいくつかの異なる定義が存在しますが、当インジケーターでの定義は以下の通りです。
Strong high
Higher low(ハイアーロー) または Lower low(ロワーロー)をブレイクした高値
Strong low
Lower higher (ロワーハイ) または Higher High(ハイアーハイ)をブレイクした安値
インジケーターによる表示
チャートタイムフレーム、上位足のStrong High/Lowを表示することが可能です。
相場構造可視化
コンセプト
相場構造(Market structure/マーケットストラクチャー)とは、相場の流れを成り立たせる高値と安値を元にした一連の値動きです。建物における骨組みに該当します。
トレンドの発生、転換、レンジを見極めるための基礎であり、マルチタイムフレームで相場構造を分析することは、投資·トレードにおいて最も重要なテクニカルスキルです。
インジケーターによる表示
チャートタイムフレームと上位足タイムフレーム両方の相場構造を表示することができます。
また、相場構造が強気の状態か弱気の状態かを色で可視化するため、上位足含めた相場の流れを視覚的に判断することが可能です。
相場構造の強弱の定義は以下の通りです。
強気の相場構造(Bullish market structure)
価格がLower HighまたはHigher Highをブレイクしたとき
弱気の相場構造(Bearish market structure)
価格がHigher LowまたはLower Lowをブレイクしたとき
設定
上記の全ての機能は色やライン設定含めパラメーターで設定が可能です。またユーザの必要に応じて表示·非表示を切り替えることができます。
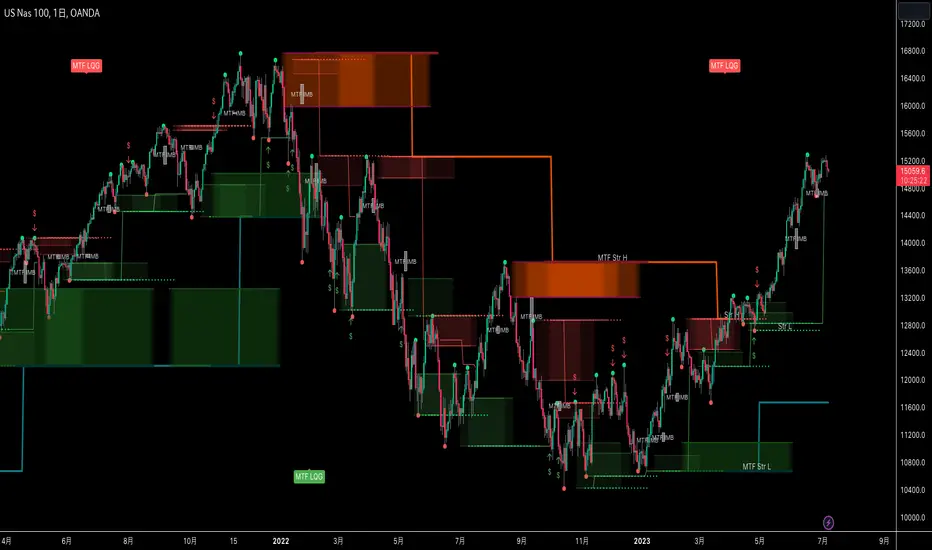
Price based concepts / quantifytools- Overview
Price based concepts incorporates a collection of multiple price action based concepts. Main component of the script is market structure, on top of which liquidity sweeps and deviations are built on, leaving imbalances the only standalone concept included. Each concept can be enabled/disabled separately for creating a selection of indications that one deems relevant for their purposes. Price based concepts are quantified using metrics that measure their expected behavior, such as historical likelihood of supportive price action for given market structure state and volume traded at liquidity sweeps. The concepts principally work on any chart, whether that is equities, currencies, cryptocurrencies or commodities, charts with volume data or no volume data. Essentially any asset that can be considered an ordinary speculative asset. The concepts also work on any timeframe, from second charts to monthly charts. None of the indications are repainted.
Market structure
Market structure is an analysis of support/resistance levels (pivots) and their position relative to each other. Market structure is considered to be bullish on a series of higher highs/higher lows and bearish on a series of lower highs/lower lows. Market structure shifts from bullish to bearish and vice versa on a break of the most recent pivot high/low, indicating weak ability to defend a key level from the dominating side. Supportive market structure typically provides lengthier and sustained trending environment, making it an ideal point of confluence for establishing directional bias for trades.
Liquidity sweeps
Liquidity sweeps are formed when price exceeds a pivot level that served as a provable level of demand once and is expected to display demand again when revisited. A simple way to look at liquidity sweeps is re-tests of untapped support/resistance levels.
Deviations
Deviations are formed when price exceeds a reference level (market structure shift level/liquidity sweep level) and shortly closes back in, leaving participating breakout traders in an awkward position. On further adverse movement, stuck breakout traders are forced to cover their underwater positions, creating ideal conditions for a lengthier reversal.
Imbalances
Imbalances, also known as fair value gaps or single prints, depict areas of inefficient and one sided transacting. Given inclination for markets to trade efficiently, price is naturally attracted to areas that lack proper participation, making imbalances ideal targets for entries or exits.
Key takeaways
- Price based concepts consists of market structure, liquidity sweeps, deviations and imbalances.
- Market structure shifts from bullish to bearish and vice versa on a break of the most recent pivot high/low, indicating weak ability to defend a key level from the dominating side.
- Supportive market structure tends to provide lengthier and sustained movement for the dominating side, making it an ideal foundation for establishing directional bias for trades.
- Liquidity sweeps are formed when price exceeds an untapped support/resistance level that served as a provable level of demand in the past, likely to show demand again when revisited.
- Deviations are formed when price exceeds a key level and shortly closes back in, leaving breakout traders in an awkward position. Further adverse movement compels trapped participants to cover their positions, creating ideal conditions for a reversal.
- Imbalances depict areas of inefficient and one sided transacting where price is naturally attracted to, making them ideal targets for entries or exits.
- Price based concepts are quantified using metrics that measure expected behavior, such as historical likelihood of supportive structure and volume traded at liquidity sweeps.
- For practical guide with practical examples, see last section.
Accessing script 🔑
See "Author's instructions" section, found at bottom of the script page.
Disclaimer
Price based concepts are not buy/sell signals, a standalone trading strategy or financial advice. They also do not substitute knowing how to trade. Example charts and ideas shown for use cases are textbook examples under ideal conditions, not guaranteed to repeat as they are presented. Price based concepts notify when a set of conditions are in place from a purely technical standpoint. Price based concepts should be viewed as one tool providing one kind of evidence, to be used in conjunction with other means of analysis.
Price based concepts are backtested using metrics that reasonably depict their expected behaviour, such as historical likelihood of supportive price movement on each market structure state. The metrics are not intended to be elaborate and perfect, but to serve as a general barometer for feedback created by the indications. Backtesting is done first and foremost to exclude scenarios where the concepts clearly don't work or work suboptimally, in which case they can't be considered as valid evidence. Even when the metrics indicate historical reactions of good quality, price impact can and inevitably does deviate from the expected. Past results do not guarantee future performance.
- Example charts
Chart #1 : BTCUSDT
Chart #2 : EURUSD
Chart #3 : ES futures
Chart #4 : NG futures
Chart #5 : Custom timeframes
- Concepts
Market structure
Knowing when price has truly pivoted is much harder than it might seem at first. In this script, pivots are determined using a custom formula based on volatility adjusted average price, a fundamentally different approach to the widely used highest/lowest price within X amount of bars. The script calculates average price within set period and adjusts it to volatility. Using this formula, the script determines when price has turned significantly enough and aggressively enough to constitute a relevant pivot, resulting in high accuracy while ruling out subjective decision making completely. Users can adjust length of market structure basis and sensitivity of volatility adjustment to achieve desired magnitude of pivots, reflected on the average swing metrics. Note that structure pivots are backpainted. Typical confirmation time for a pivot is within 2-3 bars after peak in price.
Market structure shifts
Generally speaking, traders consider market structure to have shifted when most recent structure high/low gets taken out, flipping underlying bias from one side over to the other (e.g. from bullish structure favoring upside to bearish structure favoring downside). However, there are many ways to approach the concept and the most popular method might not always be the best one. Users can determine their own market structure shift rules by choosing source (close, high, low, ohlc4 etc.) for determining structure shift. Users can also choose additional rules for structure shift, such as two consecutive closes above/below pivot to qualify as a valid shift.
Liquidity sweeps
Users can set maximum amount of bars liquidity levels are considered relevant from the moment of confirmed pivot. By default liquidity levels are monitored for 250 bars and then discarded. Level of tolerance can be set to anything between 100 and 1000 bars. For each liquidity sweep, relative volume (volume relative to volume moving average) is stored and added to average calculations for keeping track of typical depth of liquidity found at sweeps.
Deviations
Users can set a maximum amount of bars price has to spend above/below reference level to consider a deviation to be in place. By default set to 6 bars.
Imbalances
Users can set a desired fill point for imbalances using the following options: 100%, 75%, 50%, 25%. Users can also opt for excluding insignificant imbalances to attain better relevance in indications.
- Backtesting
Built-in backtesting is based on metrics that are considered to reasonably quantify expected behaviour of the main concept, market structure. Structure feedback is monitored using two metrics, supportive structure and structure period gain. Rest of the metrics provided are informational in nature, such as average swing and average relative volume traded at liquidity sweeps. Main purpose of the metrics is to form a general barometer for monitoring whether or not the concepts can be viewed as valid evidence. When the concepts are clearly not working optimally, one should adjust expectations accordingly or take action to improve performance. To make any valid conclusions of performance, sample size should also be significant enough to eliminate randomness effectively. If sample size on any individual chart is insufficient, one should view feedback scores on multiple correlating and comparable charts to make up for the loss.
For more elaborate backtesting, price based concepts can be used in any other script that has a source input, including fully mechanic strategies utilizing Tradingview's native backtester. Each concept and their indications (e.g. higher low on a bearish structure, lower high on a bullish structure, market structure shift up, imbalance filled etc.) can be utilized separately and used as a component in a backtesting script of your choice.
Structure feedback
Structure feedback is monitored using two metrics, likelihood of supportive price movement following a market structure shift and average structure period gain. If either of the two employed tests indicate failed reactions beyond a tolerable level, one should take action to improve feedback by adjusting the settings. If feedback metrics after adjusting the settings are still insufficient, the concepts are working suboptimally for the given chart and cannot be regarded as valid technical evidence as they are.
Metric #1 : Supportive structure
Each structure pivot is benchmarked against its respective structure shift level. Feedback is considered successful if structure pivot takes place above market structure shift level (in the case of bullish structure) or below market structure shift level (in the case of bearish structure). Structure feedback constitutes as one test indicating how often a market structure state results in price movement that can be considered supportive.
Metric #2 : Structure period gain
Each structure period is expected to present favorable appreciation, measured from one market structure shift level to another. E.g. bullish structure period gain is measured from market structure shift up level to market structure shift down level that ends the bullish structure period. Bearish structure is measured in a vice versa manner, from market structure shift down level to market structure shift up level that ends the bearish structure period. Feedback is considered successful if average structure period gain is supportive for a given structure (positive for bullish structure, negative for bearish structure).
Additional metrics
On top of structure feedback metrics, percentage gain for each swing (distance between a pivot to previous pivot) is recorded and stored to average calculations. Average swing calculations shed light on typical pivot magnitude for better understanding changes made in market structure settings. Average relative volume traded at liquidity sweep on the other hand gives a clue of depth of liquidity typically found on a sweeps.
Feedback scores
When market structure (basis for most concepts) is working optimally, quality threshold for both feedback metrics are met. By default, threshold for supportive structure is set to 66%, indicating valid feedback on 2/3 of backtesting periods on average. On top, average structure period gain needs to be positive (for bullish structures) and negative (for bearish structure) to qualify as valid feedback. When both tests are passed, a tick indicating valid feedback will appear next to feedback scores, otherwise an exclamation mark indicating suboptimal performance on either or both. If both or either test fail, market structure parameters need to be optimized for better performance or one needs to adjust expectations accordingly.
Verifying backtest calculations
Backtest metrics can be toggled on via input menu, separately for bullish and bearish structure. When toggled on, both cumulative and average counters used in backtesting will appear on "Data Window" tab. Calculation states are shown at a point in time where cursor is hovered. E.g. when hovering cursor on 4th of January 2021, backtest calculations as they were during this date will be shown.
- Alerts
Available alerts are the following.
- HH/HL/LH/LL/EQL/EQH on a bullish/bearish structure
- Bullish/bearish market structure shift
- Bullish/bearish imbalance created
- Bullish/bearish imbalance filled
- Bullish/bearish liquidity sweep
- Bullish/bearish deviation
- Visuals
Each concept can be enabled/disabled separately for creating a selection indications that one deems relevant for their purposes. On top, each concept has a stealth visual option for more discreet visuals.
Unfilled imbalances and untapped liquidity levels can be extended forward to better gauge key areas of interest.
Liquidity sweeps have an intensity option, using color and width to visualize volume traded at sweep.
Market structure states and market structure shifts can be visualized as chart color.
Metric table can be offsetted horizontally or vertically from any four corners of the chart, allowing space for tables from other scripts.
Table sizes, label sizes and colors are fully customizable via input menu.
- Practical guide
The basic idea behind market structure is that a side (bulls or bears) have shown significant weakness on a failed attempt to defend a key level (most recent pivot high/low). In the same way, a side has shown significant strength on a successful attempt to break through a key level. This successful break through a key level often leads to sustained lengthier movement for the side that provably has the upper hand, making it an ideal tool for establishing directional bias.
Multi-timeframe view of market structure provides crucial guidance for analyzing market structure states on any individual timeframe. If higher timeframe market structure is bullish, it doesn't make sense to expect contradicting lower timeframe market structure to provide significant adverse movement, but rather a normal correction within a long term trend. In the same way, if lower timeframe market structure is in agreement with higher timeframe market structure, one can expect a reliable trending environment to ensue as multiple points of confluence are in place.
Bullish structure can be considered constructive on a series of higher highs and higher lows, indicating strong interest from bulls to sustain an uptrend. Vice versa is true for bearish structure, a series of lower highs and lower lows can be considered constructive. When structure does not indicate strong interest to maintain a supportive trend (lower highs on bullish structure, higher lows on bearish structure), a structure shift and a turn in trend might be nearing.
Market structure shifts are of great interest for breakout traders who position for continuation. Structure shifts can indeed be fertile ground for executing a breakout trade, but breakouts can easily turn into fakeouts that leave participants in an awkward position. When price moves further away from the underwater participants, potential for snowball effect of covering positions and driving price further away is elevated.
Liquidity sweeps as a concept is based on the premise that pivoting price is evidence of meaningful depth of liquidity found at/around pivot. If liquidity existed at a pivot once, it is likely to exist there in the future as well. When price grinds against liquidity, it is on a path of resistance rather than path of least resistance. Pivots are also attractive placements for traders to set stop-losses, which act as fuel for price to move to the opposite direction when swept and triggered.
Behind tightly formed pivots are potentially many stop-loss orders lulled in the comfort of having many layers of levels protecting their position. Compression that leaves such clusters of unswept liquidity rarely goes unvisited.
As markets strive for efficient and proper transacting most of the time, imbalances serve as points in price where price is naturally attracted to. However, imbalances too are contextual and sometimes one sided trading is rewarded with follow through, rather than with a fill. Identifying market regimes give further clue into what to expect from imbalances. In a ranging environment, one can expect imbalances to fill relatively quick, making them ideal targets for entries and exits.
On a strongly trending environment on the other hand imbalances tend to stick for a much longer time. In such environments continuation can be expected with no fills or only partial fills. Signs of demand preventing fill attempts serve as additional clues for imminent continuation.
