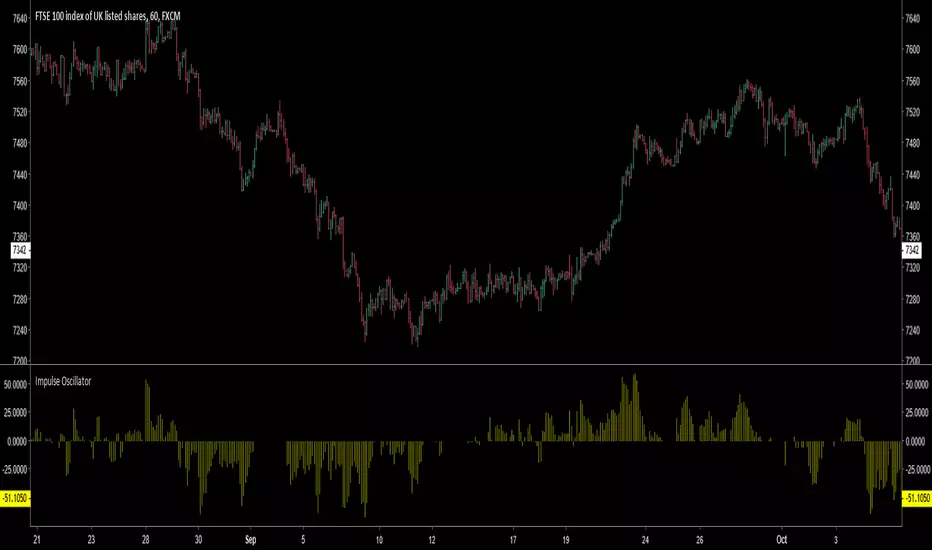
Unleash Elder Force on Your ChartI had searched for a proper indicator to recognize important impulses, so I just need to take a look at the indicator to quickly find them on the chart. Alexander Elder's Force is the answer, although I made a few changes to the design.
First, I found more accuracy using Hull Moving Average. It steers faster making sudden spikes even more visible. Second, it is faster to catch up and therefore ready for another impulse to measure.
The second change is to the visual presentation of the Elder Force. Columns look prettier and there needs to be a manually set value that gives regular sideways moves a border beside which it is likely to be either an institutional interference or a trend.
Furthermore, you can plot (minus) Elder Force in the indicator window too. This should be used to compare upside and downside thrusts with each other.
I don't use nor intend to use Elder Force as a buy/sell indicator. The point is to highlight certain price-action moments that I will then review and consider an entry after. I believe most indicators should be used like that.
:)
Impulse

PRIME IMPULSE W/ 3MAThis indicator bundle, combined with PRIME-QUARTERS, provides a trader with everything needed, on chart, to make swing and scalper entries. The short candle SMA are used to execute immediate entries, while the larger candle tf indicate Continuation, trend changes and swing points. The color coded impulse indicator used both RSI and TSI variables to determine divergences and the probability of the impending impulse thereafter. Red and green within the candles indicate bull or bearish impulses, while the yellow bars signal decreased volume and momentum for the current impulse, indicating the possible end of trend and either retracement, or Reversal. $auceCamp
Consolidation Ranges [kingthies] Consolidation Range Analysis
Published by Eric Thies, January 2021
█ Indicator Summary
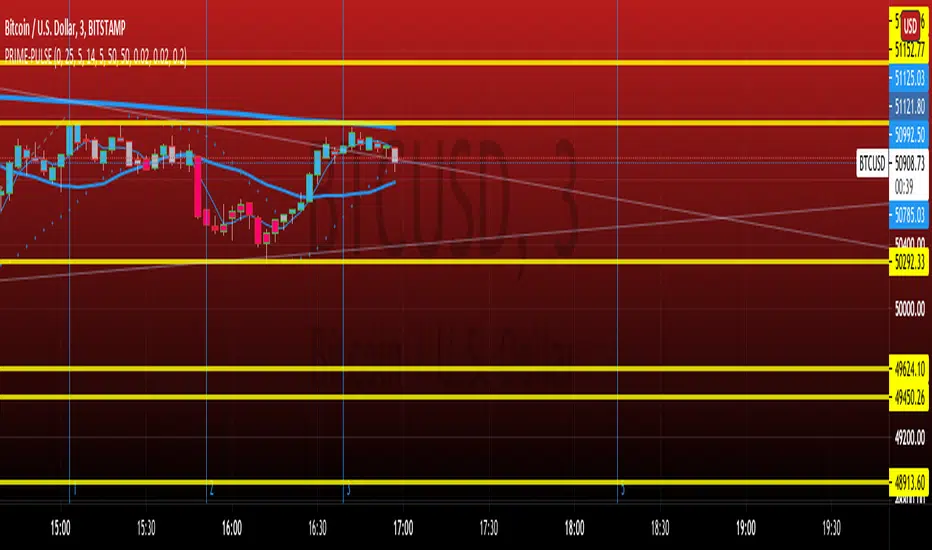
This tool calculates, analyzes and plots the visualization of a relative range over a given period of time
By adding to charts, users are enabled to see the impulsive nature of market cycles, along with their efforts to consolidate thereafter
The default period is 30, and should be adjusted to users preference
The default input is the current close price, on the chosen timeframe of the chart
█ Script Source
//
//@version=4
//© kingthies || This source code is subject to the terms of the Mozilla Public License 2.0 at mozilla.org
study("Consolidation Ranges ", shorttitle="CR ", overlay=true)
// !<------ User Inputs ----->
src = input(close, title='Range Input (Default set to Close'), lengthEMA=input(30,title='Length'),zoneToggle = input(true, title="Toggle Zone Highlights"), iCol = color.new(#FFFFFF, 100),
// !<---- Declarations & Calculations ---- >
trndUp = float(na),trndDwn = float(na), mid = float(na), e = ema(src, lengthEMA)
trndUp := src < nz(trndUp ) and src > trndDwn ? nz(trndUp ) : high, trndDwn := src < nz(trndUp ) and src > trndDwn ? nz(trndDwn ) : low, mid := avg(trndUp, trndDwn)
// !< ---- Plotting ----->
highRange = plot(trndUp == nz(trndUp ) ? trndUp : na, color=color.white, linewidth=2, style=plot.style_linebr, title="Top of Period Range")
lowRange = plot(trndDwn == nz(trndDwn ) ? trndDwn : na, color=color.white, linewidth=2, style=plot.style_linebr, title="Bottom of Period Range")
xzone = plot(zoneToggle ? src > e ? trndDwn : trndUp : na, color=iCol, style=plot.style_circles, linewidth=0, editable=false)
fill(highRange, xzone, color=color.lime,transp=70), fill(xzone, lowRange, color=color.red,transp=70)
//

Impulse Guage Indicator for HA CandlesThis script uses Heikin Ashi candles to smooth out the candles, then counts how many consecutive candles in a row are the same colour (red or green). It then takes each count and multiples it by the difference between close and open, to provide a weighted movement.
Where larger moves create greater impulses.

ATR with Impulse AlertsThis is a very simple script which simply plots an ATR (the built-in ATR function, using RMA) and plots a cross when the previously closed bar is larger than the ATR by a given threshold. There are also alert conditions set so you can be alerted when these impulse bars show up, either up or down bars. Have fun and safe trading!

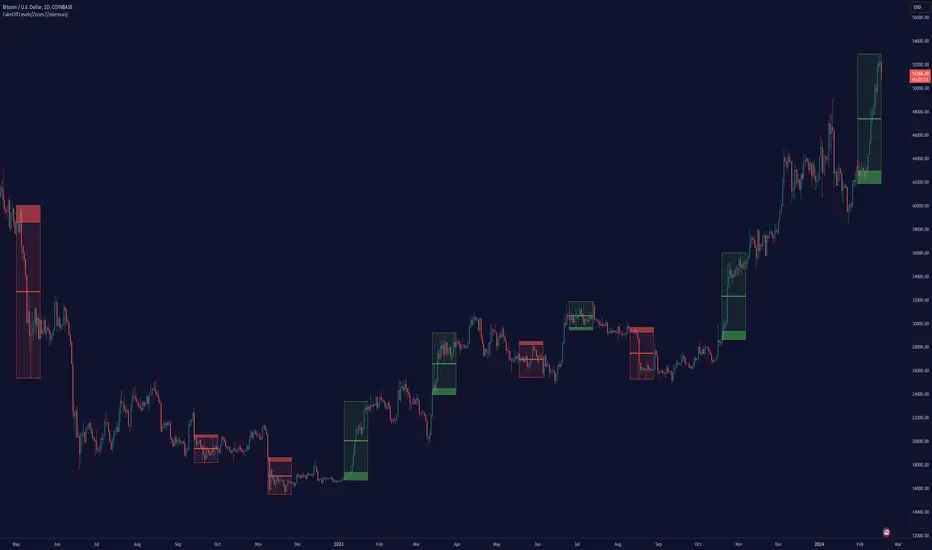
TakeOff Levels/Zones (Expo)TakeOff Levels/Zones (Expo) automatically identifies and displays support and resistance levels based on momentum.
Levels/Zones are displayed where there is a high probability that price can takeoff. Traders should look for breakouts from the Level/Zone.
If the price doesn't breakouts from the SR level/zone there's a chance that the market has topped or bottomed out.
The indicator can be used standalone or as a part of your current trading strategy.
Real-time
No repainting
Works on any market
HOW TO USE
1. Use the indicator to identify where the price can takeoff.
2. Use the indicator to identify potential breakouts.
3. Use the indicator to identify potential reversal points.
INDICATOR IN ACTION
1 min chart
I hope you find this indicator useful , and please comment or contact me if you like the script or have any questions/suggestions for future improvements. Thanks!
I will continually work on this indicator, so please share your experience and feedback as it will enable me to make even better improvements. Thanks to everyone that has already contacted me regarding my scripts. Your feedback is valuable for future developments!
ACCESS THE INDICATOR
• Contact me on TradingView or use the links below
-----------------
Disclaimer
Copyright by Zeiierman.
The information contained in my scripts/indicators/ideas does not constitute financial advice or a solicitation to buy or sell any securities of any type. I will not accept liability for any loss or damage, including without limitation any loss of profit, which may arise directly or indirectly from the use of or reliance on such information.
All investments involve risk, and the past performance of a security, industry, sector, market, financial product, trading strategy, or individual’s trading does not guarantee future results or returns. Investors are fully responsible for any investment decisions they make. Such decisions should be based solely on an evaluation of their financial circumstances, investment objectives, risk tolerance, and liquidity needs.
My scripts/indicators/ideas are only for educational purposes!
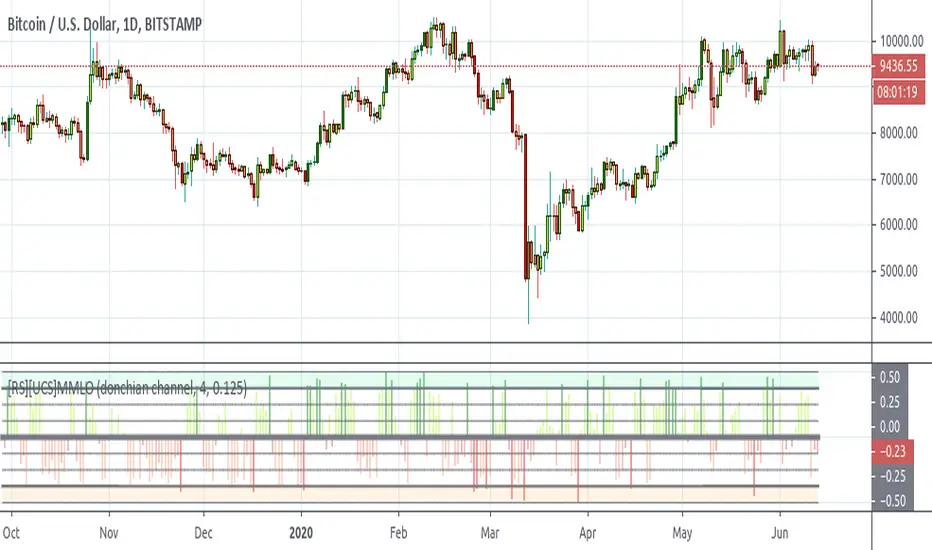
[RS][UCS]Murrey's Math Oscillator ModificationExperimental:
modifications includes 2 extra channel types to read volatility's range.
this is a update and modification to the Murrey's Math Lines Oscillator published by UCSgears here:
Impulse 7 StarThis script is build on the observation of Harsubh an Youtuber holding the channel named Impulse technical.
This is intraday based strategy and the time frame is on 5 minutes candle
This indicator indicates on one way momentum of a stock, If the body color becomes white then it indicates for sell signal, and if the body color is black then its buy signal.
this indicator tracks continuous 7 candles on same color.
If it generates Buy signal then find the highest high from last 7 candles and mark that candle.
If the price breaks the high of the marked candle then place a buy order
Stop Loss : Find the lowest low of the marked candle and its previous candle and place stoploss with 0.1% buffer
For Sell Side : Signal will be black body color of the candle
Sell Entry : Find the lowest low of the last 7 candles and mark that candle, if once the lowest low breaks then place an order and stoploss will be the highest high of the marked candle and its previous one with 0.1% buffer
If you dont know the target then hold the position till 15 minutes before closing the market

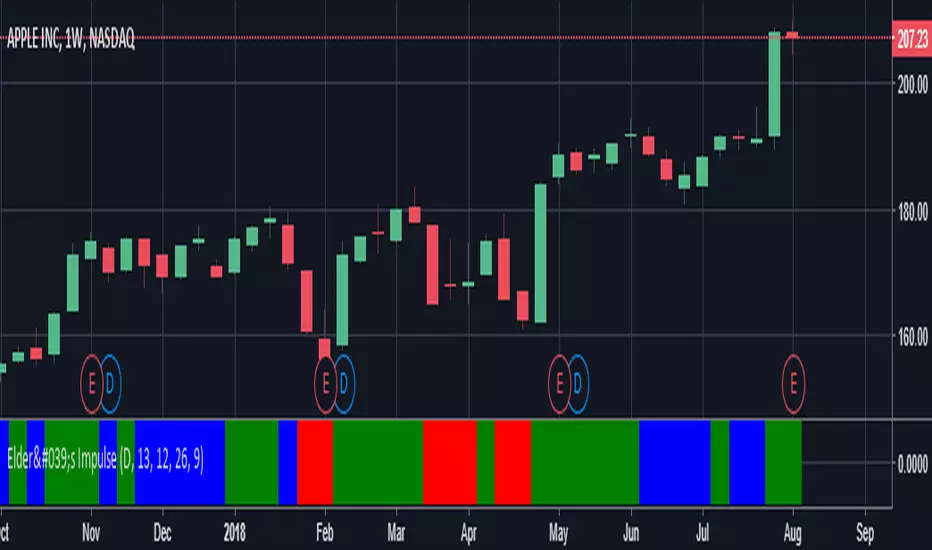
Elder Impulse SnapshotNASDAQ:AMZN
I've always been intrigued by the Elder Impulse System but found it labour intensive with its flipping back and forth between daily and weekly charts. I also wasn't fond of the way it repainted the candlesticks. So I set out to build a version where you could get every trade signal filtered down in one chart and still see the real price action.
This article provides a decent overview of the original system: www.investopedia.com
Elder Impulse Snapshot uses two EMAs and two MACDs, one of each to process both the daily and weekly data. The daily data gets an EMA of 13 periods and the standard MACD settings. For the weekly info, the EMA is set to 65 periods and all the MACD values are also multiplied by five (60, 130, 45). Buy signals are generated when both EMAs and both MACD histograms are rising. When all four of these elements are falling, sell signals are generated. If any of the indicators disagree, no signal is generated and entering any trade is not advised.
The blue and red arrows are the buy and sell signals. From my reading, it appears Dr. Elder recommended exiting the trade as soon as the system no longer generated a signal, though the case could be made for taking partial profit and moving up your stop loss to ride the trend out longer provided you haven't been stopped out yet.

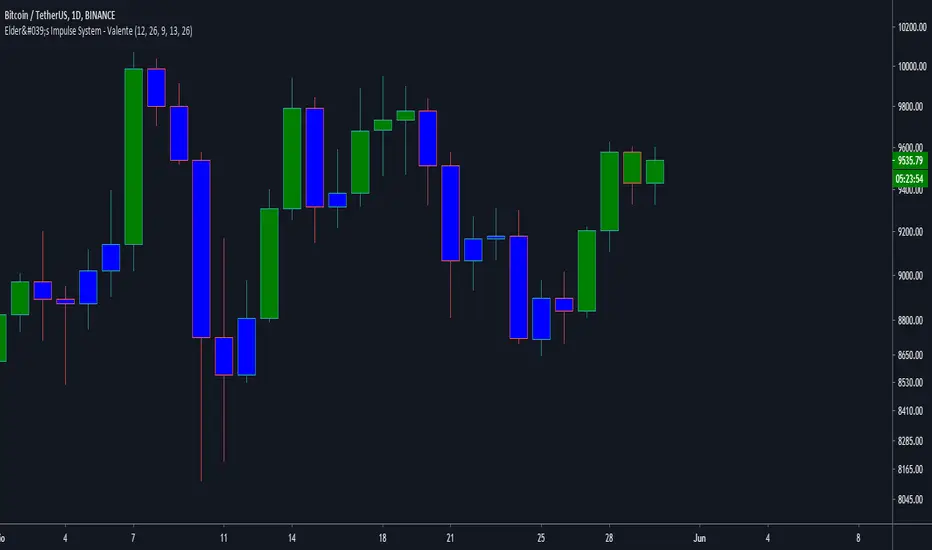
Elder's Impulse System with weekly EMA Filter - ValenteThis indicator was based on the Elders Impulse System by astraloverflow.
The only difference is that I included the weekly EMA26 as a filter and you can plot it on the graph if you want (unchecking the Weekly EMA26 won't turn the filter off, will only stop plotting it).
The indicator works this way:
When the MACD Histogram is growing UP, the EMA13 is pointing UP AND the Weekly EMA26 is pointing UP, the bar is Green
When the opposite is true, the bar is Red.
When any condition from both green and red is not true, the bar is blue.
In my opinion, this particular indicator works better on the D1 time frame. I recommended using the original one, by astraloverflow for other time frames.
I hope it is useful!
TKP-True Relative MovementThis script uses a combination of modified TSI and RSI conditions produce Buy/Sell/Hold signals. Similar to Elder's Impulse, when a buy signal is met, bars turn blue. When a sell signal is met, bars turn Pink. When signals are mixed, bars turn grey. Depending on direction of trend, gray bars can be considered "Hold" or take profit signals. You can change the parameters of TSI or RSI to preference. Also embedded in the script is the ability to add exponential moving average filter for additional conditions if you have some know how with coding.

Range Force Impulse The "Range Force Impulse" indicator combines 4 useful indicators into one, freeing up chart real-estate and giving the trader insight into trend health, bull/bear commitment, range and volatility all at a glance.
The indicator consists of the following:
Direction - True Range and Average True Range columns shown above and below 0 depending on direction of the period's price
-- TR (gray) shows the current period's trading volatility
-- ATR (Impulse colors, see below) shows an EMA of TR over a specified length
-- Can be used to determine stops and targets (Example: Stop loss at prev close - ATR, Target at 2x ATR)
Index - Alexander Elder's EMA of (change(close) * volume), shows crosses above 0 (green) and below 0 (red), and intermediate signals
-- Shows bull vs. bear interest/commitment/dominance
-- Elder recommends EMA length of 2 for daily chart buy/sell signals, and 13 for weekly chart bull/bear dominance & trend direction signals
-- Intermediate signals are shown above 0 when falling (salmon), or below 0 when rising (pale yellow)
System - Range columns are colored using Alexander Elder's censorship system (green: do not short, red: do not long, blue: is up to you)
-- Shows overall trend health (Macd histogram and EMA up/down changes)

Impulse BF 🚀Thanks to rasantos for the idea for this strategy.
The 2 lines are based on the sum number of impulses for x bars back. So total "up impulses" is the sum of the bars where price closed higher, and vice versa for "down impulses". The strategy is simple - a long signal is generated when the total up impulses exceeds the total down impulses. A short signal is generated when total down impulses exceeds total up impulses.
I included a rate of change function to filter out some of the sideways action, denoted by a white background.
I included the option of a stop loss since it may be useful for some settings but the default is 100% which will not be triggered. If we get stopped out and we still have the conditions for our position on candle close, we re-enter.
INSTRUCTIONS
Bright Green = go long
Bright Red = go short
Green = we have conditions for a long
Red = we have conditions for a short
White = no trade
NB: the length parameters are set to 18 by default. The higher this number, the more long term this strategy becomes. So for a macro trader, a setting of 84 would provide a small number of trades per year.

MACD Zero lag impulse systemThis version of impulse uses the double exponential moving average instead of the typical ema.
The impulse system :
The Impulse System combines two simple but powerful indicators.
One measures market inertia, the other its momentum. When both
point in the same direction, they identify an impulse worth following.
We get an entry signal when both indicators get in gear.
The Impulse System uses an exponential moving average to find
uptrends and downtrends. When the EMA rises, it shows that inertia
favors the bulls. When EMA falls, inertia works for the bears. The sec-
ond component is MACD-Histogram, an oscillator whose slope reflects
changes of power among bulls or bears. When MACD-Histogram rises,
it shows that bulls are becoming stronger. When it falls, it shows that
bears are growing stronger.
The Impulse System flags those bars where both the inertia and the
momentum point in the same direction. When both the EMA and
MACD-Histogram rise, they show that bulls are roaring and the uptrend
is accelerating.

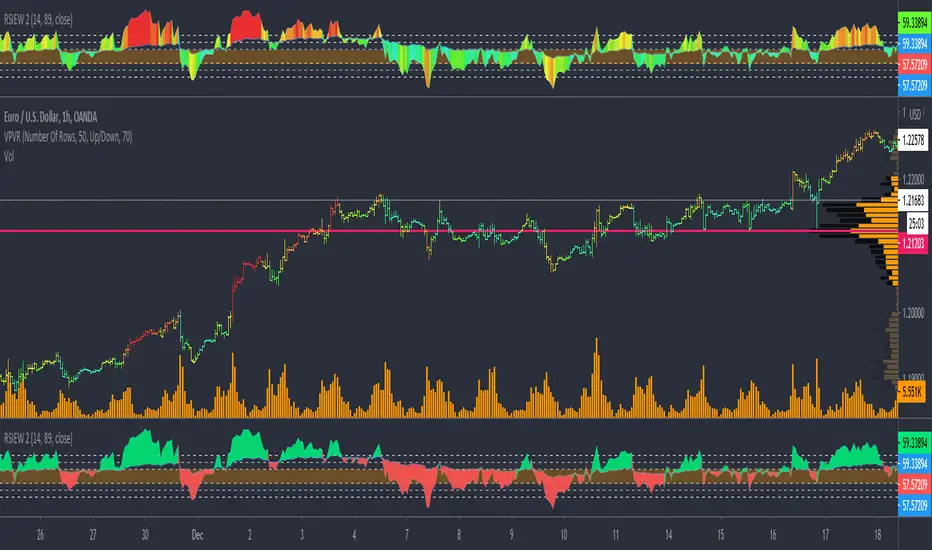
RSIEW V2 Thermal Falsecolor show Hot (Impulse) Cold (Correction)HI BIG PLAYER AROUND THE WORLD,
here is my new creation of modified RSI Indikator.
In order to the RSIEW Version 1 (look below this text) I build a thermal rainbow chart that shows the spectrum with all overbought and oversell phases. The colour spectrum can be compared with a thermal imaging camera.
In one hand, the hottest candles (going into red) show the extrem points of the chart. In trend direction this is often wave 3 of Elliott Waves theory and in correction phase it show the bounce period.
In other hand, the coldest candles (going into blue) show the weak points of the chart. In trend direction this is often a "cooling down" and in big correction phases it demonstrate frozen prices (really unattractive trading time).
Have fun with this and give me a feedback.
Of course, you are invited to follow me.
KIND REGARDS
NXT2017
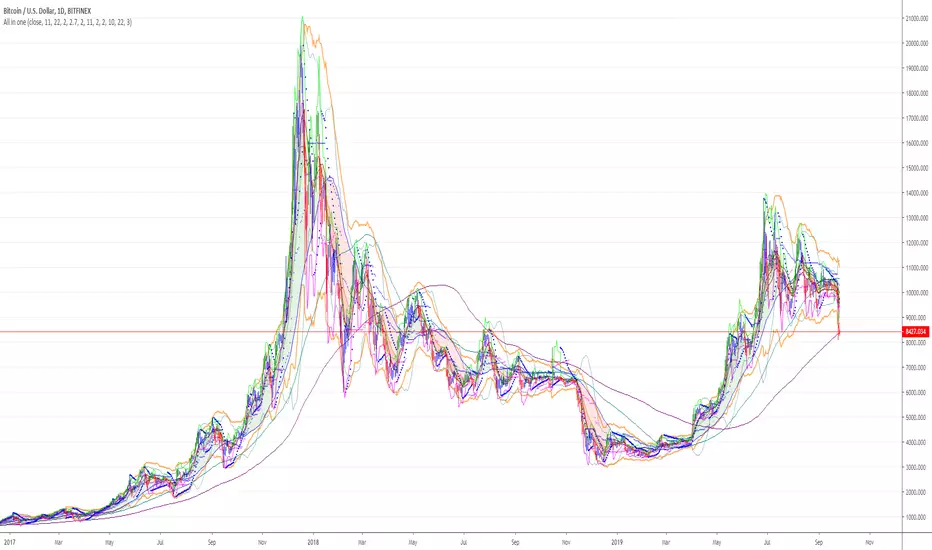
ENVELOPE BOLLINGER KELTN IMPULSE EMA SMA SAFEZONE SAR CHANDELIERALL THIS ALL IN ONE!
there are many options to check or uncheck to show only the tool that you need at that particular moment.
ENJOY!
ENVELOPE BOLLINGER KELTNER IMPULSE EMA SMA SAFEZONE SAR CHANDELIER
Elder impulse releaseThe purpose of Impulse Release is to prevent trading in the wrong direction. While the Impulse System operates in a single timeframe, Impulse Release is based on two timeframes. It tracks both the longer and the shorter timeframes to find when the Impulse points in the same direction on both.
Its color bar flashes several signals:
If one timeframe is in a buy mode and the other in a sell mode, the signal is "No Trade Allowed", a red bar.
If both are neutral, then any trades are allowed, showing a blue bar.
When one is bullish while the other is either bullish or neutral, there is a green bar, allowing traders to buy and prohibiting shorting.
When one is bearish while the other is either bearish or neutral, a red bar signals that shorts are permitted, while long trades are not allowed.
Please check Dr Elders books available on amazon they are a great buy and a nice to read.

AG ATR ImpulseThis is an indicator we built to look for "Impulse" moves in the markets. It uses Average True Range (ATR) calculations. We use a fastATR setting of 1 to show the current candle/period's ATR. The black line is a second, slowATR, that we use to see whether the fastATR is higher than the slowATR. If so, the bar is green, if not, grey.
The background is coloured by a "Change Factor" that can be customised. It essentially uses more ATR calculations to suggest whether to be looking for longs (green background) or shorts (red background). Setting the Change Factor lower than default to 1 makes the underlying calculations more sensitive, and thus, the background filter will change more often, but the signal will have less accuracy. Setting the Change Factor higher than default to, say, 3, will make the underlying calculations less sensitive, and thus, the background filter will change less often, but the signal will be more accurate.
In the chart example attached, I have included some trade ideas that could have been taken using this indicator to give you an idea of how to use the indicator.

Impulse Oscillator without legs for Price Action & Elliott WavesHi Traders,
I have a newcomer for impulsetrading.
This indicator is an oscillator that show without legs impulses of Price Action .
For the expertise: you can use it for counting elliott waves !
Have fun and winning trades!
Elder's Impulse SystemSimilar indicators already published have modifications with respect to Elder's theory. This indicator fulfills literally what is described in the New Trading For A Living.
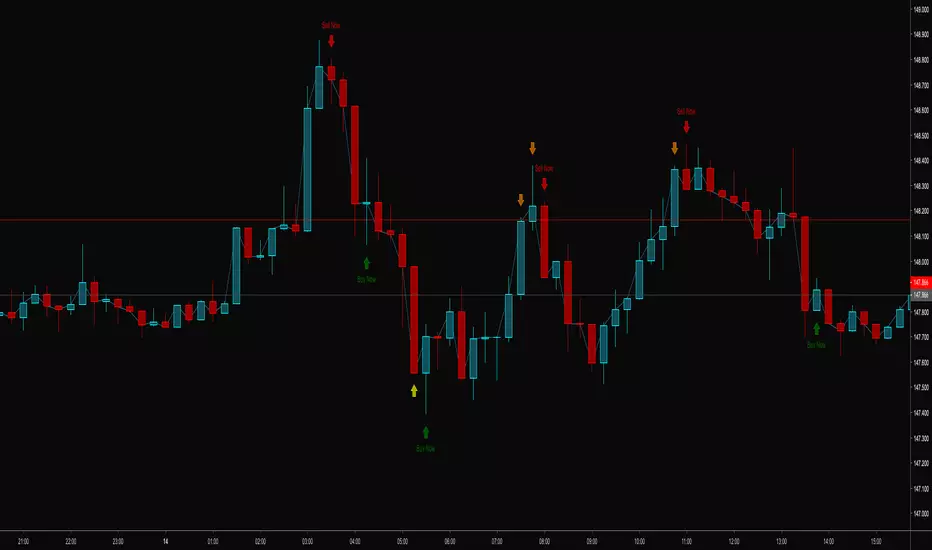
Impulse Volume Emiliano Mesa OscillatorThe impulse volume overlay, is the 1st part of my 2 part volume impulse indicator. The indicator has the sole purpose of measurearing a signifcant increase in the volume of either sellers or buyers and with the the help of a signal line suggest when there is an impulse in any of them.
How it works:
Yellow == No impulse... Market will most probably follow the trend
Red == Market has a seller increase
Lime == Market has a buyer increase
I DO NOT TAKE RESPONSABLITY FOR LOSSES. USE INDICATOR UNDER YOUR OWN RISK

Impulse Volume Emiliano Mesa OverlayThe impulse volume overlay, is the 2nd part of my 2 part volume impulse indicator. The indicator has the sole purpose of measurearing a signifcant increase in the volume of either sellers or buyers and with the the help of several EMA lines giving perfect entries. Results are very promising even in FOREX market... For now it has only been tested in 5 min charts.
How it works:
1) Check either if the price is in a down or up trend. So if the price is under both 100 and 200 EMA its down, and viceversa
2) If you have a down trend, wait for the overlay indicator to highlight the bars green, when the highlight stops enter a selling position, it is suggested you calculate your stop loss with the ATR. If the trend was going up, do the same with the red highlight.
3) Exit position when you feel like it, furthermore a trailing stop is suggested in order to maximize profit.
I DO NOT TAKE ANY RESPONSABILITY FOR LOSSES. USE INDICATOR UNDER YOUR OWN RISK.