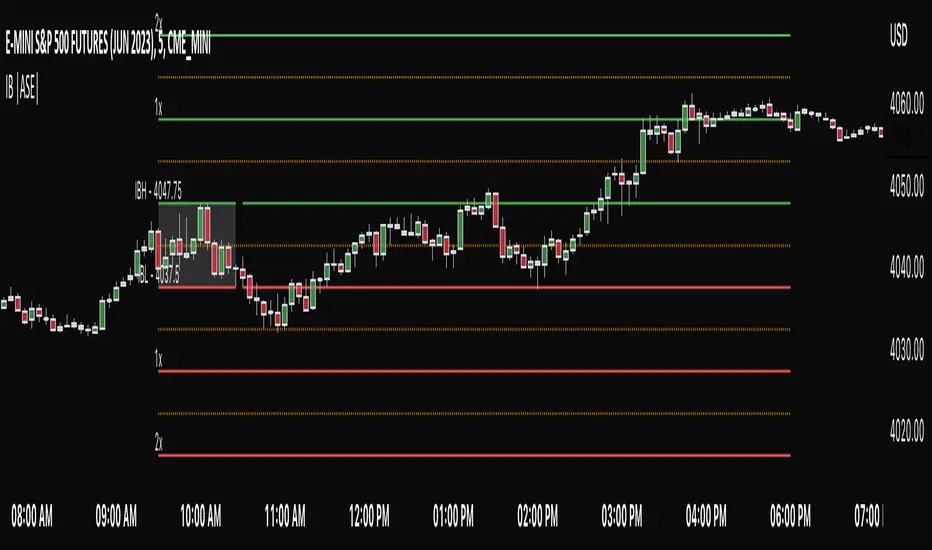
Nick's IB Break/Extension/Retest v3Initial Balance — Break / Extension / Retest (with continuation odds)
This indicator turns the first-hour Initial Balance behavior into a live decision-support tool. It marks the IB (09:30–10:30 ET by default), watches for the post-10:30 break, tracks how far price extends beyond the IB in fractions of the IB range (1.1× to 1.5×), and flags the first retest back to the IB level — then stamps the historical continuation base rate for the extension that was reached, colored by depth (shallow retests = green/likely re-entry, deep retests = red/likely top).
The continuation percentages are drawn from TradingStats 12-year NQ IB study. They are reach/continuation rates, not win rates — no stops or targets are modeled. Treat the numbers as context for a discretionary decision, not a signal with a proven edge.
Filters (all optional, all toggleable): a regime-EMA gate (only flag breaks that agree with the trend), a break-timing window, a minimum-extension requirement, MACD divergence (pre-kill before the retest + post-void after), and a MACD slope/level kill with an immediate-slope reprieve. Killed setups are tagged with the reason so you can see which filter acted. An optional RSI pop/dip trigger flags a precise entry after a valid retest.
Intrabar note (important): break/extension/retest/entry are detected by walking the 1-minute path inside each chart bar, so the sequence is read in true order rather than inferred from bar OHLC. As a result, signals on the currently-forming bar update as 1-minute bars print and are final only on bar close. Historical signals do not change. Run on a 3–15 minute chart (the chart timeframe must be higher than the intrabar timeframe).
Credits: continuation statistics from the TradingStats 12-year NQ first-hour IB study. Penunjuk

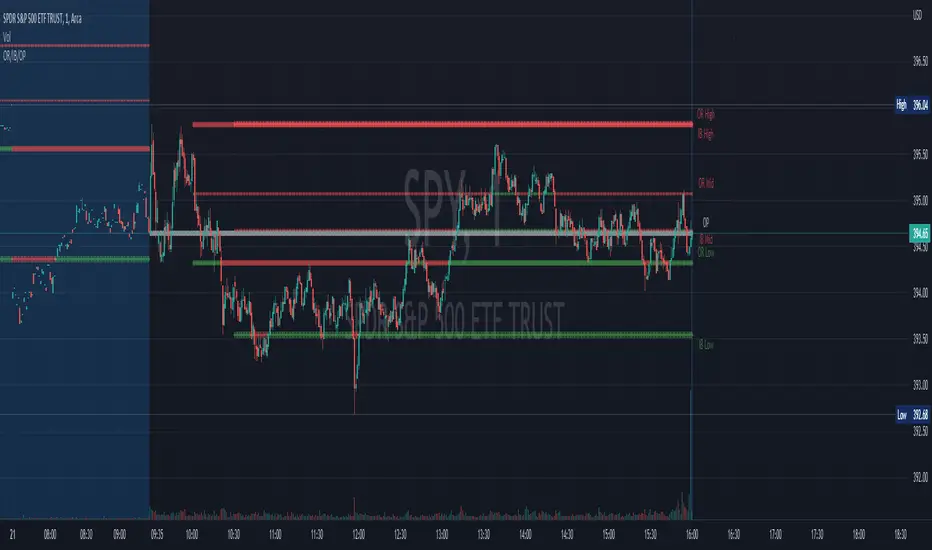
Opening Range Breakout & Liquidity EngineOpening Range Breakout & Liquidity Engine
Overview
A complete intraday opening-range-breakout engine. For each session it auto-detects the open, builds the opening range (the high–low band of the first N minutes, where the day's initial balance is set), and then does the three things most opening-range scripts leave out: it filters the day for tradability, it projects a trade map (targets and a stop) scaled to that day's own volatility, and it keeps an honest, on-chart win-rate tally of how often breaks actually reach their first target before the stop. It draws the structure and the map; it does not place orders. Analytical tool, not advice.
What makes it different — why these pieces are ONE engine (mashup rationale)
The opening range is the substrate — the reference band the whole day is measured against (ORH / ORL / midpoint).
The relative-volume ("in play") filter asks whether the range formed on above-average volume — the single biggest edge driver in the research. A break on a quiet day and a break on an active day are not the same event, so the engine measures the range's volume against a rolling average of prior sessions' opening-range volume and flags it.
The direction filter can require the break to agree with the opening-range candle's own direction, dropping the counter-range breaks that fare worst.
The accepted-break logic (close beyond the edge, optionally held a bar) separates a real initiative move from a wick.
The trade map projects targets (as range multiples or risk/R multiples) and a stop (opposite edge, range midpoint, or an ATR distance), so the plan scales to each day's volatility instead of fixed points — and reports the resulting R:R.
The win-rate harness closes the loop: it tracks every break until it tags target 1 or the stop and reports a real, path-aware Hit % and Edge on your instrument (optionally in-play only), logging unresolved breaks as end-of-day exits separately.
The failed-break module handles the other half of reality: a break that closes back inside the range traps breakout traders, so the engine flags it, projects the reversal to the opposite edge (stop at the failure extreme), and runs a second harness measuring how often that fade reaches the opposite edge before the failure is re-broken. A retest-hold flag marks the high-probability continuation entry; a trap flag marks both-edges-broken days; a range-state read (compressed / normal / wide) says what kind of break you're looking at.
Split apart, each piece is a fragment: a box without the filters is noise, targets without the harness are guesses, and a break with no failure case is half the picture. Chained, they answer one question — is this opening-range break worth taking here, and if it fails, is the fade? That interdependence is why it's a single engine, not a bundle.
What this adds over a standard opening-range script
Most ORB scripts stop at drawing the box and the two breakout lines. This engine adds the parts that decide and verify:
Relative-volume "in play" filter. Flags whether today's opening range formed on above-average volume — research-shown to be the dominant driver of opening-range edge — with an optional toggle to count only in-play days in the stats.
Range-direction filter. Optionally restricts breaks to the direction the opening-range candle closed, removing the weakest counter-range trades.
Volatility-scaled trade map. Targets as range or R (risk) multiples; stop at the opposite edge, the range midpoint, or an ATR distance — with the live R:R shown.
Path-aware win-rate harness. Tracks each break to target 1 or stop and reports an honest Hit % / Edge (vs a 50% coin-flip), counting end-of-day exits separately — a real, in-sample reality check, not a curve-fit claim.
Failed-break reversal module. Detects the break that closes back inside the range (a fakeout — research puts breakout failure rates in the 60–80% range), projects the fade toward the opposite edge with the failure extreme as its stop, and runs a second harness reporting how often the fade reaches that edge first. A failed break is often the better trade, and almost no ORB script measures it.
Retest-hold, trap and range-state context. A retest-hold flag marks the broken edge holding as support/resistance (the higher-probability continuation entry); a trap flag marks both-edges-broken whipsaw days; a range-state read (compressed / normal / wide vs the rolling average) says whether the break is likely to run or fail.
Reference levels with built-in legends. Current-day H/L, prior-day H/L (PDH/PDL) and prior-week H/L (PWH/PWL) — the most-watched intraday liquidity pools — are drawn as labelled lines that extend right, each tagged (DH/DL/PDH/PDL/PWH/PWL) so every line identifies itself. A Day position read shows whether price is above PDH, inside the prior-day range, or below PDL.
Liquidity-sweep detection, fused with the failure logic. A sweep — price wicks beyond PDH/PDL/PWH/PWL and closes back inside, taking the stops there — is flagged with a marker and in the dashboard. Because the opening-range edges are themselves prime liquidity, a failed ORB break that sweeps a level is the highest-conviction version of the fade; the engine ties the two together.
Institution-grade, readable visuals. Events are compact bar-anchored markers (triangle / cross / circle / flag) instead of stacked labels; key levels are drawn as glowing lines with bold colour-coded legend chips at the right edge; a legend-key panel decodes every mark and line; and only the most recent sessions' drawings are kept, so the chart stays clean even after months of history. The dashboard and legend key are theme-adaptive — they auto-match a light or dark chart background for proper contrast.
Auto-session that works where others break. New-session detection keys off a calendar-day change in the instrument's own timezone, so it resets correctly even on feeds with no out-of-session bars (NSE index futures only print 09:15–15:30) — where edge-detection scripts silently fail.
Fused decision dashboard. Break state, ORH/ORL, range, range state, range direction, relative volume / in-play, targets, stop, R:R, day position vs the prior day, liquidity-sweep status, the running Hit % / Edge, the failed-break fade and its Hit % / Edge, and retest/trap status — theme-adaptive to your chart.
How it works
Session: Auto groups by the instrument's trading day in its native timezone (works even with no out-of-session bars); Manual pins a window. Range: the high/low of the first N minutes become ORH/ORL; the midpoint is the pivot; the range candle's close-vs-open sets the range direction; its volume vs a rolling average gives the relative-volume "in play" read; its size vs a rolling average gives the range state (compressed / normal / wide). Break: the first close beyond ORH (long) or ORL (short) after the range completes, optionally held a bar and optionally restricted to the range direction. Map: targets = break edge + range multiples, or entry + risk (R) multiples; stop = opposite edge, range midpoint, or an ATR distance. Harness: each break is followed until it tags target 1 or the stop; unresolved breaks at the close are logged as end-of-day exits, separate from the Hit %. Failure: if an accepted break closes back inside the range it is flagged failed; the reversal targets the opposite edge with the failure extreme as stop, and a separate fade harness reports how often that reversal reaches the opposite edge before the failure extreme is re-broken. A retest of the broken edge that holds is flagged continuation; both edges breaking is flagged a trap. Levels: current-day H/L (tracked live), prior-day H/L and prior-week H/L (from the weekly series) are drawn as labelled lines (DH/DL, PDH/PDL, PWH/PWL) extending right. Liquidity: a sweep is a bar that wicks a set fraction of ATR beyond PDH/PDL/PWH/PWL then closes back inside — the stops there are taken and price rejects — flagged with a marker and in the dashboard alongside the day-position read.
How to use
Trade with an accepted break toward target 1 / 2, invalidated back inside the range (or at the chosen stop); favour in-play, range-direction and compressed-range breaks, and breaks that also clear PDH / PWH (genuine acceptance through liquidity) — all shown to carry the edge. When a break fails back inside, or sweeps a key level and rejects, the fade toward the opposite edge is often the better trade — the dashboard's fade Hit % / Edge tells you whether it has paid here. A retest that holds confirms continuation; a trap (both edges broken) is usually a stand-aside. Use the Hit % / Edge reads as a reality check before relying on any of it. Context for your decisions — not a standalone trigger.
Universal across markets (configurable data source)
High / low / close sources, the session mode / window / timezone and the range length are all inputs, so the engine runs on any instrument and intraday timeframe. Defaults target NSE NIFTY index futures with a first-15-minute range (the research tested 5 / 15 / 30 / 60 minutes; 5 was best on US single stocks). Change the sources, session and range for any other market. Use an intraday chart; the relative-volume filter needs a real volume feed and degrades gracefully without one.
Originality
The opening-range, fakeout-reversal and liquidity concepts are public (credited below); the original work is the assembly and the code — auto-session detection that works on instruments with no out-of-session bars, the relative-volume "in play" / range-direction / range-state filters, the range / R-multiple trade map with ATR stop and end-of-day exit, the path-aware win-rate harness, the failed-break reversal module with its own fade harness, and the reference-level + liquidity-sweep engine that ties the break to prior-day / prior-week liquidity. No third-party code is reused.
Companion drawings (TradingView compliance note)
Everything this plots is part of the one engine and is explained above — the opening-range box, the ORH/ORL/midpoint lines, the day/week reference levels (DH/DL, PDH/PDL, PWH/PWL) with their right-edge legends, the bar-anchored break / failed / retest / sweep markers, the target / stop / reversal lines, the legend-key panel, and the dashboard. There are no unrelated studies. Before publishing, clean the chart so only this indicator is shown.
Concept credit
The opening-range-breakout concept is long-standing market lore, formalised by Toby Crabel ("Day Trading with Short Term Price Patterns and Opening Range Breakout") and related to Mark B. Fisher's ACD method ("The Logical Trader"). The relative-volume "stocks in play" filter and the range-direction entry follow the empirical study of Zarattini, Barbon & Aziz (2023–24). The failed-breakout (fakeout) reversal and retest-hold continuation are classic price-action concepts, and prior-day / prior-week liquidity with the liquidity-sweep (stop-raid-then-reject) read are general price-action / Smart-Money-Concept ideas in wide public use. Implementation is original; not affiliated with, nor endorsed by, any third party, and no third-party code is reused.
Honesty / limitations
The Hit % is path-aware but in-sample, ignores costs and slippage, assumes the target/stop fills exactly at touch, and counts one break per session — descriptive context, not a verified backtest. Opening-range behaviour varies by instrument, session and regime. This engine maps structure; it does not predict which breaks will work.
Disclaimer
Research / educational only. NOT financial advice; no guarantee of profitability or accuracy. Indicators describe past behaviour; they do not predict the future. Trading carries risk of loss. Test out-of-sample and make your own decisions. The author accepts no liability Penunjuk

IB/ORB Statistical Mapper (hardcoded)# IB / ORB Live Stats — Publication Description
---
## What This Indicator Does
The **IB / ORB Live Stats** indicator studies the relationship between the **Initial Balance (IB)** and a user-defined **Opening Range Breakout (ORB)** window, and builds its probability statistics **live, from the history on your own chart** — there are no pre-supplied or hard-coded numbers anywhere in this script. Every percentage you see is computed from the completed sessions visible on the current symbol and timeframe, so the statistics describe exactly the instrument you are looking at.
Rather than issuing buy/sell signals, the indicator answers structural questions about how each session tends to behave:
- When the IB **high** forms before the IB **low**, which side tends to **break first** afterward — and vice versa?
- Does the side that formed first also tend to break first (a continuation tendency), or reverse?
- Do these tendencies change when the range is unusually **wide** or **narrow**?
- When the ORB closes bullish or bearish, how often does the IB end up bullish or bearish?
It draws a box and midpoint for both the IB and the ORB, and presents two independent, separately-configurable statistics tables — one for the IB, one for the ORB.
---
## Core Concepts and Definitions
Before the statistics make sense, it helps to define each term precisely as the script uses it.
### Initial Balance (IB)
The price range established during the IB window (default **09:30–10:30 ET**). The IB high is the highest traded price and the IB low the lowest traded price during that hour. The IB midpoint is the average of the two.
### Opening Range Breakout (ORB)
A shorter range measured from the open. You set its length in **minutes** (default **15**), and the script builds the corresponding session window automatically. The ORB high, low and midpoint are defined the same way as the IB's.
### Formed First (the order of the extremes)
For each window, "formed first" identifies whether the session **high** or the session **low** was reached **earlier in time**. This is the single most important measurement in the script, and it is deliberately **not** judged from chart bars. A single chart candle frequently contains both the session high and the session low, which makes any bar-by-bar guess unreliable. Instead, the script requests **1-minute intrabar data** and walks those sub-bars in chronological order: the first 1-minute bar whose high reaches the final session high, versus the first whose low reaches the final session low — whichever comes earlier is the extreme that "formed first."
### Broke First (the order of the breakouts)
Once a window's formation period closes, the script watches for price to trade **beyond** that window's high or low. "Broke first" records which side was exceeded **first** during the rest of the regular session. Like formed-first, this uses the 1-minute intrabar feed so a large chart candle cannot hide the true sequence. If neither side is exceeded before the regular session ends, broke-first is recorded as **"none" (Neither)**.
### Direction (Bullish / Bearish / Neutral)
A single composite read of the window, combining where it formed first with where it closed:
- **Bullish** — the **low** formed first **and** the window closed in its **upper** half.
- **Bearish** — the **high** formed first **and** the window closed in its **lower** half.
- **Neutral** — every other combination (mixed signals).
The same definition is applied to both the IB and the ORB so the two can be compared like-for-like.
### Range Size: Narrow / Normal / Wide
Each window's range (high minus low) is classified **relative to its own prior history on the chart**. The classification is computed **before** the current session is added to the history, so "Wide" genuinely means wide relative to the past, not relative to a sample that already includes today. Two methods are available:
- **Z-Score** — today's range is expressed as a number of standard deviations from the historical mean. A range at or below `−Z band` is **Narrow**; at or above `+Z band` is **Wide**; in between is **Normal**.
- **Percentile** — today's range is ranked against history. At or below the Narrow percentile cutoff it is **Narrow**; at or above the Wide cutoff it is **Wide**; in between is **Normal**.
---
## The Statistics Tables, Explained Line by Line
There are two tables — **IB LIVE STATS** and **ORB LIVE STATS** — each with the same structure. The ORB table adds one extra section (the ORB-to-IB contingency) at the bottom.
### Top block — today's live readout
- **Formed first** — for the current session: `HIGH`, `LOW`, `pending` (window not yet complete), or `—` (could not be resolved, e.g. no intrabar data).
- **Broke first** — `HIGH`, `LOW`, `pending` (window not complete), `watching…` (window complete, no break yet this session), or `none` (session ended with no break).
- **Range** — today's range value, followed where available by its z-score (`z=`) and its percentile rank (`%`) against history.
- **Type** — the Narrow / Normal / Wide classification of today's range.
- **Direction** — today's Bullish / Bearish / Neutral composite.
### Cross-tabulation block — the formed-first by broke-first matrix
This is the heart of the tool. It answers: *given which extreme formed first, which side then broke first?* The columns are **BrkH** (broke high first), **BrkL** (broke low first) and **Neither**. There are two rows:
- **HIGH (n)** — all completed sessions where the **high** formed first. The three percentages show how often, within those sessions, the high broke first, the low broke first, or neither side broke. `n` is the number of such sessions.
- **LOW (n)** — the same, for sessions where the **low** formed first.
Each row sums to 100% across its three columns. Reading across the HIGH row tells you, when the high formed first, whether the market tends to continue up (BrkH) or reverse down (BrkL).
- **Same side broke 1st** — a single summary figure: across **all** completed sessions, how often the side that formed first was also the side that broke first. This is the overall **continuation tendency**; a high value means formed-first tends to predict broke-first, a low value means the market tends to reverse the early extreme.
### BY SIZE block — does range size change behavior?
This block splits every completed session into its size bucket and reports, per bucket:
- **Size** — Narrow, Normal or Wide. The bucket matching **today's** session is highlighted.
- **n** — number of completed sessions in that bucket.
- **Brk%** — of those sessions, how often **any** side broke (i.e. the session was not a "Neither" day).
- **Cont%** — of those sessions, how often the side that formed first also broke first (the continuation tendency, but isolated to that size bucket).
This is where the size classification earns its place: you can see directly whether, say, Wide ranges break and continue more often than Narrow ones.
### ORB-to-IB contingency block (ORB table only)
This answers how the early ORB read relates to the later IB outcome. It is a small matrix with the columns **IB Bull**, **IB Bear** and **IB Neut**, and two rows:
- **Bullish (n)** — all completed days where the **ORB** direction was Bullish. The three percentages show how the **IB** direction turned out on those days. `n` is the count.
- **Bearish (n)** — the same, for days where the ORB direction was Bearish.
Each row sums to 100%. The Bullish row directly answers "when the ORB is bullish, how often is the IB also bullish, bearish, or neutral?"
### The "Min sample" dimming rule
Any percentage drawn from fewer completed days than the **Min sample** input is shown in grey rather than its normal colour. This is a guard against over-reading thin data — a 100% figure from 2 sessions is meaningless, and the dimming makes that visually obvious while still letting the count build.
---
## How To Use This Indicator
### Recommended setup
Run it on a **1-minute chart** for the most accurate formed-first and broke-first detection. A 5-minute chart is the practical maximum; on higher timeframes the 1-minute intrabar window loses resolution and the ordering of extremes becomes less reliable. Make sure your chart has enough history loaded — the statistics only accumulate from sessions actually present on the chart, so a fresh chart starts empty and fills in over days of scrolled-back or elapsed history.
### A typical workflow
1. **Let it build.** The longer the history on the chart, the larger every `n`. Figures stay greyed out until they pass the Min sample threshold.
2. **Read the cross-tab.** In the IB table, look at the HIGH and LOW rows to see whether the first extreme tends to lead to continuation or reversal on your instrument.
3. **Check the size split.** In the BY SIZE block, compare Brk% and Cont% across Narrow / Normal / Wide to see whether range size meaningfully changes behavior. Today's bucket is highlighted for quick reference.
4. **Use the ORB-to-IB contingency** to gauge whether the early ORB direction is informative about how the IB resolves.
5. **Combine with your own analysis.** These figures are descriptive context, not signals.
---
## Inputs and Configuration
Every input is listed below with its default and its effect.
### Sessions group
- **IB Period (ET)** — the Initial Balance window. Default `0930-1030`.
- **ORB Period (minutes from 09:30)** — the ORB length in minutes. Default `15`, range `1–120`. The script builds the actual session window from this (e.g. 15 → 09:30–09:45) so you never edit a session string for the ORB.
- **RTH (ET)** — the regular trading hours window during which breaks are tracked and after which each day's outcome is recorded. Default `0930-1600`.
- **Intrabar resolution** — the lower timeframe used for first-touch detection. Default `1` (one minute). This must be at or below your chart timeframe; one minute is strongly recommended.
### IB/ORB Type group
- **Size method** — `Z-Score` or `Percentile`, selecting how Narrow / Normal / Wide is decided. Default `Z-Score`.
- **Z band (Narrow<=-z, Wide>=+z)** — the z-score threshold used by the Z-Score method. Default `0.5`. A range at or below −0.5 SD is Narrow, at or above +0.5 SD is Wide.
- **Narrow <= percentile** — the percentile cutoff for Narrow when using the Percentile method. Default `33`.
- **Wide >= percentile** — the percentile cutoff for Wide when using the Percentile method. Default `67`.
### Display group
- **Show IB (box)** — draw the IB box and midpoint. Default on.
- **Show ORB (box)** — draw the ORB box and midpoint. Default on.
- **Show NY Open Line** — draw a vertical line at the regular-session open. Default on.
- **Box Transparency** — transparency of the box fills, `50–95`. Default `88` (higher is more transparent).
- **IB / ORB / NY Line colours** — colour pickers for each element.
### Tables group
- **Show IB Table** — master toggle for the IB statistics table. Default on.
- **IB Position** — one of nine on-chart positions for the IB table. Default Top Right.
- **IB Text Size** — Tiny / Small / Normal / Large. Default Tiny.
- **Show ORB Table** — master toggle for the ORB statistics table. Default on.
- **ORB Position** — nine-position selector for the ORB table. Default Top Left.
- **ORB Text Size** — Tiny / Small / Normal / Large. Default Tiny.
- **Min sample (dim below)** — the minimum number of completed days a percentage must be based on before it is shown in full colour rather than grey. Default `30`, range `5–200`.
---
## How the Calculations Work (methodology)
All statistics are computed on-chart, in real time, with no external data:
1. **During each window**, the script accumulates the running high and low and collects every 1-minute sub-bar's high and low.
2. **At window close (seal)**, it walks the collected 1-minute bars in order to determine which extreme was reached first, classifies the range size against prior history, computes the composite direction, and freezes the box and midpoint at the closing bar.
3. **After the window, through the regular session (watch)**, it scans the 1-minute feed for the first break of either side and records broke-first.
4. **At the regular-session close (tally)**, it increments the cumulative counters — the formed-first by broke-first cross-tab, the size buckets, and (for the ORB) the ORB-to-IB direction contingency — so each completed day is counted exactly once.
The boxes and midpoints are **frozen** at each window's close; they do not extend across the day.
---
## Important Limitations and Considerations
1. **History-dependent.** All statistics come only from sessions present on your chart. A fresh chart has no sample; figures grow over time and stay greyed until they pass the Min sample threshold. The depth of history TradingView loads depends on your plan and the chart timeframe.
2. **Intrabar accuracy.** Formed-first and broke-first rely on the 1-minute feed and are most accurate at or below 5-minute chart resolution. On higher timeframes the ordering can be wrong.
3. **Same-sub-bar ties.** If a single 1-minute bar contains both a new extreme and a break of the opposite side simultaneously, the tie is resolved in favour of the high. This is rare but worth knowing.
4. **Descriptive, not predictive.** The indicator reports what has happened on your data. It does not forecast, and it issues no signals. Past frequency does not guarantee future behavior — a 70% tendency still failed 30% of the time.
5. **Not financial advice.** Use these statistics as objective context alongside your own strategy and risk management, never as a substitute for judgement.
---
*This is an analytical and educational tool. It does not provide buy or sell signals and makes no claim about future price direction.* Penunjuk

IB / ORB Live Stats# IB / ORB Live Stats — Publication Description
---
## What This Indicator Does
The **IB / ORB Live Stats** indicator studies the relationship between the **Initial Balance (IB)** and a user-defined **Opening Range Breakout (ORB)** window, and builds its probability statistics **live, from the history on your own chart** — there are no pre-supplied or hard-coded numbers anywhere in this script. Every percentage you see is computed from the completed sessions visible on the current symbol and timeframe, so the statistics describe exactly the instrument you are looking at.
Rather than issuing buy/sell signals, the indicator answers structural questions about how each session tends to behave:
- When the IB **high** forms before the IB **low**, which side tends to **break first** afterward — and vice versa?
- Does the side that formed first also tend to break first (a continuation tendency), or reverse?
- Do these tendencies change when the range is unusually **wide** or **narrow**?
- When the ORB closes bullish or bearish, how often does the IB end up bullish or bearish?
It draws a box and midpoint for both the IB and the ORB, and presents two independent, separately-configurable statistics tables — one for the IB, one for the ORB.
---
## Core Concepts and Definitions
Before the statistics make sense, it helps to define each term precisely as the script uses it.
### Initial Balance (IB)
The price range established during the IB window (default **09:30–10:30 ET**). The IB high is the highest traded price and the IB low the lowest traded price during that hour. The IB midpoint is the average of the two.
### Opening Range Breakout (ORB)
A shorter range measured from the open. You set its length in **minutes** (default **15**), and the script builds the corresponding session window automatically. The ORB high, low and midpoint are defined the same way as the IB's.
### Formed First (the order of the extremes)
For each window, "formed first" identifies whether the session **high** or the session **low** was reached **earlier in time**. This is the single most important measurement in the script, and it is deliberately **not** judged from chart bars. A single chart candle frequently contains both the session high and the session low, which makes any bar-by-bar guess unreliable. Instead, the script requests **1-minute intrabar data** and walks those sub-bars in chronological order: the first 1-minute bar whose high reaches the final session high, versus the first whose low reaches the final session low — whichever comes earlier is the extreme that "formed first."
### Broke First (the order of the breakouts)
Once a window's formation period closes, the script watches for price to trade **beyond** that window's high or low. "Broke first" records which side was exceeded **first** during the rest of the regular session. Like formed-first, this uses the 1-minute intrabar feed so a large chart candle cannot hide the true sequence. If neither side is exceeded before the regular session ends, broke-first is recorded as **"none" (Neither)**.
### Direction (Bullish / Bearish / Neutral)
A single composite read of the window, combining where it formed first with where it closed:
- **Bullish** — the **low** formed first **and** the window closed in its **upper** half.
- **Bearish** — the **high** formed first **and** the window closed in its **lower** half.
- **Neutral** — every other combination (mixed signals).
The same definition is applied to both the IB and the ORB so the two can be compared like-for-like.
### Range Size: Narrow / Normal / Wide
Each window's range (high minus low) is classified **relative to its own prior history on the chart**. The classification is computed **before** the current session is added to the history, so "Wide" genuinely means wide relative to the past, not relative to a sample that already includes today. Two methods are available:
- **Z-Score** — today's range is expressed as a number of standard deviations from the historical mean. A range at or below `−Z band` is **Narrow**; at or above `+Z band` is **Wide**; in between is **Normal**.
- **Percentile** — today's range is ranked against history. At or below the Narrow percentile cutoff it is **Narrow**; at or above the Wide cutoff it is **Wide**; in between is **Normal**.
---
## The Statistics Tables, Explained Line by Line
There are two tables — **IB LIVE STATS** and **ORB LIVE STATS** — each with the same structure. The ORB table adds one extra section (the ORB-to-IB contingency) at the bottom.
### Top block — today's live readout
- **Formed first** — for the current session: `HIGH`, `LOW`, `pending` (window not yet complete), or `—` (could not be resolved, e.g. no intrabar data).
- **Broke first** — `HIGH`, `LOW`, `pending` (window not complete), `watching…` (window complete, no break yet this session), or `none` (session ended with no break).
- **Range** — today's range value, followed where available by its z-score (`z=`) and its percentile rank (`%`) against history.
- **Type** — the Narrow / Normal / Wide classification of today's range.
- **Direction** — today's Bullish / Bearish / Neutral composite.
### Cross-tabulation block — the formed-first by broke-first matrix
This is the heart of the tool. It answers: *given which extreme formed first, which side then broke first?* The columns are **BrkH** (broke high first), **BrkL** (broke low first) and **Neither**. There are two rows:
- **HIGH (n)** — all completed sessions where the **high** formed first. The three percentages show how often, within those sessions, the high broke first, the low broke first, or neither side broke. `n` is the number of such sessions.
- **LOW (n)** — the same, for sessions where the **low** formed first.
Each row sums to 100% across its three columns. Reading across the HIGH row tells you, when the high formed first, whether the market tends to continue up (BrkH) or reverse down (BrkL).
- **Same side broke 1st** — a single summary figure: across **all** completed sessions, how often the side that formed first was also the side that broke first. This is the overall **continuation tendency**; a high value means formed-first tends to predict broke-first, a low value means the market tends to reverse the early extreme.
### BY SIZE block — does range size change behavior?
This block splits every completed session into its size bucket and reports, per bucket:
- **Size** — Narrow, Normal or Wide. The bucket matching **today's** session is highlighted.
- **n** — number of completed sessions in that bucket.
- **Brk%** — of those sessions, how often **any** side broke (i.e. the session was not a "Neither" day).
- **Cont%** — of those sessions, how often the side that formed first also broke first (the continuation tendency, but isolated to that size bucket).
This is where the size classification earns its place: you can see directly whether, say, Wide ranges break and continue more often than Narrow ones.
### ORB-to-IB contingency block (ORB table only)
This answers how the early ORB read relates to the later IB outcome. It is a small matrix with the columns **IB Bull**, **IB Bear** and **IB Neut**, and two rows:
- **Bullish (n)** — all completed days where the **ORB** direction was Bullish. The three percentages show how the **IB** direction turned out on those days. `n` is the count.
- **Bearish (n)** — the same, for days where the ORB direction was Bearish.
Each row sums to 100%. The Bullish row directly answers "when the ORB is bullish, how often is the IB also bullish, bearish, or neutral?"
### The "Min sample" dimming rule
Any percentage drawn from fewer completed days than the **Min sample** input is shown in grey rather than its normal colour. This is a guard against over-reading thin data — a 100% figure from 2 sessions is meaningless, and the dimming makes that visually obvious while still letting the count build.
---
## How To Use This Indicator
### Recommended setup
Run it on a **1-minute chart** for the most accurate formed-first and broke-first detection. A 5-minute chart is the practical maximum; on higher timeframes the 1-minute intrabar window loses resolution and the ordering of extremes becomes less reliable. Make sure your chart has enough history loaded — the statistics only accumulate from sessions actually present on the chart, so a fresh chart starts empty and fills in over days of scrolled-back or elapsed history.
### A typical workflow
1. **Let it build.** The longer the history on the chart, the larger every `n`. Figures stay greyed out until they pass the Min sample threshold.
2. **Read the cross-tab.** In the IB table, look at the HIGH and LOW rows to see whether the first extreme tends to lead to continuation or reversal on your instrument.
3. **Check the size split.** In the BY SIZE block, compare Brk% and Cont% across Narrow / Normal / Wide to see whether range size meaningfully changes behavior. Today's bucket is highlighted for quick reference.
4. **Use the ORB-to-IB contingency** to gauge whether the early ORB direction is informative about how the IB resolves.
5. **Combine with your own analysis.** These figures are descriptive context, not signals.
---
## Inputs and Configuration
Every input is listed below with its default and its effect.
### Sessions group
- **IB Period (ET)** — the Initial Balance window. Default `0930-1030`.
- **ORB Period (minutes from 09:30)** — the ORB length in minutes. Default `15`, range `1–120`. The script builds the actual session window from this (e.g. 15 → 09:30–09:45) so you never edit a session string for the ORB.
- **RTH (ET)** — the regular trading hours window during which breaks are tracked and after which each day's outcome is recorded. Default `0930-1600`.
- **Intrabar resolution** — the lower timeframe used for first-touch detection. Default `1` (one minute). This must be at or below your chart timeframe; one minute is strongly recommended.
### IB/ORB Type group
- **Size method** — `Z-Score` or `Percentile`, selecting how Narrow / Normal / Wide is decided. Default `Z-Score`.
- **Z band (Narrow<=-z, Wide>=+z)** — the z-score threshold used by the Z-Score method. Default `0.5`. A range at or below −0.5 SD is Narrow, at or above +0.5 SD is Wide.
- **Narrow <= percentile** — the percentile cutoff for Narrow when using the Percentile method. Default `33`.
- **Wide >= percentile** — the percentile cutoff for Wide when using the Percentile method. Default `67`.
### Display group
- **Show IB (box)** — draw the IB box and midpoint. Default on.
- **Show ORB (box)** — draw the ORB box and midpoint. Default on.
- **Show NY Open Line** — draw a vertical line at the regular-session open. Default on.
- **Box Transparency** — transparency of the box fills, `50–95`. Default `88` (higher is more transparent).
- **IB / ORB / NY Line colours** — colour pickers for each element.
### Tables group
- **Show IB Table** — master toggle for the IB statistics table. Default on.
- **IB Position** — one of nine on-chart positions for the IB table. Default Top Right.
- **IB Text Size** — Tiny / Small / Normal / Large. Default Tiny.
- **Show ORB Table** — master toggle for the ORB statistics table. Default on.
- **ORB Position** — nine-position selector for the ORB table. Default Top Left.
- **ORB Text Size** — Tiny / Small / Normal / Large. Default Tiny.
- **Min sample (dim below)** — the minimum number of completed days a percentage must be based on before it is shown in full colour rather than grey. Default `30`, range `5–200`.
---
## How the Calculations Work (methodology)
All statistics are computed on-chart, in real time, with no external data:
1. **During each window**, the script accumulates the running high and low and collects every 1-minute sub-bar's high and low.
2. **At window close (seal)**, it walks the collected 1-minute bars in order to determine which extreme was reached first, classifies the range size against prior history, computes the composite direction, and freezes the box and midpoint at the closing bar.
3. **After the window, through the regular session (watch)**, it scans the 1-minute feed for the first break of either side and records broke-first.
4. **At the regular-session close (tally)**, it increments the cumulative counters — the formed-first by broke-first cross-tab, the size buckets, and (for the ORB) the ORB-to-IB direction contingency — so each completed day is counted exactly once.
The boxes and midpoints are **frozen** at each window's close; they do not extend across the day.
---
## Important Limitations and Considerations
1. **History-dependent.** All statistics come only from sessions present on your chart. A fresh chart has no sample; figures grow over time and stay greyed until they pass the Min sample threshold. The depth of history TradingView loads depends on your plan and the chart timeframe.
2. **Intrabar accuracy.** Formed-first and broke-first rely on the 1-minute feed and are most accurate at or below 5-minute chart resolution. On higher timeframes the ordering can be wrong.
3. **Same-sub-bar ties.** If a single 1-minute bar contains both a new extreme and a break of the opposite side simultaneously, the tie is resolved in favour of the high. This is rare but worth knowing.
4. **Descriptive, not predictive.** The indicator reports what has happened on your data. It does not forecast, and it issues no signals. Past frequency does not guarantee future behavior — a 70% tendency still failed 30% of the time.
5. **Not financial advice.** Use these statistics as objective context alongside your own strategy and risk management, never as a substitute for judgement.
---
*This is an analytical and educational tool. It does not provide buy or sell signals and makes no claim about future price direction.* Penunjuk

AlgoStorm Institutional Key Levels (IKL)AlgoStorm Institutional Key Levels (IKL)
For US Index Futures and DAX.
An institutional-grade structural mapping tool built on actual Auction Market Theory (AMT) to track the true liquidity and volume nodes across centralized futures markets.
The retail trading industry has heavily distorted the word "institutional," convincing traders that algorithms are hunting their stop-losses at random pivot highs. The reality is far more objective. Real institutions, hedge funds, and market makers rely on definitive, centralized exchange volume, liquidity depth, and execution algorithms (VWAP/TWAP) to scale into positions without causing market impact.
The AlgoStorm Institutional Key Levels (IKL) indicator maps the precise mathematical benchmarks that dictate this capital flow. Designed for markets with centralized volume (CME, Eurex), it plots highly accurate session opens, Opening Ranges, Initial Balances, and Value Areas, stripping away retail noise to provide a professional framework for your intraday bias.
Technical Specifications & Architecture
Supported Markets: Universal application for centralized futures markets including US Indices (ES, NQ, YM, RTY) and European Indices (DAX/FDAX, FDXM).
Supported Timeframes: Designed specifically for 2-minute through 30-minute charts . (Note: Due to the historical buffers required for multi-session mapping, Pine Script will reject timeframes below 2-minutes).
Timezone Mastery: Flawlessly handles Daylight Saving Time (DST) transitions natively. US Futures are bound strictly to America/New_York , while DAX/Eurex Futures are strictly bound to Europe/Berlin .
Fixed-Pool Drawing Engine: Most level indicators suffer from memory bloat and chart lag due to constant object creation and garbage collection limits. The IKL utilizes a highly optimized "fixed-pool" architecture. Lines and labels are generated only once on the first bar and recycled dynamically.
Smart Label Stagger: Features a forward-pass algorithm that detects and pushes overlapping labels apart (user-adjustable separation), ensuring your chart remains pristine regardless of price compression.
US Futures Mapping (ES / NQ / YM / RTY)
All inputs trigger based on standard America/New_York session times.
Globex Structure: Previous Day High/Low (Full 18:00–17:00 session) and Overnight High/Low (18:00 to 09:30 ET).
RTH Anchors: Previous Day Close (PDC) locked exactly at the 16:00 ET cash close, and the RTH Open (09:30 ET) held all day.
Gap Fill Zone: Automatically draws an asynchronous highlight box between the PDC and current RTH open if an unfilled gap of more than 2 ticks exists.
Auction Metrics: 15-minute Opening Range (09:30–09:45 ET) and the standard Initial Balance (09:30–10:30 ET) with optional 100%, 150%, and 200% IB extension bands.
Eurex / DAX Futures Mapping (FDAX / FDXM)
A complete, standalone module built for the complex, multi-open nature of European futures. Based on Europe/Berlin time.
Asian / Pre-London Phase: Tracks Eurex overnight high/low from 01:00 CET until Frankfurt liquidity arrives at 08:00 CET.
Euro / Frankfurt Session: Plots the 08:00 CET Open and the 30-minute Euro Opening Range (08:00–08:30 CET).
Xetra Cash Session: Plots the definitive Xetra Open (09:00 CET), Xetra OPR (09:00–09:30 CET), and the Previous Xetra Close (17:30 CET) which acts as the DAX equivalent to the US PDC.
US Open Impact: Captures the 15:30 CET open and 30-minute OPR, marking the massive liquidity injection when US equity markets open.
Execution & Volume Mechanics
Algorithmic VWAPs: Plots the exact Daily and Session VWAP bands used by institutional execution desks to grade their fills. Features a full Globex Daily VWAP (resets 18:00 ET), a localized NY VWAP (resets 09:30 ET), and a dedicated Xetra VWAP (resets 09:00 CET).
Custom Value Area Engine: Features a built-in, manual array-based Volume Profile engine. It calculates the Point of Control (POC) and Value Area High/Low (VAH/VAL) for both RTH and Xetra sessions independently, bypassing standard Pine Script volume limitations. Users can customize the Value Area % and price-row tick size.
Penunjuk

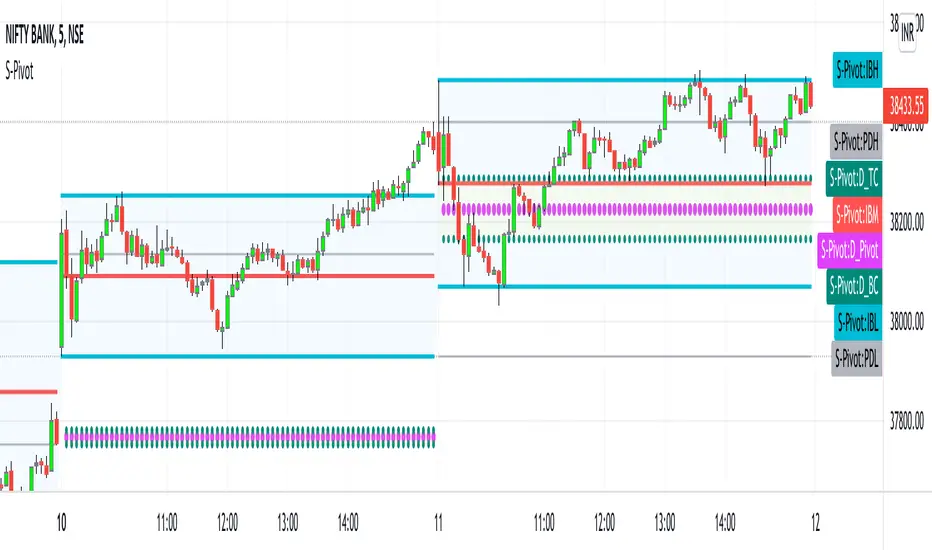
Initial Balance Breakout [samjNQ] v3---samjNQ Initial Balance Breakout strategy---
**Initial Balance Breakout — Strategy Description**
Trades breakouts of the first-hour Initial Balance on the Micro E-mini S&P 500 (MES1!) using a clean set of filters to avoid noise and low-quality setups.
**How it works:**
The Initial Balance (IB) is defined as the high and low of the 9:30–10:30 AM ET window — the first hour of Regular Trading Hours. Once that window closes and the IB locks, the strategy waits for price to break above the IB High (long) or below the IB Low (short) during the trade window (10:30 AM–2:30 PM ET).
**Filters applied:**
- **VWAP trend filter** — only takes long breakouts when price is above VWAP, and short breakouts when price is below. Avoids trading against intraday momentum.
- **IB range filter** — skips days where the IB is too narrow (choppy, commissions eat returns) or too wide (extensions become unreachable). Configurable min/max in points.
- **2:30 PM cutoff** — no new entries in the last 90 minutes of the session. Late breakouts rarely have time to reach targets.
- **One trade per direction per day** — no re-entries after a stop-out.
**Exits:**
- Stop: opposite IB level (IB Low for longs, IB High for shorts)
- Target: 1.5× the IB range beyond the breakout level
- EOD flat: any open position is closed at 3:55 PM ET
**Chart visuals:**
- Yellow background = IB building window
- Blue lines = IB High / IB Low / Midpoint
- Green lines = long extension targets (T1 / T2)
- Red lines = short extension targets (T1 / T2)
- Orange line = VWAP
- Gray background = day filtered out by range rules
**Settings:** All parameters are adjustable — IB window, trade window, target multiples, stop mode, range filter thresholds, and VWAP filter toggle.
Built and backtested on MES1! 5-minute chart. Commission set to $2.25/contract, 1-tick slippage included.
--- Strategi

Smooths IB MapSmooths IB Map — Initial Balance Probability Engine
Overview
Smooths IB Map is an Initial Balance indicator built around a statistical probability engine rather than simple level plotting. The Initial Balance (IB) is the price range established during the first hour of the regular trading session (9:30–10:30 ET by default). This range has long been used by institutional and retail traders as a reference for the day's expected price behavior — price frequently sweeps one or both IB extremes before reversing or continuing. This indicator quantifies that tendency and makes it actionable.
What makes this different
1 — Timeframe-independent data collection. Most IB indicators compute statistics directly from chart bars. This means the sample size — and therefore the probabilities — change depending on which timeframe the chart is set to. A 1-minute chart may only hold 16 days of history while a 15-minute chart holds 240, producing completely different numbers from the same lookback setting. This indicator solves that problem by anchoring all data collection inside request.security("5") — a fixed 5-minute reference feed. Probabilities are identical on any chart timeframe.
2 — Exponential decay weighted probability. A raw historical average gives equal weight to a sweep that happened 200 days ago and one that happened last week. This indicator applies exponential decay (factor 0.85 per day of age) so that recent sessions contribute proportionally more to the probability estimate. When market regime shifts, the indicator adapts faster than a simple percentage would.
3 — Range-conditional probability. Every historical IB day is classified as SMALL (<70% of the historical average range), NORMAL (70–130%), or LARGE (>130%). The indicator then computes the IBH and IBL sweep rate specifically for days that match today's size bucket. If today's IB is unusually tight, the conditional column in the table shows the sweep rate from similar tight-range days only — a more relevant reference than the overall average.
4 — First-break direction tracking. The table shows what percentage of historical days saw the IBH break first vs the IBL break first vs both sweeping on the same bar. Over a large enough sample this can reveal directional tendencies for specific instruments and sessions.
5 — Failed retest signal. After a level is swept, price often pulls back to retest it from the other side. If the retesting candle closes back on the swept side (confirming rejection), the level has flipped from resistance to support or vice versa. The indicator detects this condition and plots a colored circle directly on the wick of the confirming bar — one signal per level per day, first confirmed retest only.
How to use it
Add the indicator to any intraday chart (1m through 60m). Set your IB Open and IB Close times to match your instrument's session. Set the Data Cutoff to the time after which you do not want sweeps counted — for US equities, 16:00 ET is appropriate. Increase the Lookback Days to the maximum your plan supports (the tooltip explains approximate limits by plan). The probability labels display inside the IB box as a percentage — green indicates a historically high sweep rate (≥65%), red indicates low (≤35%), and white is neutral. The third column of the data table shows the conditional probability for today's IB size bucket. A teal circle on a bar's low signals a bullish failed retest of the IBH. A red circle on a bar's high signals a bearish failed retest of the IBL. All four alert conditions (IB formed, IBH swept, IBL swept, failed retest) are available for notification.
Notes
Designed and built for MNQ/NQ futures but compatible with any intraday instrument. A minimum of 5 completed historical sessions is required before probability values are shown. Statistics are always computed from completed days only — the current in-progress session is excluded. The failed retest signal requires the sweep to have been established on at least one prior bar before it can trigger, preventing false fires on the original sweep candle itself. Penunjuk

Penunjuk

Nexus Global Initial Balance (IB)📝 Publication Description
Title: Nexus Global Initial Balance (IB) : Institutional Flow & Macro Confluence System
Overview
The Nexus Global Initial Balance (IB) is a sophisticated volatility-mapping engine designed for elite index and forex traders. It utilizes the Initial Balance (IB)—the critical first 60 minutes of the Tokyo, London, and New York sessions—to establish the "Structural DNA" of the trading day.
While most traders focus on simple breakouts, this indicator uncovers the hidden institutional "pivot zones" by overlapping session volatility with macro-structural Fibonacci context. It identifies where the "Big Money" is likely to defend positions and where trend expansions are mathematically projected to exhaust.
Key Institutional Features:
Triple-Session IB Architecture: Dynamic, color-coded 1-hour ranges for Tokyo (JST), London (GMT/BST), and New York (EST/EDT).
The Session Golden Zone: Automated shading of the 50% – 61.8% retracement area within each IB box, identifying the high-probability "Institutional Re-entry" zone.
Macro-to-Micro Confluence Engine: A master HTF source toggle that scans higher timeframes (15m to Daily) for structural Fibonacci levels and highlights them as "Institutional Pivots" when they intersect with your session range.
Trend-Based Expansion Projections: Algorithmic price targets based on Fibonacci extensions (0.618, 1.272, 1.618) to define precise take-profit areas.
Pro-Tier Visual Customization: Full control over line weights, styles (Dashed/Dotted/Solid), and session colors to maintain a clean, high-performance trading environment.
📈 The "Nexus Method": Professional Trading Rules
To trade this indicator successfully, follow these institutional protocols:
Rule 1: Establish the "Macro Bias"
The Check: Before the session opens, check the HTF 50% Level (the Daily or 4-hour midpoint).
The Rule: If the price is trading above the HTF 50%, look for Bullish IB breakouts. If below, look for Bearish IB breakdowns.
Rule 2: The "Golden Zone" Retest (Highest Probability)
Setup: Wait for the 1-hour IB range to form.
Action: If the price breaks out of the IBH (High), do not chase it. Wait for a pullback into the shaded Golden Zone (50-61.8%) within the box.
Confirmation: Look for an Institutional Pivot (Red line) sitting inside that Golden Zone.
Entry: Buy when price touches the confluence of the Golden Zone and the Institutional Pivot.
Stop Loss: 5 ticks below the IBL (Low).
Rule 3: The "Expansion Target" Protocol
Take Profit 1 (0.618 Ext): Move stop-loss to Breakeven. This is the "Safety Target."
Take Profit 2 (1.272 Ext): The institutional target for "Trend Days." Close 75% of the position here.
Take Profit 3 (1.618 Ext): The "Exhaustion Point." Close the remainder of the position.
Rule 4: The "Failed IB" (Mean Reversion)
The Setup: Price breaks the IBH but cannot reach the 0.618 extension and falls back into the box.
The Rule: This is a "Range Day." Target the opposite side of the box (IBL). This usually occurs when there is no confluence between the session range and the HTF levels.
Rule 5: Session Synergy
Always watch the Tokyo IB levels during the London open. If London opens inside the Tokyo Golden Zone, it often indicates a massive expansion move is coming as the two sessions' liquidity pools overlap. Penunjuk

Initial Balance Breaks [NQ stats x CantoLab]An open source indicator built around the Initial Balance break statistics from NQ Stats (nqstats.com). Credit to NQ Stats for the original research — published here with permission.
⚠️ Important
This is a statistical study indicator. It does not guarantee that the IB high or low will be hit. Over a large sample, this is the expected behaviour based on 10 years of NQ data. It is best combined with other confluences to confirm direction — this indicator alone is not a strategy.
What is the Initial Balance?
The Initial Balance (IB) is the price range established during the first hour of the New York equity session — 09:30 to 10:30 ET. The high and low set within this window become key levels for the rest of the trading day.
Based on 10 years of NQ data, IB breaks 83% of the time before noon and 96% of the time before 4:00 PM. The stat alone doesn't give you direction — but combined with where the IB closes relative to its own midpoint, you get a directional edge:
IB closes in the upper half → high breaks 82% of the time
IB closes in the lower half → low breaks 76% of the time
What it does
Once the IB window closes at 10:30, the indicator plots the IB High, Low and Mid as levels on the chart and automatically determines the directional bias based on where price closed within the IB range.
The expected break side is labelled with its probability and a tracking line extends forward tracking whether that level gets hit. When the level is breached the label updates to show Success or Failed in real time.
IB High — upper boundary of the initial balance range
IB Low — lower boundary of the initial balance range
IB Mid — equilibrium of the range, plotted in orange.
When price closes above mid, high break is expected.
When price close below mid, low break is expected.
Probability line — extends from IB close forward on the expected side, updates to Success or Failed when hit
Settings
IB Time — configurable session window, default 09:30–10:30 NY time
Label Size — Tiny / Small / Normal / Large / Huge
Per-level line style and width — IB High, Low, Mid and vertical markers
Auto color — IB High and Low auto-adapt to chart theme, or set manually
Notes
Built for NQ Futures. Behaviour on other instruments is untested
All times are New York time
Current version tracks directional bias from IB close relative to midpoint. The 83% before noon and 96% before 4PM time-based breach tracking and IB formation order confluence are not yet implemented
Probability data derived from 10 years of NQ historical data by NQ Stats.
This indicator does not provide financial advice or a complete strategy. You are responsible for how you build around and execute on this data
Penunjuk

Penunjuk

Session Strata Mapper [JOAT]
Session Strata Mapper
Introduction
Session Strata Mapper is an overlay indicator that tracks three critical intraday price levels in real time: the Premarket session range (04:00-09:30 ET), the Initial Balance range (09:30-10:30 ET), and the Previous Day's high, low, and midpoint. These levels are rendered as dynamic zones that expand as each session progresses and extend as horizontal reference lines throughout the trading day. Extension projections above and below the Initial Balance provide potential target levels based on the established morning range.
Session-based levels represent areas where institutional participation was concentrated during distinct time periods. The premarket range reflects the overnight positioning of market participants before retail hours begin. The Initial Balance captures the price range set by the first hour of regular trading, a period often dominated by institutional order flow. Violations of these levels, especially when accompanied by volume, frequently signal meaningful directional commitment from large participants.
Core Concepts
1. Session Detection and Range Building
Sessions are detected using TradingView's time() function with a configurable timezone (default: America/New_York). The premarket range builds bar by bar during the 04:00-09:30 window, tracking the running high and low. The Initial Balance does the same during 09:30-10:30. All objects (boxes, lines, labels) update in real time as each session progresses.
2. Initial Balance Extensions
The IB range can optionally project extension levels above and below at 0.5x IB multiples. Extensions are labeled IB +1x, IB +2x, etc. These project the IB range beyond the session boundaries and serve as potential continuation targets when price breaks from the IB.
3. Previous Day Levels
The previous trading day's high, low, and midpoint are tracked by detecting session-start bars and storing the completed day's range. These levels extend throughout the current session as dashed reference lines and are updated at the start of each new day.
4. Zone Boxes and Line Rendering
Each session's range is rendered as a filled zone box that expands during the session and then remains fixed after the session ends. Horizontal lines extend from the session boundaries into the future trading period, providing ongoing reference as price interacts with those levels throughout the day.
Features
Premarket Range Zone: Live-building box with high, low, and optional midpoint lines
Initial Balance Zone: Live-building box with high, low, midpoint, and extension projections
Previous Day Levels: Prior session high, low, and midpoint as dashed reference lines
Extension Lines: Up to 4 levels of IB extension projections with optional labels
Dashboard: Real-time level values and whether price is currently above or below each key level
Configurable Timezone: Works for multiple market sessions globally
Label Size and Line Width Controls
Input Parameters
Timezone: Market-specific timezone for session detection
Show Premarket, IB, Previous Day: Individual toggles
IB Extension Levels: Number of extension multiples to show (0-4)
Color inputs for each session type
Label size and line width settings
How to Use This Indicator
Premarket Range as Reference
Price trading above the premarket high at the regular session open is constructive. A break below the premarket low often draws bearish attention. The premarket midpoint frequently acts as intraday support or resistance.
Initial Balance Breakouts
When price breaks above the IB high with momentum, the extension levels provide natural targets. An IB high breakout that reaches IB +1x suggests continuation may carry to IB +2x. Reversals from IB extension levels are also common.
Previous Day Level Confluences
When the premarket or IB range aligns closely with the previous day's high or low, that confluence represents an area where two independent session-based reference points agree — a stronger potential reaction zone.
Limitations
Session detection requires intraday data. The indicator is not meaningful on daily or higher timeframes
Some brokers and data providers do not include premarket data. On charts without premarket bars, the premarket range will be empty
Extension levels are mechanical projections of the IB range. They are reference points, not guaranteed targets
The Previous Day tracking resets on each new session. On instruments that trade continuously (such as some crypto markets), the day boundary is user-defined by the timezone setting
Originality Statement
The integration of three distinct session types (premarket, initial balance, and previous day) within a single dynamically updating visualization system provides a consolidated view that would otherwise require multiple separate tools. The live-expanding zone boxes with simultaneous line extension represent a unified approach to session level tracking. The IB extension projection system is built around the specific multiples used by institutional traders who apply IB methodology.
Disclaimer
This indicator is for educational and informational purposes only. Session levels are historical reference points and do not predict future price reactions. Price can and regularly does pass through any level without reaction. Use in conjunction with other analysis and always apply proper risk management.
-Made with passion by officialjackofalltrades
Penunjuk

Quantum Liquidity Map - VP, VWAP & CVD Confluence [NikaQuant]Info:
An overlay that combines three institutional order-flow methods — visible-range Volume Profile, session-anchored VWAP with standard-deviation bands, and Cumulative Volume Delta with divergence detection — into one coordinated tool for reading liquidity and order-flow conviction.
## Why This Combination Exists
Each of the three methods answers a different question about price, and none of them can answer the others alone. Volume Profile answers "where has the market actually traded?" — it locates the price levels participants have defended with size. Anchored VWAP answers "how far is the current price from the session's true volume-weighted average?" — it measures stretch from fair value. CVD divergence answers "is this move real?" — it exposes when a new price high or low is being printed on weakening order-flow pressure.
Used in isolation, each method produces false signals. A Value Area edge can be tagged without any participation. A VWAP band touch can continue for hours without mean-reverting. A CVD divergence can fire in a vacuum away from any structural level. The coordination is the entire point of this script: a Value Area edge touched while price is already two standard deviations stretched from VWAP, with a confirmed CVD divergence printing at the same bar — three independent systems agreeing — is a structurally different event than any one of them firing alone. The script exists to make that specific confluence visible in a single overlay without chart clutter or flipping between tools.
## How It Works
Volume Profile — The visible range is split into horizontal price buckets. Each completed bar's volume is distributed into the bucket containing its midpoint. The highest-volume bucket becomes the Point of Control (POC). From the POC outward, buckets are added alternately above and below (whichever neighbour carries more volume) until a configurable percentage of total volume is captured — 70% by default, following the CBOT value-area method. The upper and lower boundaries of that expansion become Value Area High (VAH) and Value Area Low (VAL). A previous-session POC that current price has not yet revisited is drawn as a "naked POC" — an untested volume cluster that tends to act as a magnet.
Anchored VWAP — The volume-weighted average price is calculated from scratch each time the anchor period resets (thirteen anchor options from one hour through yearly). Two standard-deviation bands are derived from the running variance of the weighted price distribution, with multipliers adjustable for both the inner and outer bands. Bands are deliberately suppressed for the first five bars of every new anchor period, because variance is mathematically unstable immediately after a reset and early spikes would be misleading.
CVD Divergence — Cumulative Volume Delta is estimated per bar using the close-location-within-range method: a bar that closes near its high is interpreted as predominantly buy-driven, one that closes near its low as sell-driven, and the net difference is summed across the session. Structural swing highs and lows are detected with equal left and right confirmation windows, which prevents repainting because a pivot is only recognised once both sides are closed. A divergence is flagged only when three conditions are met: (1) price prints a new swing extreme relative to the previous one, (2) the CVD value at that swing fails to confirm the new extreme, and (3) the swing itself exceeds 1.5 times the 14-bar Average True Range. The ATR gate is the key noise filter — it throws out minor pivots that would otherwise generate meaningless divergences during tight consolidations.
## How To Use It
- Start with the profile: locate POC, VAH, and VAL. These are the decision levels.
- Check the VWAP band zone (shown live in the dashboard). Inside ±1 standard deviation of VWAP, price is near fair value. Beyond ±2 standard deviations, it is statistically stretched and mean-reversion odds improve.
- Look for confluence at profile levels. A rejection candle at VAH while price is also outside the +2 standard deviation band on VWAP and a bearish CVD divergence has just fired is the highest-probability setup the indicator produces. The inverse applies at VAL.
- A naked POC tag accompanied by CVD trending in the same direction as the test is more likely to hold than one where CVD disagrees.
- Recommended timeframes: 5-minute through 4-hour for intraday; 1-hour through daily for swing. The VWAP anchor period should match the trading horizon — Session for intraday, Weekly or Monthly for swing.
- Recommended markets: liquid futures, major FX pairs, large-cap equities, and liquid crypto perpetuals — any market where per-bar volume is meaningful enough for the close-location-within-range buy/sell estimate to be informative.
- Avoid using on illiquid symbols where volume is sparse or spiky, and on non-standard chart types (Heikin Ashi, Renko, Kagi, Point & Figure, Range) — they distort both the profile inputs and the CVD calculation.
## Settings
- Profile Rows (default 60): number of horizontal buckets. Higher values give finer resolution at the cost of more noise per bucket.
- Value Area % (default 0.70): volume percentage that defines the value area, following the CBOT convention.
- Lookback Bars (default 48): how many completed bars of history feed the profile.
- Show Naked POC (default on): draws previous-session POCs that current price has not yet revisited.
- Profile Width (default 0.30): horizontal footprint of the heatmap as a fraction of the lookback window.
- CVD Pivot Lookback (default 5): bars required on each side to confirm a swing. Higher values produce fewer but stronger divergence signals.
- VWAP Period (default Session): anchor period from one hour through yearly.
- Inner SD Multiplier (default 1.0) and Outer SD Multiplier (default 2.0): standard-deviation band widths.
- Dashboard position, size, and dark-mode toggle: cosmetic only.
## Alerts
Four alert conditions are included, each with a JSON payload suitable for webhook routing:
- Price touches POC (within half an ATR)
- Price enters the VAH zone
- Price enters the VAL zone
- CVD divergence detected (bullish or bearish)
## Notes
- Non-repainting. Divergence signals fire only on confirmed (closed) bars and require both-sided pivot confirmation. The profile, VWAP and CVD values use historical bar data only, with no lookahead.
- The CVD estimate is range-based (close-location-within-range), not tick-based. On very short timeframes, where a single bar can contain many aggressive sweeps, this is an approximation of true order flow — it correlates well with tick CVD on liquid instruments but is not a substitute for it on sub-minute scalping.
- Overlay indicator, pinned to the right scale. Pine Script v6.
─────────────────────────────────────────
════════════════════════
Penunjuk

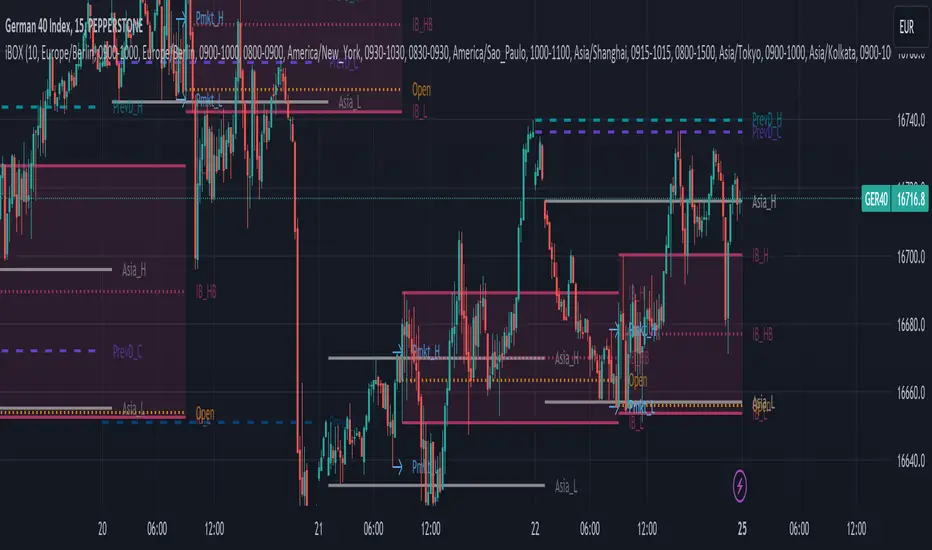
Initial Balance | TradeSymmetryIf you trade across multiple asset classes on lower timeframes, you know the frustration: every time you switch from US Equities to Metals or Forex, you have to manually adjust your Initial Balance (IB) timings. Furthermore, standard Multi-Timeframe (MTF) indicators often break, clutter your chart with overlapping text, or randomly delete your Higher Timeframe levels due to Pine Script memory limits.
We engineered the Initial Balance to solve these exact problems. This is a robust, institutional-grade structural tool designed to map the Initial Balance and True Open levels automatically, regardless of what chart you are looking at.
🔥 Core Features & Engineering:
🤖 Smart Asset Auto-Detection
Stop changing your settings every time you change your chart. The built-in detection engine reads your ticker symbol and automatically applies the correct New York (EST/EDT) Initial Balance window:
US Equities / Indices (ES, NQ, SPY, etc.) ➡️ 09:30 - 10:30 EST
Metals & Bonds (GC, SI, ZN, etc.) ➡️ 08:20 - 09:20 EST
Energy (CL, NG, etc.) ➡️ 09:00 - 10:00 EST
Forex & FX Futures (EURUSD, 6E, etc.) ➡️ 08:00 - 09:00 EST (NY Session)
Note: Includes a sleek info panel in the bottom right so you always know which session is active. Manual overrides are also available.
⏱️ Absolute Time Anchoring
A common flaw in Pine Script is that drawn lines will shift horizontally when you switch timeframes (e.g., from 1m to 15m). This script anchors every box, line, and label to exact absolute UNIX timestamps. Your levels stay permanently locked to the exact same pixel, irrespective of the timeframe you are viewing.
🧠 Priority Memory Manager (GC Protection)
TradingView enforces a strict 500-line limit per script. When standard scripts hit this limit, they blindly delete your oldest lines—often ruining your long-term charts. We built a custom Garbage Collection (GC) pruner that constantly monitors line count. If the chart gets too heavy, it safely deletes only the oldest historical days, permanently protecting your current setups.
📊 Included Levels:
Initial Balance High & Low (IBH / IBL)
Intermediate Midpoint (50% / IBM)
Standard Extensions (IBH+Δ, IBL-Δ)
Double Extensions (IBH+2Δ, IBL-2Δ)
Fractional Extensions (IBM+Δ/2, IBM-Δ/2)
Penunjuk

Penunjuk

Penunjuk

Penunjuk

Penunjuk

Penunjuk

HTA - OPENHTA - OPEN (Opening Ranges & AVWAPs)
Release Notes (Latest Update):
Name Change: Simplified indicator name to HTA - OPEN.
New Asia Session: Added the Asia Opening Range and Start of Asia Session AVWAP (Defaulted to 18:00 EST to align with the CME Globex futures open).
"Extend Lines" Toggle: Added the ability to choose whether your opening range lines extend infinitely across the chart, or if they automatically stop drawing when the session ends to keep your chart clean.
UI Overhaul: Completely reorganized the settings menu. Session AVWAPs are now cleanly grouped together, and default color opacities have been optimized for better visibility.
About HTA - OPEN
The HTA - OPEN indicator is an all-in-one intraday tool designed to automatically map out key liquidity periods, session opening ranges, and dynamic volume-weighted average prices (AVWAPs). It is built to keep your charts clean while providing critical levels for the New York, London, and Asia sessions.
Key Features:
1. Automated Opening Ranges
The script automatically draws the high and low of the opening minutes for major sessions. Each session is highly customizable, allowing you to change line styles, colors, fill opacity, and toggle text labels.
New York Session: 09:30 - 09:45 EST
Asia / Globex Session: 18:00 - 18:15 EST
London Session: 03:00 - 03:15 EST
Day Initial Balance: 09:30 - 10:30 EST
2. Session AVWAPs
Automatically anchors a VWAP to the exact start time of your selected sessions, providing a dynamic gauge of intraday trend and institutional average price.
Start of New York Session AVWAP
Start of London Session AVWAP
Start of Asia Session AVWAP
Previous Day's New York Open AVWAP
3. Macro & Day AVWAPs
For broader market context, the indicator can seamlessly plot Higher Timeframe AVWAPs without needing to manually anchor them.
Day AVWAPs: Start of Day, High of Day, Low of Day.
Macro AVWAPs: Start of Month, Start of Year, High of Year.
Customization & Display:
Every range and AVWAP can be toggled on or off individually. The new "Extend Lines" feature gives you complete control over how much historical data remains visible on your chart, ensuring your workspace only shows the data you need for the current session. Penunjuk

Initial Balance Volume Deficit [LuxAlgo]The IB Volume Deficit indicator measures the relationship between Initial Balance (IB) volume and the volume traded during the remainder of the session to identify shifts in market participation, institutional conviction, and potential exhaustion.
🔶 USAGE
The indicator operates on the principle that the first 60 minutes of a trading session (the Initial Balance) often set the tone for the day, representing the period where institutional "price discovery" and large-scale orders are most prevalent. By tracking the cumulative volume during this period and subsequently subtracting the volume from the rest of the session, the script visualizes whether the "opening conviction" is being sustained or overwhelmed by subsequent market activity.
🔹 Volume Deficit and Trend Conviction
When the oscillator drops below the zero line, a "Volume Deficit" occurs. This signifies that the volume traded after the Initial Balance has exceeded the volume accumulated during the IB. This is a critical marker for trend traders; a deep deficit often confirms that the market has found a directional bias with enough sustained participation to overcome the initial opening volatility. If the deficit continues to grow (the oscillator moves further into negative territory), it suggests that late-session participants are aggressively following the trend established (or reversed) after the first hour.
🔹 No Deficit Detection & Market Psychology
If the oscillator remains above zero until the end of the session, the script highlights this at the start of the next session with a colored background. This "No Deficit" event indicates that the volume in the first hour was greater than the volume of the entire rest of the day combined.
From a psychological perspective, this represents a "Loud Open, Quiet Close" scenario. It suggests that while there was significant institutional interest or news-driven positioning at the open, it failed to attract follow-through participation from the broader market. This often results in:
Exhaustion: The initial move spent all available "fuel" in the first hour. Range-Bound Behavior: Without a volume deficit, the market likely spent the afternoon in a low-liquidity chop, unable to break the IB high or low. Lack of Retail Follow-through: It indicates that the initial institutional orders were met with indifference rather than a trend-following response.
🔹 Trading with the Anchored Moving Average (AMA)
The indicator includes an Anchored Moving Average (AMA) that resets at the start of each session. The relationship between the oscillator and the AMA provides a real-time gauge of volume momentum.
Bullish Momentum: When the oscillator is above the AMA during the IB, it indicates an accelerating buildup of volume, often seen in high-impact opens. Bearish Momentum (Depletion): After the IB, if the oscillator crosses below the AMA, it suggests that volume is being subtracted (consumed) faster than the average rate. This can be used as a confirmation signal for entering trend trades as the market moves toward a deficit state.
🔶 DETAILS
The indicator calculates a cumulative sum starting at the first bar of a new session. During the first 60 minutes (IB), the oscillator increases by the volume of each bar. After 60 minutes, the logic flips, and the volume of each subsequent bar is subtracted from the total.
🔹 Tops and Bottoms Averages
To provide historical context and act as dynamic benchmarks for volume conviction, the indicator plots two dashed horizontal lines:
Tops Average (Benchmark of Opening Strength): This is the average peak volume reached at the end of the IB over the last N sessions. If the current session's peak is significantly higher than this average, it suggests an unusually high-conviction opening, often triggered by major news or earnings. If the peak fails to reach this average, the session may lack the necessary liquidity for a sustained directional move. Bottoms Average (Benchmark of Session Intensity): This tracks the average final deficit value at the close of the last N sessions. It serves as a target or "support" level for volume. If the oscillator breaches this average to the downside, it signals an exceptionally high-conviction trend day that is outperforming historical norms.
🔶 SETTINGS
Moving Average Length: Sets the smoothing period for the Anchored Moving Average (AMA). A shorter length makes the AMA more reactive to sudden bursts in volume. Tops/Bottoms Average Length: Determines the lookback period (in sessions) used to calculate the historical benchmarks for IB peaks and session-end deficits. Style Group: Bullish Color: Sets the color of the oscillator during the IB accumulation phase. Bearish Color: Sets the color of the oscillator once it enters a deficit (below zero) or starts subtracting volume. MA Color: Sets the color of the Anchored Moving Average line.
Penunjuk

IB & OPR ASIA EU USTitle: Advanced Multi-Session Box: IB & OPR (Asia, London, New York)
Description: The Advanced Multi-Session Box: IB & OPR indicator is a versatile, streamlined tool designed specifically for Intraday Traders, Scalpers, and SMC/ICT practitioners. It visually maps out the Opening Price Range (OPR) and Initial Balance (IB) of the three major global trading sessions: Asia, Europe (London), and the US (New York).
Understanding the initial range of these key sessions is critical, as they commonly dictate liquidity pools, intraday support/resistance boundaries, and the directional bias for the rest of the trading day.
🌟 Key Features
✅ Three Core Sessions: Independently configure and toggle the Asia, Europe, and US sessions to match your trading schedule.
✅ Dynamic Timezones: Customize the specific start/end times and timezones (UTC offsets) for each session separately to align with your local broker.
✅ Projected Range Extensions: Optionally extend the session box (High/Low boundaries) forward throughout the current trading day to easily spot late-session breakouts, retests, or liquidity sweeps.
✅ Advanced Midline (50% Equilibrium): Displays a customizable median line inside each session box. The Equilibrium level acts as an excellent dynamic take-profit target or pivot zone.
✅ Smart History Management: Keep your chart perfectly clean! Choose to display only the sessions from "Today", "Two Days", the past "Week", or "All" history to prevent visual clutter.
✅ Deep Visual Customization: Every visual aspect is tweakable. Adjust the box opacity, fill color, border styles, text labels, label alignments, label sizes, and colors directly from the settings menu.
💡 How to Use
Initial Balance Breakouts: The high or low of an established Opening Price Range acts as a crucial line in the sand. A strong 15m or 1H candle close outside the box often signals a trend continuation, while a swift rejection back inside signals a mean-reversion setup.
Equilibrium Bounces: Price frequently respects the median line (50% of the session's range) during consolidations. Use it as a dynamic support or resistance validation point.
Liquidity Sweeps: Observe how the US session interacts with the established highs and lows of the Asian or European session. A quick sweep of the Asian high right at the London or NY open offers a classic "Judas Swing" trading setup.
Note: This indicator employs modern, highly optimized internal logic to manage TradingView's object limits effortlessly, ensuring zero lag on your charts while maintaining visual accuracy. Penunjuk

NY AM Opening Range by GRCtrader📊 NY AM Opening Range by GRCtrader
=== OVERVIEW ===
This is a professional-grade opening range analysis tool designed for futures traders focusing on the critical 9:30 AM ET session. It automatically detects and visualizes the New York AM opening range, center encroachment levels, and standard deviation extensions—key support/resistance structures used in ICT/SMC trading methodology.
=== KEY FEATURES ===
✓ Automatic 9:30 AM ET Detection
- Auto-detects opening range bars across all US futures markets
- COMEX (Gold, Silver, etc.) auto-detection with proper timezone handling
- Customizable timezone offset for CT, PT, and other regional traders
✓ Opening Range Framework
- High/Low lines from 9:30 AM session
- Center Encroachment (C.E.) midpoint for directional bias
- Multiple historical sessions (configurable 1-20 sessions)
- Clean, professional styling with customizable colors
✓ Standard Deviation Bands
- 8 preset standard deviation multiples: 0.5, 1.0, 1.5, 2.0, 2.5, 3.0, 4.0, 4.5
- Based on opening range size—scales automatically with volatility
- Dotted/dashed styling for clear visual separation
- Optional labels for quick reference trading
✓ Multi-Session Tracking
- View up to 20 historical opening ranges simultaneously
- Track mean reversion, range expansion, and structural shifts
- Identify trend bias and liquidity zones across sessions
=== USE CASES ===
• Range traders: Fade OR breaks and trade C.E. bounces
• Breakout hunters: Identify STDV targets beyond the range
• Macro traders: Monitor shift in opening range as volatility/bias indicator
• Day traders: Quick reference for high-probability rejection zones
• Market structure analysis: Understand intraday liquidity distribution
=== SETTINGS ===
• Futures Timezone Offset: Align charts to ET (default -1 for CT)
• Number of Opening Ranges: Display 1-20 historical sessions
• OR Line Width & Color: Customize high/low visualization
• C.E. Line Width & Color: Customize center encroachment display
• STDV Settings: Toggle, color, width, style (solid/dotted/dashed)
• Label Options: Size and visibility toggle for clean chart layout
=== TECHNICAL DETAILS ===
Built on Pine Script v6 with:
- Efficient 30-minute bar analysis
- Zero lag structure detection
- Dynamic line/label management (500 lines, 500 labels max)
- Full customization via Settings panel
=== OPEN SOURCE ===
This indicator is published as an open-source tool. Feel free to:
- Fork, modify, and redistribute for personal use
- Build derivatives and extended tools
- Share improvements with the community
- Use commercially with attribution
MPL 2.0 License: mozilla.org
=== DISCLAIMER ===
This tool is for analysis and education purposes. Past performance does not guarantee future results. Always use proper risk management, position sizing, and confirm signals with your trading strategy. No financial advice is implied. Penunjuk