Inside Bar SetupScript Details
- This script plots Inside Bar for given day in selected time-frame (applicable only for Timeframes < Day)
- Basis plotted inside bar, relevant targets are marked on the chart
- Targets can be customised from script settings. Example, if range of mother candle is 10 points, then T1 is 10 * x above/below mother candle and T2 is 10 * y above/below mother candle. This x & y are configured via script settings
How to use this script ?
- This script works well on 10-15 mins timeframe for stocks, 15/30 mins timeframe for nifty index and 30/60 mins time frame for bank nifty index
- If mother candle high is broken, take long trade with SL of mother candle low and if low is broken, take short trade with SL of mother candle high
Remember:
1. Above logic is to be combined with support/resistances i.e. price action. This script is an add-on to price action analysis giving you more conviction.
2. If range of mother candle is very high, it is recommended to avoid the trade.
3. Basis inside bar formed on higher time frame, take trade on basis of lower time frame i.e if inside bar is formed on 60 mins, take trade on the basis of 10-15 mins time frame
Example:
1. As seen in the chart, Nifty is near it's resistance and we are seeing Inside Bar being formed, In such scenario, even if High of Mother Candle is broken, we should be more interested to short as we are near resistance and probability of getting our targets in long side is less.
2. So, if I see breakdown of mother candle i.e. price going below low of mother candle, we will short with SL of high of mother candle.
3. As seen in the chart, both the targets are achieved.
Additional Info:
1. Targets on Long/Short Side can be configured via settings. For indices 1 times/1.5 times the range works well.
2. This script plots targets basis the first inside bar formed in the day for selected time frame.
3. Inside bars formed through out the day are coloured separately but lines are plotted only on the basis of 1st formed inside bar as this strategy works well for the first formed inside bar)
4. Don't forget to check volume in case of breakout/breakdown.
Note:
1. Mother Candle - First Candle of Inside Bar
2. Child Candle - Candle formed inside Mother Candle (Second Candle of Inside Bar)
Happy Trading :)
Inside Bar

PopGun Trading, PG Pattern DetectorPopGun Bar Pattern Strategy
PG Trading
The indicator does the following:
It detects the Outside Bar, the smaller inside Bar and the 3rd Pop Gun that is bigger, than the inside Bar.
When the Pop Gun was detected, the indicator will calculate 3 targets for long and short trades.
In our understanding, a Pop Gun is neutral. The next candles after the Pop Gun will decide if the PG breakout is bullish or bearish.
So if one of the next candles after the PG is breaking the high or low of the PG Candle, this is a breakout confirmation and can traded long or short.
We are using the PG Indicator for Stock, Futures and Index Trading.
The Script uses 3 targets per default, but you can extend the target dots up to 6.
If you want to see the targets in plain text, you can activate the PG Box.
The targets are calculated really easy: Just the height of the candle multiplied with 1, 2 and 3 (4,5 and 6 additionally). In some communities there is an ATR calculation for more extended targets but it seems, that the ATR Calculation will sometimes lead to unreachable targets if the ATR is really high intraday...
We trade PopGuns starting at M15 chart. I think PGs smaler than M15 are not worth a trade...
Maybe i will add the ATR Function in the future just to compare the 2 ways to calculate PG targets. We are really doing well with 1,2,3 targets based on the PG Candle size. (Low to High).
Please leave a comment if you have some feature requests or input to make this the best Pop Gun Indicator in Trading View ;-)

Inside Bar FinderInside bars occur when the range of a candlestick falls entirely within the previous candlestick's range. This indicates volatility contraction which often leads to volatility expansion, i.e. large price movements.
This indicator includes options such as:
- The number of consecutive inside bars required to trigger the indicator
- Signal lines to indicate the high and low of the outermost or innermost bars
Try out this indicator with different options on different timeframes to see if inside bars increase the probability of identifying the direction of price movements. Breaks or closes outside the inside or outside signal lines can be used to trigger trade signals.

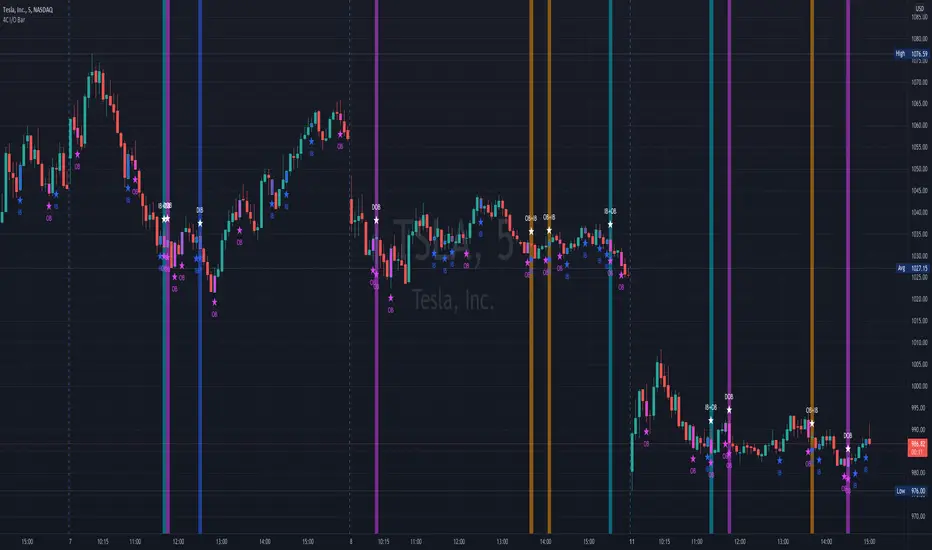
4C Inside/Outside BarThis indicator colors the candle body based on whether it closed as an Inside Bar (IB) or an Outside Bar (OB).
Inside and outside bars can be powerful triggers to enter or exit trades from, when price breaks above or below the candle.
The coloring of only the body and not the border of the candle makes it possible to still know whether the candle was bullish/bearish.
This indicator has the unique ability to add/hide labels for each IB and OB.
Small labels are printed on the chart directly below the candle. (See below)
It also has the unique ability to paint the chart background when an IB forms directly after an OB.
This is a special combination of the two, and can also be a powerful signal.
This feature can be turned on/off. (See below)
Thanks to Craig Stine, as some parts of this indicator were adapted from Custom Candle color Inside/Outside candles, Highwave, Star Patt. by Craig_Stine
Inside Breakout PerQuantumCoin Premium Indicator (strategy)HOW IT WORKS:
- The Inside Breakout gives signals on the chart on the breakout of inside bar chart pattern;
- It allows to trade trend or counter-trend signals;
- Computes intrinsic values to access the strength of the Buy/Sell signal;
- Allows users to adjust their own settings, adapting the signals produced;
- These signals can be also set up as Alerts;
- The indicator has a few custom features that allows users to filter out signals using multi-timeframe trend indicator and to keep tracking positions so that one can only get new signals when they reserve position;
This Strategy version is meant to be a companion to the main indicator in order to backtest your SLT/TP settings with different instruments and adapt results.
Please NOTE:
Results may vary depending on TP/SL settings. Also, previous performance is not a indicator for future results.

Inside Breakout - inside bar - PerQuantumCoin Premium IndicatorHOW IT WORKS:
- The Inside Breakout gives signals on the chart on the breakout of inside bar chart pattern;
- It allows to trade trend or counter-trend signals;
- Computes intrinsic values to access the strength of the Buy/Sell signal;
- Allows users to adjust their own settings, adapting the signals produced;
- These signals can be also set up as Alerts;
- The indicator has a few custom features that allows users to filter out signals using multi-timeframe trend indicator and to keep tracking positions so that one can only get new signals when they reserve position;
This Script is meant to help traders easily identify great entry opportunities.
The Script does NOT repaint signals.

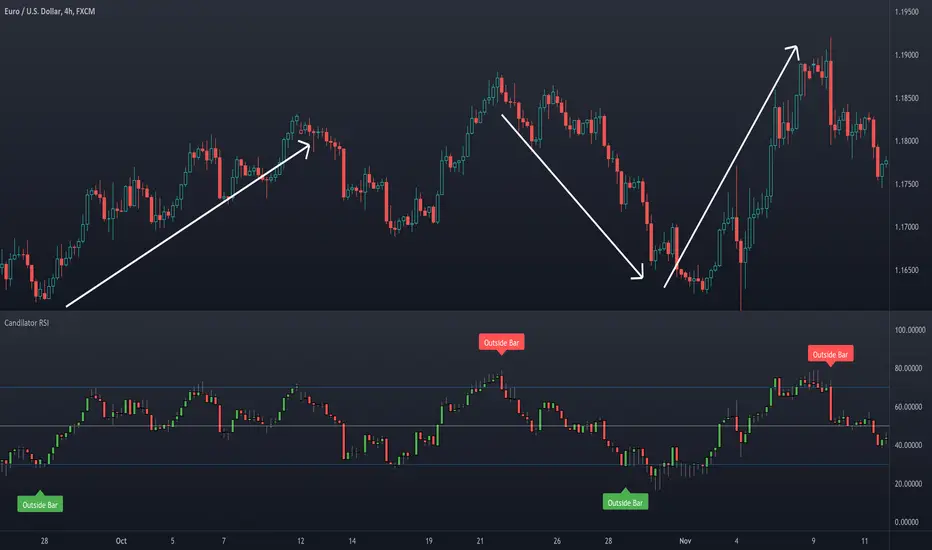
Candilator RSI [AstrideUnicorn]OVERVIEW
The name Candilator comes from blending the words "candlestick" and "oscillator". And as the name suggests, this indicator is a good old RSI plotted as a candlestick chart. To produce a candlestick chart, Candilator RSI calculates four RSI's based on the open, high, low, and close time series. It also has a candlestick patterns detection feature.
HOW TO USE
You can use Candilator RSI as a normal RSI to analyze momentum, detect overbought and oversold markets, and find the oscillator's divergences with the price. You can also get creative and apply all sorts of technical analysis to the RSI candlestick chart, including candlestick patterns analysis.
Candilator RSI can automatically scan the price for some candlestick patterns in the overbought and oversold zones. This feature can help detect price reversals early.
SETTINGS
The indicator settings are divided into two groups: Main Settings and Pattern Detection. In the Main Settings, you can find standard RSI settings. In the Pattern Detection part, you can turn on and off the automatic search for a particular candlestick pattern.
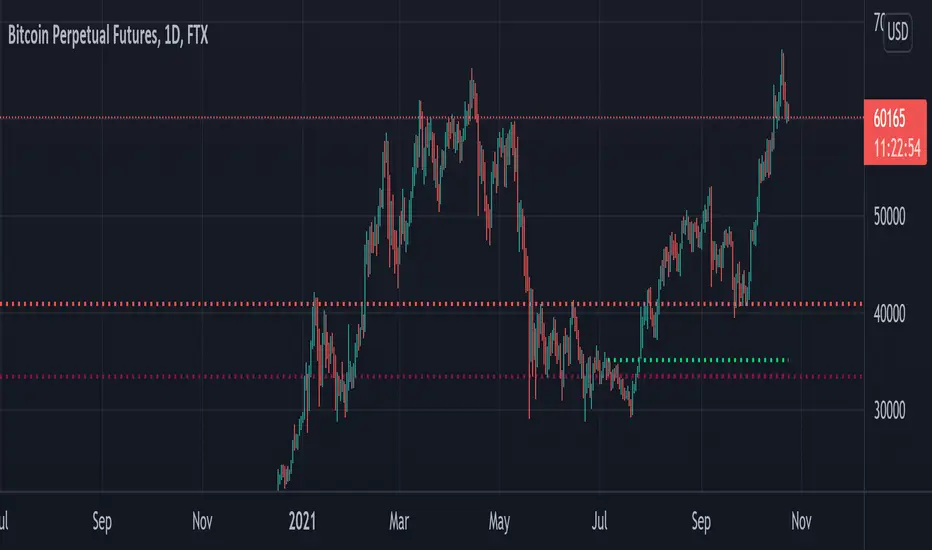
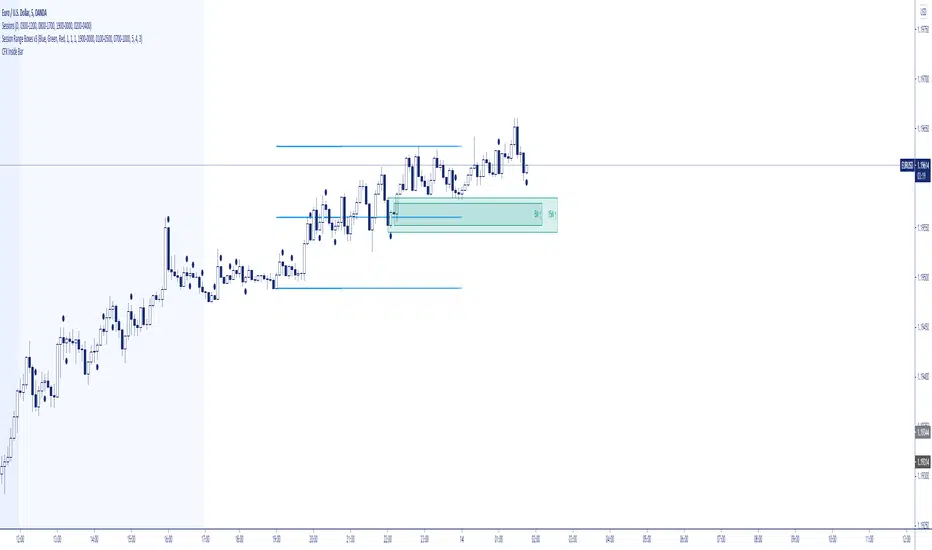
Compression support&resistance [LM]Hello traders,
I would like to present you Compression support&resistance script. The idea behind is to look for areas of price compression(inside bar candles). Basically the S/R lines are created after three candles that are formed in certain pattern and volume conditions. First candle of pattern is usually the most volatile and fist inside bar after volatile candle high and low creates S/R lines in order to look for breakouts or for future bounces of the S/R line. Also by default volume has to be decreasing from candle to candle, although this condition can be controlled by setting.
It has various settings as my other S/R scripts for multi timeframe analysis. The current timeframe uses line API but for multi timeframe I use plot lines. There are two filters. Volume filter for declining volume of the pattern candles and volatility filter which renders line only in case that pattern occurs after some % change has happened within some lookback period.
Credit also for this indicator goes to @berkek as he took time to explain it to me.
Hope you will enjoy it,
Lukas
4 SMAs & Inside Bar (Colored)SMAs and Inside Bar strategy is very common as far as Technical analysis is concern. This script is a combination of 10-20-50-200 SMA and Inside Bar Candle Identification.
SMA Crossover:
4 SMAs (10, 20, 50 & 200) are combined here in one single indicator.
Crossover signal for Buy as "B" will be shown in the chart if SMA 10 is above 20 & 50 and SMA 20 is above 50.
Crossover signal for Sell as "S" will be shown in the chart if SMA 10 is below 20 & 50 and SMA 20 is below 50.
Inside Bar Identification:
This is to simply identify if there is a inside bar candle. The logic is very simple - High of the previous candle should be higher than current candle and low of the previous candle should be lower than the current candle.
If the previous candle is red, the following candle would be Yellow - which may give some bullish view in most of the cases but not always
If the previous candle is green, the following candle would be Black - which may give some bearish view in most of the cases but not always
Be Cautious when you see alternate yellow and black candle, it may give move on the both side
Please comment if you have any interesting ideas to improve this indicator.

Price Action: Inside Bar BoxesThis script automatically draws rectangles around bars inside IB pattern.
Note :: because Pinescript does not allow changes to already drawn charts on historical bars, checkbox "show only last box" doesn't work for arrows

Narrow Range (NR) IndicatorNarrow Range (NR) trading strategy is a breakout-based method that assumes that the price of security trends up or down after a brief consolidation in a narrow range. This indicator can plot:
1. Narrow Range (NR) 4, 7, and 21
2. Narrow Range (NR) 4, 7, and 21 + Inside Bars (IB)
NR 4/NR 7/NR 21 day acts as a confirming factor on where the price will move further. Breakout of NR 4/NR 7/NR 21 candle with high volumes indicates bullishness, while the breakdown candle indicates bearishness.

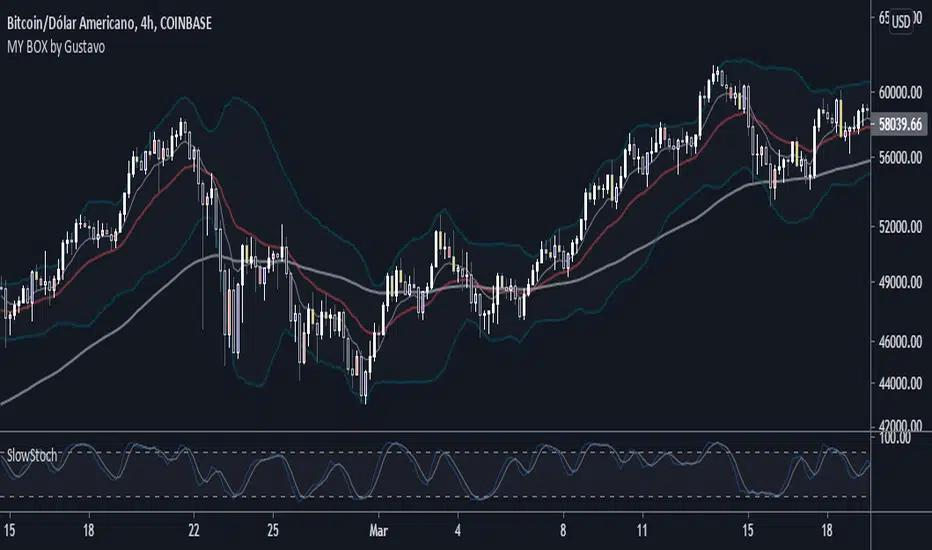
MY BOX by GustavoThis box contains two strategies, several moving averages and Bollinger Bands.
PFR or "Reversal closing price" is a simple and effective strategy, widespread by the Brazilian trader Stormer.
The purpose is to make the candles generate the input signal more clearly.
Description:
When the sales PFR candle appears colored, watch out for the next candle. If he breaks the closing of the PFR sell candle, SALE!
Your stop should be at the maximum of the PFR candle and your target projected at 1.618 in the fibonacci extension.
When the buy PFR candle appears colored, watch out for the next candle. If it breaks the closing of the buy PFR candle, BUY!
Your stop should be at the low of the PFR candle and your target projected at 1.618 in the fibonacci extension.
Inside Bar: The candle has its maximum less than the maximum of the previous candle and its minimum greater than the minimum of the previous candle.
Settings:
You can edit the colors in the indicator settings and select the measurements you want to use.
You can also choose to use the Stocastico Lento filter on over-purchase and over-sale.
You can also activate the Inside bar, it will appear in red on the graph.
There is also the possibility to activate in the settings, the Bollinger Bands.
--------------------------
Este box contém duas estratégias, diversas médias móveis e Bandas de Bollinger.
PFR ou "Preço de fechamento de reversão" é uma estratégia simples e eficaz, bastante difundida pelo trader brasileiro Stormer.
O intuito é tornar os candles de geram o sinal de entrada mais claro.
Descrição:
Quando o candle PFR de venda aparecer colorido, fique atento ao próximo candle. Se ele romper o fechamento do candle PFR de venda, VENDA!
Seu stop deverá ser na maxima do candle PFR e seu alvo projetado em 1,618 na extenção de fibonacci.
Quando o candle PFR de compra aparecer colorido, fique atento ao próximo candle. Se ele romper o fechamento do candle PFR de compra, COMPRE!
Seu stop deverá ser na mínima do candle PFR e seu alvo projetado em 1,618 na extenção de fibonacci.
Inside Bar: O candle tem sua máxima menor que a máxima do candle anterior e sua mínima maior que a minima do candle anterior.
Configuração:
Você pode editar as cores nas configurações do indicador e selecione as medias que deseja usar.
Também pode escolher usar o filtro do Stocastico Lento em sobre compra e sobre venda.
Você também pode ativar o Inside bar, ele aparecerá em vermelho no gráfico.
Há também a possibilidade de ativar nas configurações, as Bandas de bollinger.
EMA Cross 9,21,50,80,200 + Inside barEste script faz o seguinte:
1. Plota 5 EMAs (9,21,50,80,200)
2. Faz crossover da 9x21 e 21x50
3. Colore inside bar em amarelo (é possível ainda colorir diferentemente bullish e bearish inside bar)

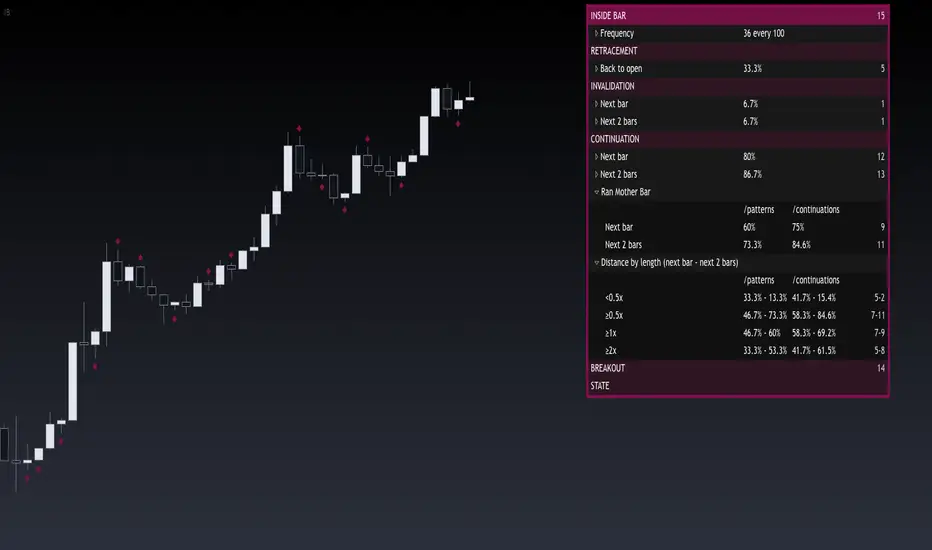
Inside Bar FailureThis indicator provides a statistical report on the Inside Bar Failure candlestick pattern popularized by Trader Dante. Based on the chart's bars, it can improve your edge on any markets and timeframes.
The Inside Bar Failure pattern refers to an Inside Bar breakout that failed to sustain momemtum and closed back within it.
The report is broken down into the different following sections: retracement , invalidation , continuation and breakout .
Each of them provides hindsights about the pattern price behavior and brings answers to questions such as: How often does price retrace? Does the pattern often invalidate? If it doesn't then does it break in the pattern's direction? How far does price go? What are the odds of a false breakout?
While there are many ways to make use of the metrics, my favorite use case is for developing directional and daily/weekly biases while refining my stop/entry/target positioning.
Miscellaneous
Highlights patterns on the chart;
Supports bar to bar analysis and replay functionalities;
Provides counts on the `Data Window` panel for debugging or computing your own metrics;
Settings
Show/hide for toggling different sections;
Report coloring and offset on the x axis;
Gaining Access
This is a private indicator and is available only for my Patrons. You can reach my Patreon page below from the link in my signature.

Double Inside BarThis indicator provides a statistical report on the Double Inside Bar pattern. Based on the chart's bars, it can improve your edge on any markets and timeframes.
A Double Inside Bar refers to a contraction where price is consolidating while making consecutive lower highs and a higher lows.
The report is broken down into the different following sections: retracement , invalidation , continuation and breakout .
Each of them provides hindsights about the pattern price behavior and brings answers to questions such as: How often does price retrace? Does the pattern often invalidate? If it doesn't then does it break in the pattern's direction? How far does price go? What are the odds of a false breakout?
While there are many ways to make use of the metrics, my favorite use case is for developing directional and daily/weekly biases while refining my stop/entry/target positioning.
Miscellaneous
Highlights patterns on the chart;
Supports bar to bar analysis and replay functionalities;
Provides counts on the `Data Window` panel for debugging or computing your own metrics;
Settings
Show/hide for toggling different sections;
Report coloring and offset on the x axis;
Gaining Access
This is a private indicator and is available only for my Patrons. You can reach my Patreon page below from the link in my signature.

Inside BarThis indicator provides a statistical report on the Inside Bar candlestick pattern. Based on the chart's bars, it can improve your edge on any markets and timeframes.
The Inside Bar pattern refers to a candle that makes a lower high and a higher low.
The report is broken down into the different following sections: retracement , invalidation , continuation and breakout .
Each of them provides hindsights about the pattern price behavior and brings answers to questions such as: How often does price retrace? Does the pattern often invalidate? If it doesn't then does it break in the pattern's direction? How far does price go? What are the odds of a false breakout?
While there are many ways to make use of the metrics, my favorite use case is for developing directional and daily/weekly biases while refining my stop/entry/target positioning.
Miscellaneous
Highlights patterns on the chart;
Supports bar to bar analysis and replay functionalities;
Provides counts on the `Data Window` panel for debugging or computing your own metrics;
Settings
Show/hide for toggling different sections;
Report coloring and offset on the x axis;
Gaining Access
This is a private indicator and is available only for my Patrons. You can reach my Patreon page below from the link in my signature.
CSPDMost Advanced & Accurate CandleStick Pattern Detector
Looking All Over of All Markets for All Important Powerful Reversal | Corrective Patterns (25 type)
Filtering the Results with Optional Features like Oscillator, Bollinger Bands, Volume Confirmation, Prior and Following Candles Confirmation which are Fully Customizable.
With this you can detect:
Hammer | Shooting star
Inverted Hammer | Hanging
Long legged Doji | Dragonfly Doji | Gravestone Doji
Bullish tweezers | Bearish tweezers
Bullish inside bar | Bearish inside bar
Bullish three line strike | Bearish three line strike
Bullish engulfing | Bearish engulfing
Piercing line | Dark cloud cover
Bullish abandoned baby | Bearish abandoned baby
Morning star | Evening star
Three white soldiers | Three black crows
*Bullish kayo | *Bearish kayo
Features:
Prior and Following candles Confirmation
You can set prior and following candle as basic prerequisites for marking candles as pattern to make sure you are at the top or bottom of the trend.
Volume confirmation
You can active volume increasing confirmation for some of pattern with adjustable increase % relative to prior candle | candles.
Oscillator Confirmation
Active oscillator confirmation. Select your approved oscillator from list (Stochastic, RSI, StochRSI, MFI, StochMFI) then enter desired value for marking candles as bullish | bearish pattern.
Bollinger Bands Confirmation
Active BB confirmation. Configure your Bollinger Bands. Now only see the patterns which reached or crossed from Bands. Also you can enable BB clod to have your BB indicator at the same time.
Adjustable Flexibility and Precision
You can set tolerance% for Osc and BB Confirmation - each one separately - for more control.
Self-adaptability
The properties of markets change over time, for example the amplitude of fluctuations and the intensity of movements. The script is designed in such a way that you can examine the price history as a benchmark for changes in market properties to adopt determinants. Also you can control those manually.
Self-regulatory
The user has the ability to change input factors depending on their point of view.
Behind the pattern recognition algorithms, there are relationships and similarities in their appearance that cause them to be influenced by each other. Simultaneously with changing the determining factors of each pattern by you, script automatically adjusts other details in accordance with your changes.
Alerts
You can set for type of pattern or each one of pattern have been detected.
Fully Costumizable
All of these options can be change and adjust.
Note 1.
The patterns are based on extensive study of reference and famous sources and the experience of me and my friends in trading and analysis with price action methods.
Note 2.
Due to the Pine limitations in the number of outputs | plots for each script, our attempt has been made to select the best and most important patterns.
Note 3.
So far, many scripts have been written in this field, but our experience with all of them and even the build in version was not satisfactory, and this was the initial motivation for making the script.
We strive to improve progress and elimination of shortcomings and we will continue to make this better.
Note 4.
Through personal experience and based on the principles of market and candlestick psychology, we discovered a new type of pattern and named it as Kayo.
kayo is a two candle pattern which formed when:
1.We have a pivot point with prior candles as left bars and following candles as right bar. Pivot candle called as second candle.
2.In a bullish kayo, first candle must closed descending and second candle must closed as ascending. For bearish kayo vise versa.
3.In a bullish kayo, second candle's lower wick must be longer then upper wick.
4. A pattern marked as kayo when its conditions do not correspond to any of the other patterns(include the confirmation that user added), ie it has the last naming priority over the other patterns.
Note 5.
When you active confirmation options for patterns like hammer, engulf and etc which they conditions are like kayo in some extent, if they can't pass the confirmation steps, they can be marked as kayo pattern.
Note 6.
If you active volume confirmation for Three white soldiers | Three black crows, the confirmation get passed if the volume of forth or third candle increased as value as entered relative to volume EMA3 of 3 candles.
Note 7.
In a bullish pattern all highs of following candles MUST be higher than prior highs and all lows of following candles MUST be higher than prior lows. For bearish patterns vise versa.
This type of confirmation depends on High and Low NOT close!
Gift to price action lovers!
Support us with your like and comments. let us know your experience, points and idea to make this better together.

Coloring an inside barThis script colors the candles covered in the previous candle. The candle is colored. You can make many adjustments yourself.

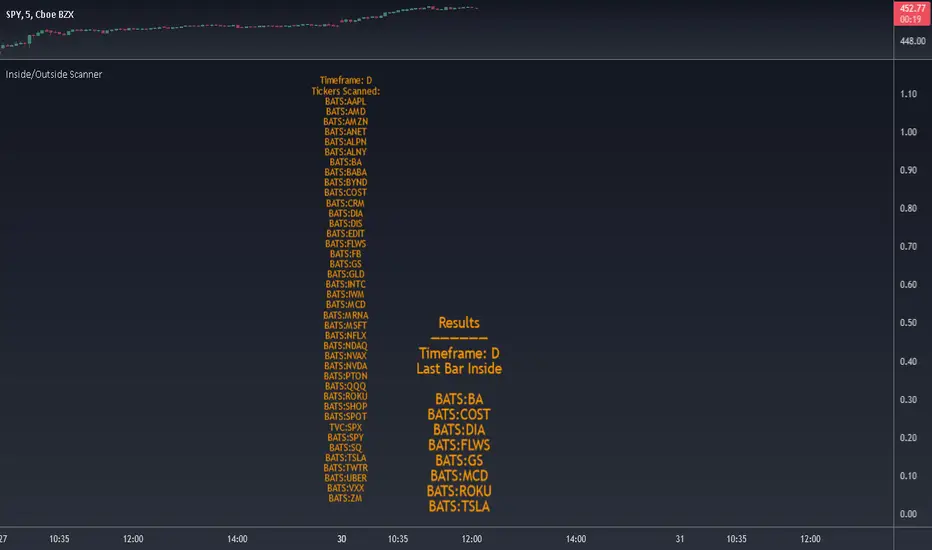
Inside/Outside Scanner40 tickers max. Can change the tickers in the settings.
Choose to scan for Inside or Outside bars for current bar or previous bar.
Also scans for 2 inside consecutive bars and 3 inside bars starting from the current candle.
Change timeframe in the settings. Default is set to 1D.
Please DM me to get access.
TheStratHelper Scanner
1= Inside Candle
2= Goes past the previous candle's price up or down
3= Goes past the previous candle's price on both sides
Ability to change the timeframe and the symbols this indicator is scanning through in the input tab under settings of this indicator. Maximum symbols 40. By default some symbols are entered in the indicator already. They cannot be left empty. If left empty, an error comes up and the script doesn't load.
Can look through many timeframes like monthly, weekly, daily by changing the timeframe in the input tab under settings. Default timeframe is set to 1 Day.
First label is for all of the symbols the indicator is scanning.
Second label is the result of the scan.
Scanning for
2 Up, 2 Down, 3-1, 2-1, 1-2, 2-2, Failed 2 going 3, Inside and Outside bars
Please DM me to get access to this indicator.

Screener Inside BarsBased on the teachings of Rob Smith
1= Inside Candle
2= Goes past the previous candle's price up or down
3= Goes past the previous candle's price on both sides
Ability to change the timeframe and the symbols this indicator is scanning through in the input tab under settings of this indicator. Maximum symbols 40.
Looking for inside bars within 40 symbols. By default some symbols are entered in the indicator already. They cannot be left empty. If left empty, an error comes up and the script doesn't load.
By changing the timeframe, inside bars can be looked under many timeframes like Monthly, Weekly, Dialy, Intraday, etc.
First label is for all of the symbols the indicator is scanning.
Second label is the result of the scan. Text is bigger than in this label than the first label to differentiate from the first label and for ease of use.
Please DM me on how to access this indicator.

Two Fractals TrendlinesThis study draws a trend line for the last two Bill Williams up-fractals and down-fractals.
Trend line break signals and alerts can optionally be added.
