CDOI ProfileCumulative Delta of Open Interest Profile
This script lets you visualize where there were Open Interest build-ups and discharges on a price basis.
It only supports pairs where TradingView added the appropriate Open Interest data (at the time of posting that is only Binance and Kraken perpetual contracts)
The script uses my own functions to poll lower timeframe data and compile it into a higher timeframe profile. And as such, it needs some tweaking to adjust it to your timeframe until Tradingview lets me do it codewise (hopefully one day)
The instructions for using the Indicators are as follows:
Condition: How often a new profile should be generated
Sampling Rate and 1/Nth of the TF: These have to be calculated together to have a product that should correspond to the current timeframe in minutes. A few examples below
----------- Sampling - 1Nth of the TF
5 min ------- 5 --------------- 1
10 min ------ 10 ------------- 1
15 min ------ 5 --------------- 3
20 min ------ 10 ------------- 2
30 min ------ 10 -------------- 3
45 min ------- 9 -------------- 5
1 hour ------- 10 ------------- 6
4 hours ----- 10 -------------- 24
1 day -------- 10 ------------- 144
Transparency: This one is pretty self-explanatory but only applies to the Profile bars
% change for a bar: This one indicates how precise each bar will be, but if you go too low the script becomes too heavy and stop running
Bar limit: Limits the amounts of bars the script is run for (ae for the last 1000 bars). Lower = faster loading, too high will stop running
UI color: Color and transparency of the center line and the box surrounding the whole profile
Kraken

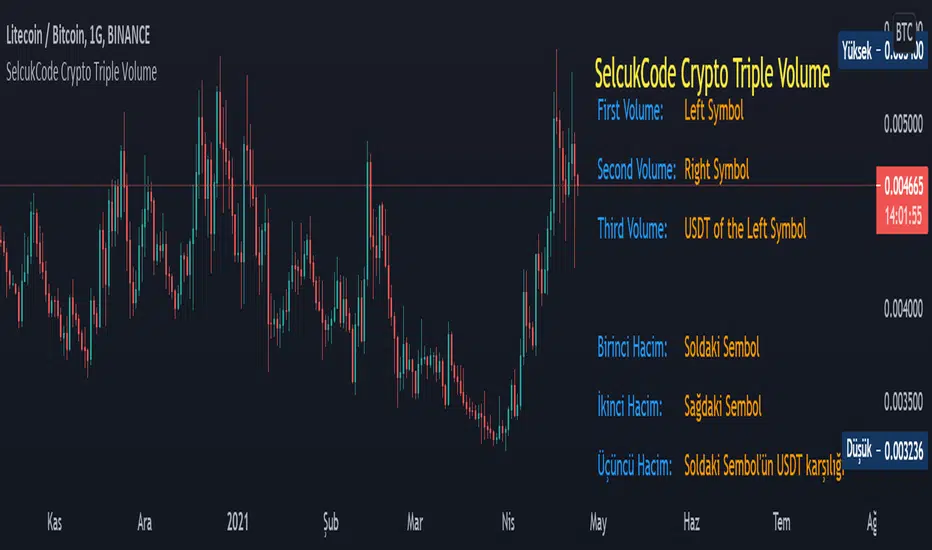
SelcukCode Crypto Triple VolumeThis is a volume indicator written for cryptocurrencies. The difference from the integrated indicator is that the left symbol of the cryptocurrency shows the volume as well as the right symbol. It also shows the volume of the pair in USDT. Thus, we see the USDT volume of each cryptocurrency pair. This standardizes our view of volume.
Bu, kripto paralar için yazılmış bir hacim indikatörüdür. Entegre indikatörden farkı, kripto paranın sol sembolünün hacmini göstermesinin yanı sıra sağ sembolün hacmini de gösterir. Ayrıca paritenin USDT olarak da hacmini gösterir. Böylelikle her kripto para çiftinin USDT hacmini görmüş oluruz. Bu bizim hacime bakış açımızı standartlaştırır.
Various Volume RSI (USDT PRO)RSI that displays USDT (Tether) of various cryptocurrency exchanges together.
色々な暗号通貨取引所のUSDT(Tether)をまとめて表示するRSIです。
CRYPTOCAP:USDT
CRYPTOCAP:USDT.D
BINANCE
BITFINEX
POLONIEX
KRAKEN
BITTREX
HITBTC
HUOBI
詳細などはこちらにて
note.mu

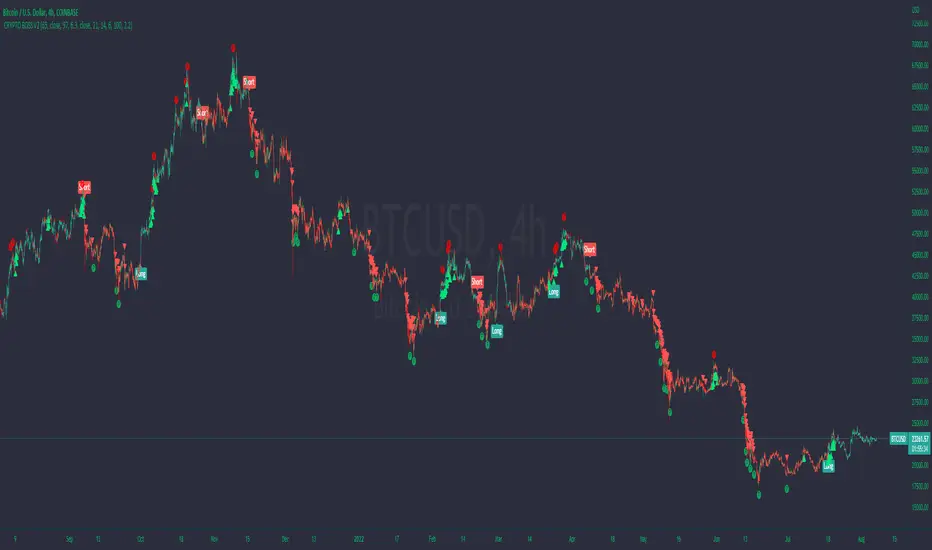
BOSS| Trade Like A Bitcoin and Ethereum WhaleTHE BEST BITCOIN AND ETHEREUM INDICATOR FOR TRADINGVIEW.COM
Quantum Technology – You won’t find any other indicator out there that predicts the probability of the next candle being bullish or bearish .
No Lag, No delay, No repaint!
Quality of Signals – The new Boss Quantum allows you to be in control of the outcome probability. Higher accuracy!
Buy/Long on Long Signal
Sell/Short on Short Signal
SET ALERTS TO ONCE PER BAR CLOSE
//////////////////////////////////////////////////////////////////////
Breakouts, Profit Points, and ReEntry's
This indicator will alert you of when to take profits, when to reenter a trade, and when a breakout occurs.
TAKING PROFITS
When in a long position take long profits on teal circle which, will be above candle.
When in a short position take short profits on purple circle which, will be below candle.
I typically exit 25-50% of position and reenter 25-50% on next candle.
If a Long or Short signal on BOSS quantum is still present the long or short trade is still active.
ReENTRY's
Long ReEntry's
If in a long position and a purple circle appears below candle this indicates a great place to either reenter trade or add more to position.
If a green triangle appears below candle you can either reenter or add more to long position as this signifies a long breakout/ strong upward movement.
Short ReEntry's
If in a short position and a teal circle appears above candle this indicates a great place to either reenter trade or add more to position.
If a red triangle appears below candle you can either reenter short or add more to short position as this signifies a short breakout/ strong downward movement.
Breakout's
Green Triangle
If a green triangle appears below candle you can either reenter or add more to long position as this signifies a long breakout/ strong upward movement.
Red Triangle
If a red triangle appears above candle you can either reenter short or add more to short position as this signifies a short breakout/ strong downward movement.
SET ALERTS TO ONCE PER BAR
Available At: Bosscripts.com
Crypto grabberSo, its my first position in crypto (and not only crypto) bots series. What we have there.. program writting on Pine script language what can analyse market data of any trading instrument and signalise to enter the deal. Its next versions will update. Trade system based on my x-volume indicator.In central part of system is analyzing volume accumulation and distribution process which decide good and bad time for investing.
So some important points:
1) In time when you change timeframe or trading symbol bot analise all bars history. The number of trading (signal) candles in the analysis history is marked in black.
2) The percent of profitable signals is marked in blue.
3) Total profit points are marked in green.
4) Total bars in history are marked in red.
For better indicator vision you can turn off non interesting plots in settings menu.
There is two kinds of alerts: Buy alert and Sell alert. Set it once per bar close or every minute ( because the best way you must open the deal at 20 sec before bar close ).
This trading system is great for creating a profitable trading portfolio. Try it yourself to find exchanges and cryptocurrencies with profitable historical views. For example, the KRAKEN exchange trades well: XBTCAD, XBTUSD in 30-45 min timeframe.
I will do better settings in new versions of this bot. Waiting your likes)

Detethered Price - Removing Tether FluctuationsAutodetects if a ticker is on a USDT dominated exchange and whether or not the pairing is in USDT value or BTC value.
Candles are then plotted to show the true value.

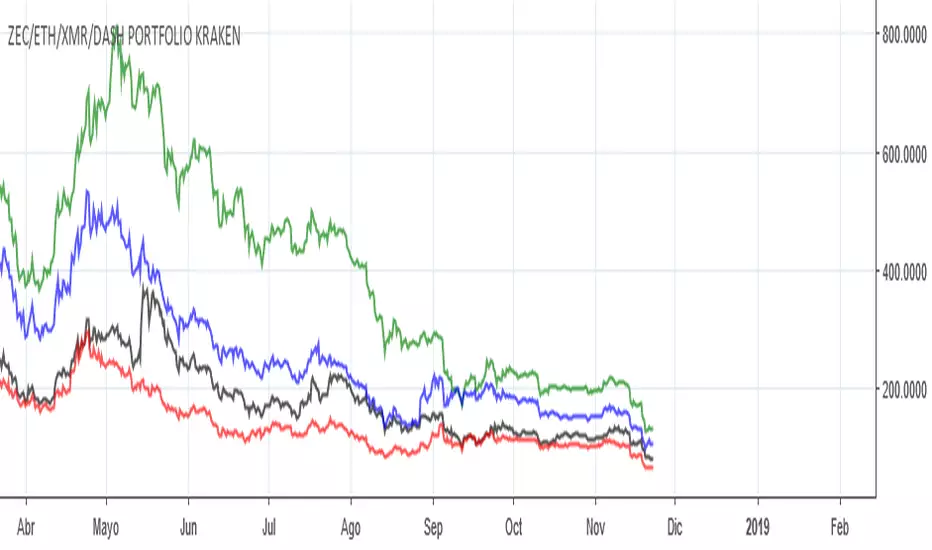
ZEC/ETH/XMR/DASH PORTFOLIO KRAKENPortfolio chart with total value.
I will try to optimize it, maybe add % option if I findout how ;p
Or maybe a normalization would be good, idk.
Cheers!
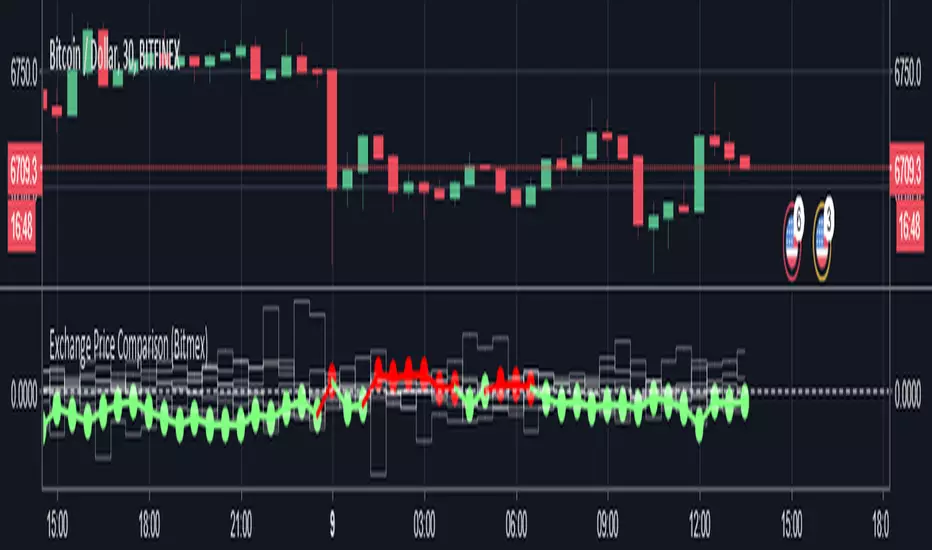
Exchange Price ComparisonCompare the BTC price at your preferred exchange against 7 other exchanges. Avoid trades at poor market value, target trades at good market value.
Average price across 8 exchanges is the 0 line, with your selected exchange displayed green if it's below the average price, red if it's above the average price. Values are displayed as distance from the average, positive or negative.
Useful for evaluating your exchange price vs average market price, to avoid poor market value trades, target good value trades, shop around exchanges for best value, potential to be adapted for arbitrage opportunities.
8 Exchanges used:
Bitfinex
Bitmex
Poloniex
Binance
Coinbase
Bitstamp
Bittrex
Kraken
Requested by Mister_Pocketlint on discord. Inspired by anise.
Kraken Altcoin IndexIndex based upon the valuation of LTC, ETH, ETC, XMR and ZEC in XBT, USD and EUR
Options:
- choose which of the above alt coins are part of the index
- choose whether you want to see the valuation in XBT, USD or EUR
Note that because of the high valuation of ZEC during the launch period and the months thereafter it has a significant effect on the index. This is true as well for XMR, though to lesser extend.
Because of these effect, ZEC and XMR are not taken part of the index by default.
Please like it, if you find it useful.
If you'd like me to improve the indicator, the by all means leave a comment or PM me.
Cheers!
