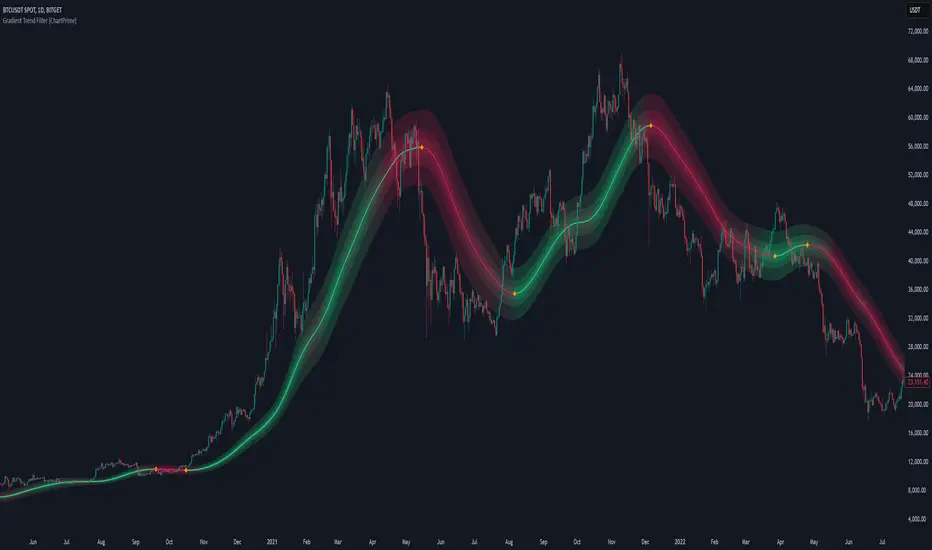
Gradient Trend Filter [ChartPrime]The Gradient Trend Filter is a dynamic trend analysis tool that combines a noise-filtered trend detection system with a color-gradient cloud. It provides traders with a visual representation of trend strength, momentum shifts, and potential reversals.
⯁ KEY FEATURES
Trend Noise Filtering
Uses an advanced smoothing function to filter market noise and produce a more reliable trend representation.
// Noise filter function
noise_filter(src, length) =>
alpha = 2 / (length + 1)
nf_1 = 0.0
nf_2 = 0.0
nf_3 = 0.0
nf_1 := (alpha * src) + ((1 - alpha) * nz(nf_1 ))
nf_2 := (alpha * nf_1) + ((1 - alpha) * nz(nf_2 ))
nf_3 := (alpha * nf_2) + ((1 - alpha) * nz(nf_3 ))
nf_3 // Final output with three-stage smoothing
Color-Based Trend Visualization
The mid-line changes color based on trend direction—green for uptrends and red for downtrends—making it easy to identify trends at a glance.
Orange diamond markers appear when a trend shift is confirmed, providing actionable signals for traders.
Gradient Color Trend Cloud
A cloud around the base trend line that dynamically changes color, often signaling trend shifts ahead of the main trend line.
When in a downtrend, if the cloud starts turning green, it suggests weakening bearish momentum or an upcoming bullish reversal. Conversely, when in an uptrend, a red cloud indicates potential trend weakening or a bearish reversal.
Multi-Layered Trend Bands
The cloud consists of multiple bands, offering a range of support and resistance zones that traders can use for confluence in decision-making.
⯁ HOW TO USE
Identify Trend Strength & Reversals
Use the mid-line and cloud color changes to assess the strength of a trend and spot early signs of reversals.
Monitor Momentum Shifts
Watch for gradient cloud color shifts before the trend line changes color, as this can indicate early weakening or strengthening of momentum.
Act on Trend Shift Markers
Use the orange diamonds as confirmation of trend shifts and potential trade entry or exit points.
Utilize Cloud Bands as Support/Resistance
The outer bands of the cloud act as dynamic support and resistance, helping traders refine their stop-loss and take-profit placements.
⯁ CONCLUSION
The Gradient Trend Filter is an advanced trend detection tool designed for traders looking to anticipate trend shifts with greater precision. By integrating a noise-filtered trend line with a gradient-based trend cloud, this indicator enhances traders' ability to navigate market trends effectively.
Leading
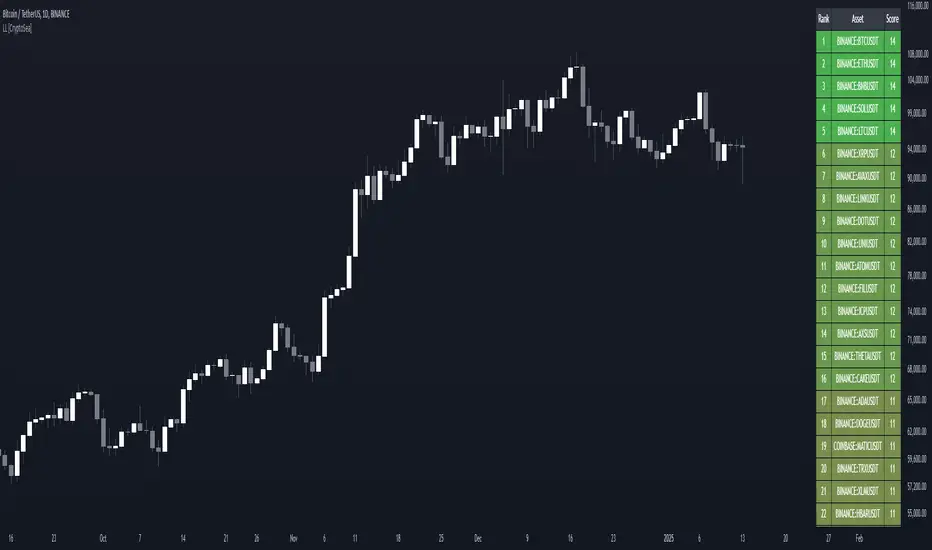
Lead-Lag Market Detector [CryptoSea]The Lead-Lag Market Detector is an advanced tool designed to help traders identify leading and lagging assets within a chosen market. This indicator leverages correlation analysis to rank assets based on their influence, making it ideal for traders seeking to optimise their portfolio or spot key market trends.
Key Features
Dynamic Asset Ranking: Utilises real-time correlation calculations to rank assets by their influence on the market, helping traders identify market leaders and laggers.
Customisable Parameters: Includes adjustable lookback periods and correlation thresholds to adapt the analysis to different market conditions and trading styles.
Comprehensive Asset Coverage: Supports up to 30 assets, offering broad market insights across cryptocurrencies, stocks, or other markets.
Gradient-Enhanced Table Display: Presents results in a colour-coded table, where assets are ranked dynamically with influence scores, aiding in quick visual analysis.
In the example below, the ranking highlights how assets tend to move in groups. For instance, BTCUSDT, ETHUSDT, BNBUSDT, SOLUSDT, and LTCUSDT are highly correlated and moving together as a group. Similarly, another group of correlated assets includes XRPUSDT, FILUSDT, APEUSDT, XTZUSDT, THETAUSDT, and CAKEUSDT. This grouping of assets provides valuable insights for traders to diversify or spread exposure.
If you believe one asset in a group is likely to perform well, you can spread your exposure into other correlated assets within the same group to capitalise on their collective movement. Additionally, assets like AVAXUSDT and ZECUSDT, which appear less correlated or uncorrelated with the rest, may offer opportunities to act as potential hedges in your trading strategy.
How it Works
Correlation-Based Scoring: Calculates pairwise correlations between assets over a user-defined lookback period, identifying assets with high influence scores as market leaders.
Customisable Thresholds: Allows traders to define a correlation threshold, ensuring the analysis focuses only on significant relationships between assets.
Dynamic Score Calculation: Scores are updated dynamically based on the timeframe and input settings, providing real-time insights into market behaviour.
Colour-Enhanced Results: The table display uses gradients to visually distinguish between leading and lagging assets, simplifying data interpretation.
Application
Portfolio Optimisation: Identifies influential assets to help traders allocate their portfolio effectively and reduce exposure to lagging assets.
Market Trend Identification: Highlights leading assets that may signal broader market trends, aiding in strategic decision-making.
Customised Trading Strategies: Adapts to various trading styles through extensive input settings, ensuring the analysis meets the specific needs of each trader.
The Lead-Lag Market Detector by is an essential tool for traders aiming to uncover market leaders and laggers, navigate complex market dynamics, and optimise their trading strategies with precision and insight.
ANN Trend PredictionThis trend indicator utilizes an artificial neural network (ANN) to predict the next market reversal within a certain range of previous candles. The larger the range of previous candles you set, the fewer reversals will be predicted, and trends will tend to last longer.
The ANN is trained on the BTCUSD 4-hour chart, so using it on other assets or timeframes may yield suboptimal results. It takes three input values: the closing price, the Stochastic RSI, and a Choppiness Indicator. Based on these inputs, the ANN categorizes the current candle as part of an uptrend, downtrend, or as undefined.
Compared to an EMA-based trend indicator, this ANN identifies reversals several candles earlier. It achieves this by detecting subtle patterns in the input values that typically appear before a market turnaround. These patterns are somewhat specific to that chosen asset and timeframe.
The results are displayed using rows of triangles that indicate the predicted price direction. The price levels of the triangles correspond to the closing price at the last reversal. The area between the triangle row and the price is colored green if the ANN correctly predicted the move, and red if it did not.
This indicator is designed to showcase the capabilities and potential of ANNs, and is not intended for actual trading use. The ANN can be trained on any other input values, assets and timeframes for several predictions tasks.
You can use the Predicted_Trend_Signal of this Indicator in any backtest indicator. In the Backtester just grap the Predicted_Trend_Signal. downtrend = 1, uptrend = -1, undefined = 0
Feel free to write me a comment.

Leading Economic Indicator (LEI)The Leading Economic Indicator (LEI) is a groundbreaking technical indicator designed to serve as a comprehensive measure of the prevailing direction of economic trends in the United States. This unique index combines two key economic indicators: the Composite Leading Indicator (CLI) from the Organization for Economic Co-operation and Development (OECD) and the Purchasing Managers' Index (PMI) from the Institute for Supply Management (ISM).
The OECD Composite Leading Indicator (CLI) is a globally recognized indicator that assesses the future direction of economic trends by analyzing various leading economic factors. The ISM PMI, on the other hand, provides insights into the business activities of both the manufacturing and services sectors. LEI merges these critical indicators into a single, holistic indicator that empowers traders and investors to grasp the broader economic outlook and the performance of essential economic sectors simultaneously.
By taking into account the CLI and PMI, LEI offers a distinctive perspective, enabling a more accurate assessment of the potential direction of US financial markets.
Usage:
To utilize LEI effectively, it is recommended to apply it on a monthly timeframe (TF Monthly). This extended timeframe is particularly beneficial for investors with a medium to long-term horizon. By focusing on longer-term trends and market stability, LEI becomes an invaluable tool in your investment strategy.
One of the primary applications of LEI is to gauge the risk of market corrections in US financial markets, including the S&P 500, Nasdaq, and Dow Jones indices. Analysts often observe the crossing of the 5-period Simple Moving Average (SMA) with the 10-period SMA. When the 5-period SMA falls below the 10-period SMA, it serves as a potential warning signal for an impending market correction. This feature provides traders with an opportunity to exercise caution and make well-informed investment decisions.
LEI, with its unique blend of the OECD CLI and ISM PMI, provides a reliable tool for assessing the US economic climate, identifying trends, and making informed decisions in the financial markets. It stands as a reference indicator, capturing the essence of economic trends and providing valuable insights to traders and investors.
Sources:
- OECD Composite Leading Indicator (CLI): www.data.oecd.org
- Purchasing Managers' Index: ISM Report on Business (PMI) www.ismworld.org

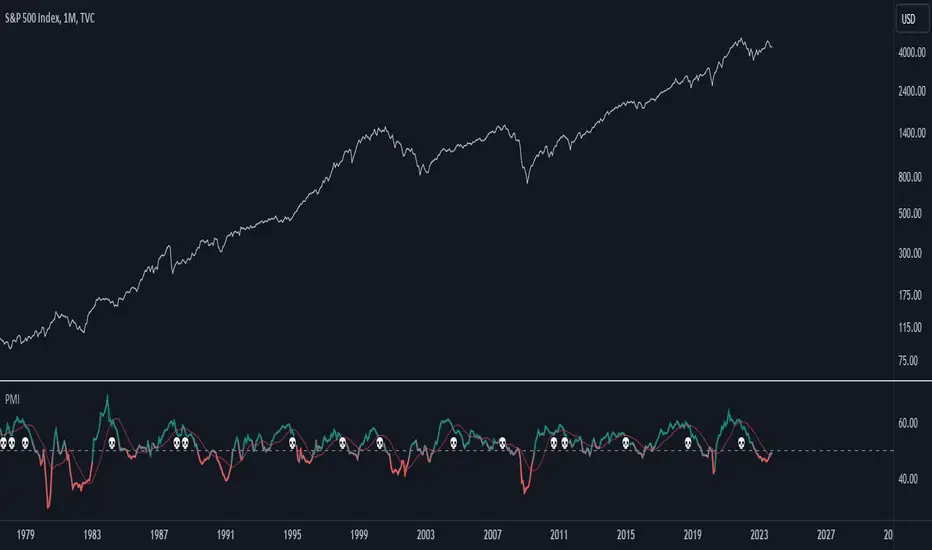
Purchasing Managers Index (PMI)The Purchasing Managers Index (PMI) is a widely recognized economic indicator that provides crucial insights into the health and performance of an economy's manufacturing and services sectors. This index is a vital tool for anticipating economic developments and trends, offering an early warning system for changes in these sectors.
The PMI is calculated based on surveys conducted among purchasing managers in various businesses and organizations. These managers are asked about their perceptions of current business conditions and their expectations for future economic activity within their sectors. The responses are then compiled and used to calculate the PMI value.
A PMI value above 50 typically indicates that the manufacturing or services sector is expanding, suggesting a positive economic outlook. Conversely, a PMI value below 50 suggests contraction, which may be an early indication of economic challenges or a potential recession.
In summary, the Purchasing Managers Index (PMI) is an essential economic indicator that assesses the health of manufacturing and services sectors by surveying purchasing managers' opinions. It serves as an early warning system for changes in economic activity and is a valuable tool for forecasting economic trends and potential crises.
This code combines the Purchasing Managers Index (PMI) data with two Simple Moving Averages (SMA) and some visual elements.
Let's break down how this indicator works:
1. Loading PMI Data:
The indicator loads data for the "USBCOI" symbol, which represents the PMI data. It fetches the monthly closing prices of this symbol.
2. Calculating Moving Averages:
Two Simple Moving Averages (SMAs) are calculated based on the PMI data. The first SMA, sma_usbcoi, has a length defined by the input parameter (default: 2). The second SMA, sma2_usbcoi, has a different length defined by the second input parameter (default: 14).
3. Color Coding and Thresholds:
The line color of the PMI plot is determined based on the value of the PMI. If the PMI is above 52, the color is teal; if it's below 48, the color is red; otherwise, it's gray. These threshold values are often used to identify specific conditions in the PMI data.
4. Crossing Indicator:
A key feature of this indicator is to determine if the PMI crosses the first SMA (sma_usbcoi) from top to bottom while also being above the value of 52. This is indicated by the crossedUp variable. This condition suggests a specific situation where the PMI crosses a short-term moving average while indicating strength (above 52).
5. Visual Elements:
A "💀" skull emoji is defined as skullEmoji.
The PMI is plotted on the chart with color coding based on its value, as described earlier.
The two SMAs are also plotted on the chart.
When the crossedUp condition is met (PMI crosses the first SMA from top to bottom while above 52), a skull emoji (indicating potential danger) is plotted at the top of the indicator window.
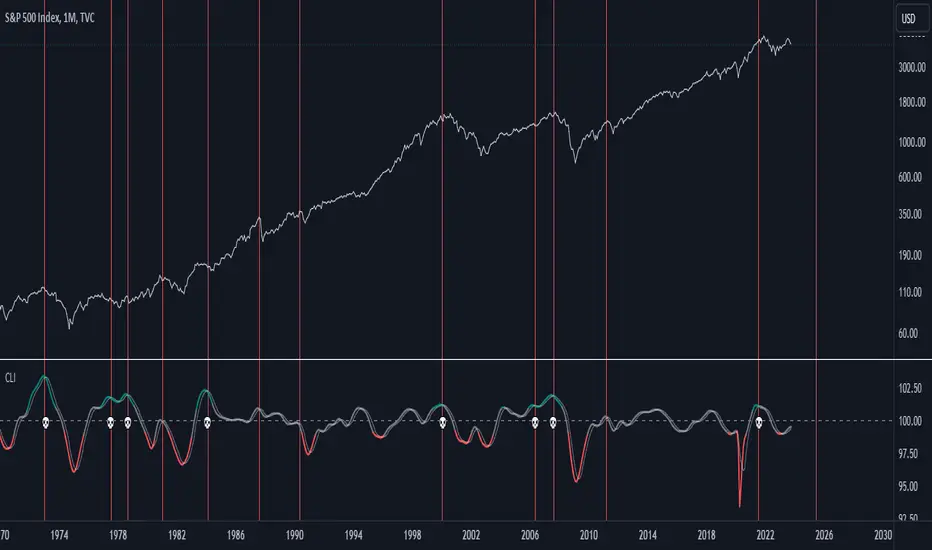
US Composite Leading Indicator (CLI)The US Composite Leading Indicator (CLI), normalized for the United States, closely mirrors the Conference Board "Leading Economic Index" (LEI). It offers unique insights into economic and financial dynamics.
The Composite Leading Indicator (CLI) is an economic tool designed to anticipate economic developments. It is created by aggregating and normalizing a wide range of economic and financial data from various sources.
The normalized data is then aggregated, and a composite indicator is calculated by taking a weighted average of individual indicators.
The CLI is used to provide early insights into the state of the economy and to anticipate future economic trends. It is particularly valuable for predicting economic downturns, including recessions.
The CLI is an essential tool for economists, governments, businesses, and investors seeking to understand economic trends and make informed decisions.
Key Features:
1. Early Warning: Just like its counterpart, the CLI indicator excels at offering early warnings about significant economic events, particularly economic crises. This makes it an indispensable asset for analysts and investors.
2. Recession Indicators: The moving average serves as an early warning system for potential economic recessions. When it crosses the indicator line from the bottom to the top while surpassing a predefined threshold (e.g., 101), it signals a potential crisis.
3. Market Impact: The CLI indicator provides valuable insights into the performance of financial markets, offering cues about indices such as the S&P 500, Nasdaq, Dow Jones, and more.
Why It Matters:
Understanding the US Composite Leading Indicator (CLI) indicator, normalized for the United States, is crucial for anticipating economic shifts and preparing for changes in financial markets. By analyzing a diverse array of economic factors, it provides a holistic view of economic well-being. Whether you're an investor or economist, this indicator can be an invaluable resource for staying informed about market trends and major economic developments.
Source:
www.data.oecd.org
On Balance Volume DeviationThe objective of this indicator is to be a leading indicator that can detect a large price change before it happens. It is based on the On Balance Volume (OBV) indicator, which is a leading indicator based on the premise that a large change in volume often precedes a large price change. This indicator charts the N-Period deviation of the OBV data and displays it as a histogram. This is overlayed on an area chart of the M-Period SMA of the histogram data. This combination helps to visually enhance the pattern that signifies that a jump in price is about to happen.
Useage:
When the histogram bars are above the area plot, then a jump in price is about to happen
As with all leading indicators, there are a lot of false signals. Confirm with price action or another indicator
The further the histogram bars are above the area plot, the larger the predicted jump in price
It seems to work better on shorter intraday timeframes than on the longer timeframes
At the close of a market session, it is a good indicator of how much the price will jump on the opening of the next market session.

Leading Indicator [TH]The leading indicator is helpful to identify early entries and exits (especially near support and resistance).
Green = trend up
Red = trend down
How it works:
The leading indicator calculates the difference between price and an exponential moving average.
Adding the difference creates a negative lag relative to the original function.
Negative lag is what makes this a leading indicator.
The amount of lead is exactly equal to the amount of lag of the moving average.
The leading indicator has lagging signals at turning points.
The leading indicator will always have noise gain, which gets eliminated by applying a moving average.
Modifying the alpha values will modify the amount of noise and change the sensitivity of trend change.
Example 1: Changing alpha1 from 0.25 to 0.15 lowers noise, more clearly identifies trend, and adds delay to this indicator.
Example 2: Changing alpha1 from 0.25 to 0.35 increases noise, less clearly identifies trend, BUT more quickly indicates a trend change.
Calculations:
Where:
alpha1 = 0.25
alpha2 = 0.33
Leading = 2 * (arithmetical mean of current High and Low price) + (alpha1 - 2) * (arithmetical mean of previous High and Low price) + (1 - alpha1) * (previous 'Leading' value)
Total Leading = alpha2 * leading + (1 - alpha2) * (previous 'Total Leading' value)
EMA = 0.5 * (arithmetical mean of previous High and Low price) + 0.5 * (previous 'EMA' value)
Uptrend when 'Total Leading' value is greator than the EMA
Downtrend when 'Total Leading' value is lesser than the EMA
Cybernetic Analysis for Stocks and Futures, by John Ehlers (page 231-235)

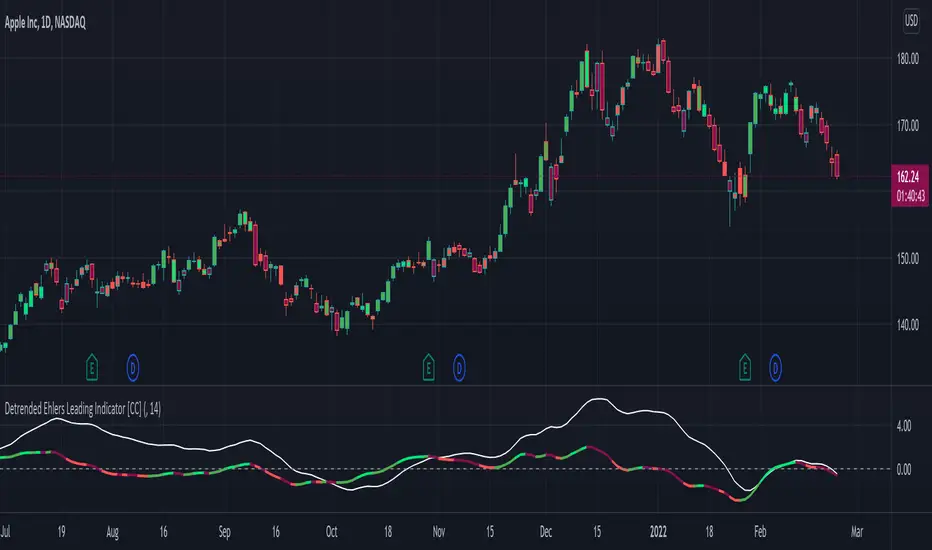
Detrended Ehlers Leading Indicator [CC]The Detrended Ehlers Leading Indicator was created by Bill Mars based off of Ehlers work and this is his attempt to create a leading indicator based on the previous Detrended Synthetic Price . I will be honest that this is a bit of a strange script because it is an indicator based off of the detrended synthetic price which is based off of Ehlers work so I haven't found clear buy and sell signals so I'm open to suggestions. His suggestion for buy and sell signals is to only buy and sell at the indicator crossings but haven't found buy and sell logic that I'm sure about. I have included strong buy and sell signals in addition to normal ones so strong signals are darker in color and normal signals are lighter in color. Buy when the line turns green and sell when it turns red.
Let me know if there are any other indicators or scripts you would like to see me publish!
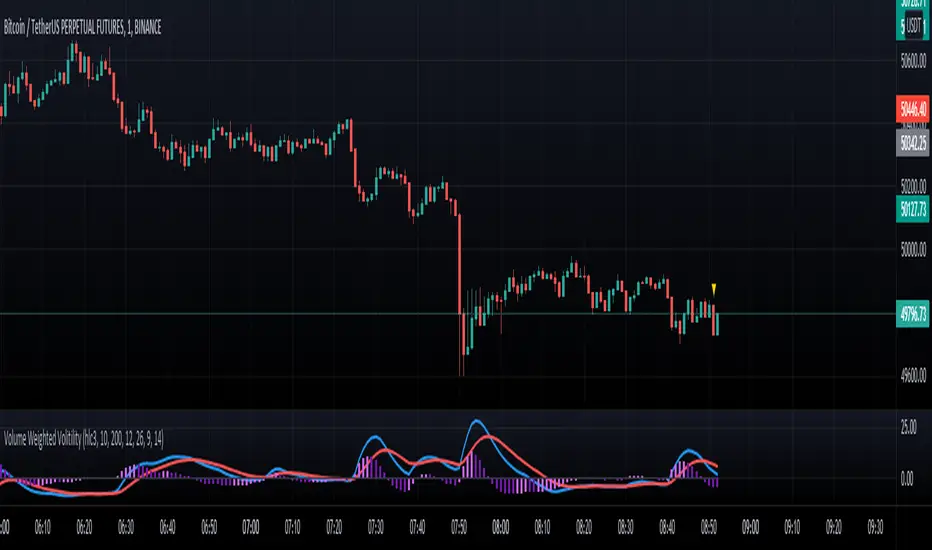
Volume Weighted Volitility MACDVolume Weighted Volatility MACD is inspired by the concept mentioned in a paper on volume weighted volatility , implementing MACD on top of it helps gauge the variation in "activity" which can be interpreted as a leading momentum indicator, it cycles from trending : hist>0 to corrective movement : hist < 0 .
This is my first published script !
I need help testing the capabilities of this indicator.
Looking forward to your reviews!
MMRI+MASimple script based on Gregory Mannarino's Risk indicator using the DXY and US10Y. Use it as you would an RSI but more of a leading indicator.

Volume EffectivenessI have been trying to work with volume as an indicator for quite some time, as it holds qualities as a 'leading indicator'.
However, please note that any indicator which to some extent predict a future trend has its issues as it can be misleading.
But, in some datasets in a selected timeframe the leading properties of volume as an indicator are useful.
So this script is not too complicated. It shows a numeric which resembles the 'effectiveness of volume' in moving price.
For example, if a small volume creates a large price change - the Volume Effectiveness indicator will be high and show a spike
Whereas, if a large volume creates a small price change - the Volume Effectiveness indicator will be low
I used 3 metrics to represent Volume Effectiveness (these are different colors on the bar chart)
One price difference is the absolute(high - low) for each bar
Another is the absolute(open - close)
The 'open-close' is smaller than the 'high-low', so note this when viewing the bar charts
The final metric depends on if the open is greater than the close or vice-versa
But it considers the 'absolute(high-low)' and the difference between the open and the high (or low) and the close and the low (or high)
So the final metric is the largest of the 3 metrics and is generally the most useful of the 3 however, the other 2 are displayed to provide a better understanding of what 'Volume Effectiveness' displays
Note, I use absolute values so they are only positive, i.e. there are no negative values to represent a price drop within a bar
So, why is this indicator useful - its because volume is a leading indicator
A decreasing volume tends to suggest a price change is coming
Also, when the volume within a bar is very small, its Volume Effectiveness tends to go very high
That means a small trade volume creates a relatively large change in price
This is ideal conditions for a big pump (or big dump - although this indicator seems to work better before pumps)
A large spike in the Volume Effectiveness is commonly/sometimes preceding a big pump
So watch this indicator - and if there is a big spike - evaluate other market conditions to consider getting into position
Large spikes in the Volume Effectiveness can precede big price changes and therefore can provide a leading indication before a pump or dump
Timeframe is important - I found on the daily timeframe this indicator did not provide sufficient lead to be useful. Similarly on the <15min timeframe the spikes were not highly correlated with pumps/dumps
However, in medium timeframes (15mins, 1hour, 4hours) this indicator can be useful for predicting sizeable price changes.

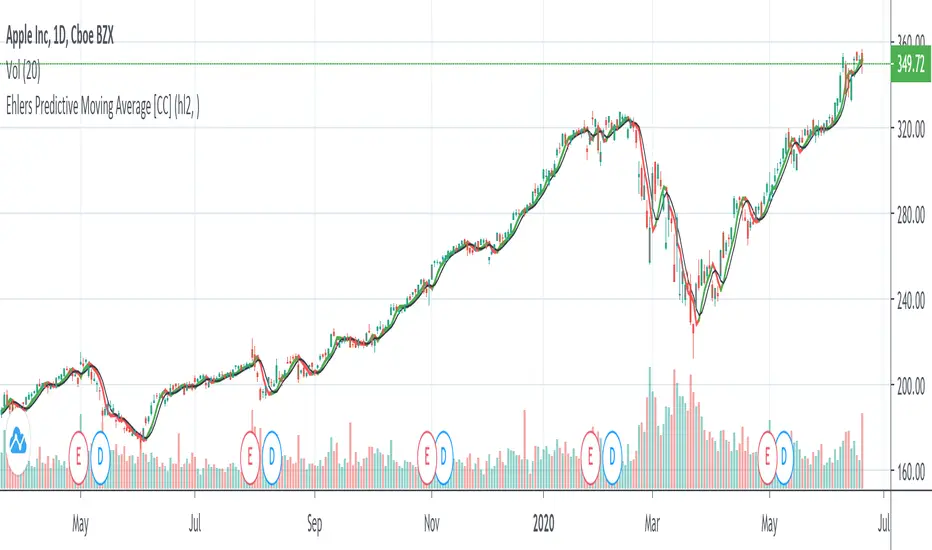
Ehlers Predictive Moving Average [CC]The Predictive Moving Average was created by John Ehlers (Rocket Science For Traders pg 212) and this is one of his first leading indicators. I have been asked by many people for more leading indicators so this one is for you all! Buy when the indicator line is green and sell when it is red.
Let me know if there are other indicators you would like to see me publish or if you want something custom done!
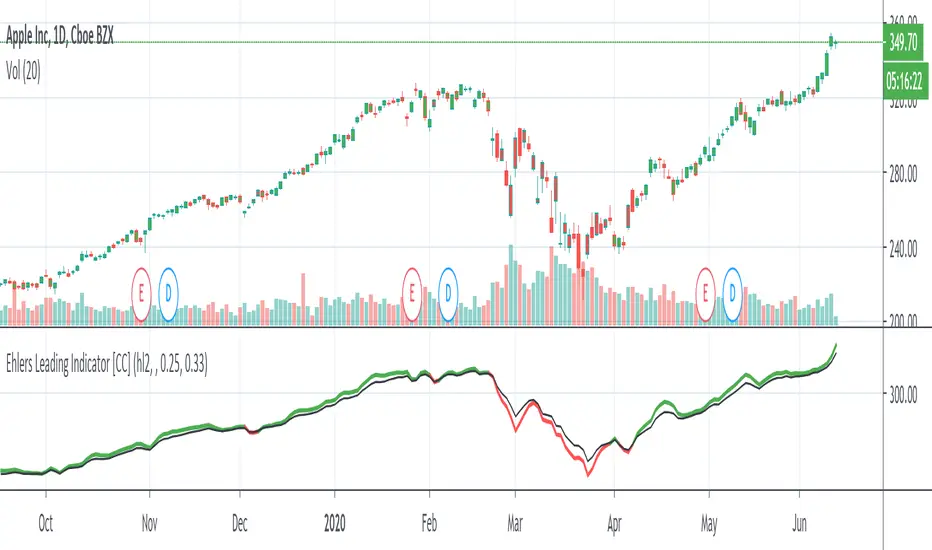
Ehlers Leading Indicator [CC]The Leading Indicator was created by John Ehlers (Cybernetic Analysis For Stocks And Futures pg 235) and as the name implies, this is a leading indicator that provides super early signals. Feel free to change the alpha values to adjust to your needs. Buy when the indicator line is green and sell when it is red.
Let me know if there are other scripts you would like to see me publish or if you want something custom done!
Ehlers Hilbert Oscillator [CC]The Hilbert Oscillator was created by John Ehlers (Rocket Science For Traders pgs 90-91) and just like the sinewave indicator that I published yesterday, this is also a leading indicator. The big difference between this indicator and the sinewave is that this indicator works very well for determining major turning points in the stock before they happen. You will notice that when the blue line crosses over the red line that a few bars from that point, the stock will start an uptrend and the reverse is true. I have also included immediate buy and sell signals over the 0 line so buy when the line is green and sell when it is red
Let me know if you would like to see any other scripts from me or if you want something custom done!

Ehlers Sinewave Indicator [CC]The Sinewave Indicator was created by John Ehlers (Rocket Science For Traders pgs 97-99) and this is a few indicators in one. Simply put it is a leading indicator which you don't see too many of those these days. If the blue line crosses over the red line then within the next few bars the price will start an uptrend and if the blue line crosses below the red line then in the next few bars it will start a downtrend. I have also included an immediate buy and sell signal on the 0 line which is green when you should buy and red when you should sell.
Let me know if you would like to see any other scripts or if you want something custom done!

Varadi OscillatorThe Varadi Oscillator (VDO) is a leading indicator first proposed by David Varadi and originally aim to reduce the influence of the trend component in oscillators. The DVO can be described as a rolling percent rank of detrended prices over a certain lookback period. The detrending process used for the calculation of the indicator is based on the simple moving average of the ratio between the closing price and median (hl2) price.
Both the length of the percent rank and the moving average used for detrending can be adjusted by the user. We can see that the VDO can lead price movements.
Don't have time to post anything else, if the indicator is too simple, moderators can feel free to remove it and ban me for some time, won't complain.

VPTbollfib & Camarilla (Danarilla)I do not own the original indicators. This is just a combination of the two because of their nature to work in a similar way.
Camarilla Pivots run on the basis of intraday range trading. Usually after daily open you look the fade whatever move happened before. by shorting R3/H3 levels or longing R3/L3. Targeting the other side of the range. This is the infamous PivotBoss level calculations and you would want to activate camarilla and turn off the normal pivots. They use the previous days volatility to plot the next days levels.
But what about some confirmation?
Well RafaelIzoni (who made it open source for improvement) threw together this VPTbollfib. It is volume price trend crossing down a fib line using bollinger bands as price envelope. The beauty of this is that It will signal usually counter to current price action based on selling into uptrends or vise versa. Meaning you get signals to counter price. Which is what you might be looking for on range day trade scalps for camarilla. A wick reversal or engulfing + volume based signal is a very happy pairing together. And those signals are usually suitable for the target of the range you are day trading. Hourly time frame works quite well for both. And camarilla should also be on daily settings.
Special Thanks to Nanda (who published the pivotboss indicator AND) Helped to merge the scripts together.
This indicator alone is an entire trade system. Camarilla already is. If you know the rules. it can be used for entries, exits, risk management to trade the range on TREND, COUNTER TREND, and BREAKOUT plays. The bollinger band fibs add confirmation to the trends levels. And the VPT adds a secondary confirmation to take a camarilla trade.
Try it out. I think you will find both the levels on camarilla and the VPT signals quite suprising.

Z Score Enhanced Time Segmented Volume (Multi MA)**THIS VERSION HAS BEEN STANDARDIZED WITH A Z SCORE CALCULATION AND ALLOWS THE USER TO SELECT WHICH MOVING AVERAGE THEY WOULD LIKE TO UTILIZE FOR THE SIGNAL LINE**
Chart shows the Non-Standardized Enhanced Time Segmented Volume (Multi MA) with default settings on top and the Standardized version with default settings on the bottom.
Time Segmented Volume was developed by Worden Brothers, Inc to be a leading indicator by comparing various time segments of both price and volume . Essentialy it is designed to measure the amount of money flowing in and out of an instrument.
Time Segmented Volume was originally ported to TradingView by user @liw0 and later corrected by user @vitelot. I never quite understood how to read Time Segmented Volume until I ran across a version by user @storma where they indicated when price would be long or short, but that code also utilized the incorrect calculation from user @liw0.
In an effort to make Time Segmented Volume more accessible and easier to read, I have re-coded it here. The calculations are based on the code from @vitelot and I have added direction indicators below the chart.
If the histogram (TSV) is greater than zero and greater than the moving average, price should be moving long and there will be a green box below the chart.
If TSV falls below the moving average while still being greater than zero, the trend may be exhausting and has been coded to read Price Action Long - FAILURE with a black x below the chart.
If the histogram (TSV) is less than zero and less than the moving average, price should be moving short and there will be a red box below the chart.
If TSV rises above the moving average while still being less than zero, the trend may be exhausting and has been coded to read Price Action Short - FAILURE with a black x below the chart.
At times, the moving average may be above zero while TSV is below zero or vice versa. In these situations the chart will indicate long or short based on whether or not TSV is greater or less than zero. It is possible a new trend may be forming as the moving average obviously lags, but also possible price is consolidating with little volume and causing TSV to oscillate close to zero.
**Z Score // Standardized Option **
Thist Standardized code implements all of the above but also allows the user to select a threshold level that should not need to be adjusted for each instrument (since the output is standardized).
If the TSV value meets the long and short signal requirements above and TSV is greater than the threshold values a green or red box will print ABOVE the oscillator. The histogram will also change color based on which threshold TSV has met.
This calculation allows us to compare current volatility to the mean (moving average) of the population (Z-Length). The closer the TSV Z-Score is to the mean, the closer it will be to the Zero Line and therefore price is likely consolidating and choppy. The farther TSV Z-Score is from the mean, the more likely price is trending.
The MA Mode determines the Moving Average used to calculate TSV itself. The Z-Score is ALWAYS calculated with a simple moving average (as that is the standard calculation for Z-Score).
The Threshold Levels are the levels at which TSV Z-Score will change from gray to yellow, orange, green ( bullish ), or red ( bearish ).
Statistically speaking, confidence levels in relation to Z-Score are noted below. The built in Threshold Levels are the positive and negative values for 90%, 95%, and 99%. This would indicate when volatility is greater than these values they are out of the ordinary from the standard range. You may wish to adjust these levels for TSV Z-Score to be more responsive to your trading needs
80% :: 1.28
85% :: 1.44
90% :: 1.64
95% :: 1.96
99% :: 2.58
The Z Length is the period for which the Z Score is calculated
More information regarding Time Segmented Volume can be found here: www.worden.com
Original code ported by @liw0
Corrected by @vitelot
Updated/Enhancements by @eylwithsteph with inspiration from @storma
Multiple MA Options Credits to @Fractured and @lejmer
Bits and Pieces from @AlexGrover, @Montyjus, and @Jiehonglim
As always, trade at your own risk.

Enhanced Time Segmented Volume (Multi MA)**THIS VERSION ALLOWS THE USER TO SELECT WHICH MOVING AVERAGE THEY WOULD LIKE TO UTILIZE FOR THE SIGNAL LINE**
Chart shows two different options of many. Top option is the default settings and bottom option is a different moving average with no other changes.
Time Segmented Volume was developed by Worden Brothers, Inc to be a leading indicator by comparing various time segments of both price and volume. Essentialy it is designed to measure the amount of money flowing in and out of an instrument.
Time Segmented Volume was originally ported to TradingView by user @liw0 and later corrected by user @vitelot. I never quite understood how to read Time Segmented Volume until I ran across a version by user @storma where they indicated when price would be long or short, but that code also utilized the incorrect calculation from user @liw0.
In an effort to make Time Segmented Volume more accessible and easier to read, I have re-coded it here. The calculations are based on the code from @vitelot and I have added direction indicators below the chart.
If the histogram (TSV) is greater than zero and greater than the moving average, price should be moving long and there will be a green box below the chart.
If TSV falls below the moving average while still being greater than zero, the trend may be exhausting and has been coded to read Price Action Long - FAILURE with a black x below the chart.
If the histogram (TSV) is less than zero and less than the moving average, price should be moving short and there will be a red box below the chart.
If TSV rises above the moving average while still being less than zero, the trend may be exhausting and has been coded to read Price Action Short - FAILURE with a black x below the chart.
At times, the moving average may be above zero while TSV is below zero or vice versa. In these situations the chart will indicate long or short based on whether or not TSV is greater or less than zero. It is possible a new trend may be forming as the moving average obviously lags, but also possible price is consolidating with little volume and causing TSV to oscillate close to zero.
More information regarding Time Segmented Volume can be found here: www.worden.com
Original code ported by @liw0
Corrected by @vitelot
Updated/Enhancements by @eylwithsteph with inspiration from @storma
Multiple MA Options Credits to @Fractured and @lejmer
Bits and Pieces from @AlexGrover, @Montyjus, and @Jiehonglim
As always, trade at your own risk.

Enhanced Time Segmented VolumeTime Segmented Volume was developed by Worden Brothers, Inc to be a leading indicator by comparing various time segments of both price and volume. Essentialy it is designed to measure the amount of money flowing in and out of an instrument.
Time Segmented Volume was originally ported to TradingView by user @liw0 and later corrected by user @vitelot. I never quite understood how to read Time Segmented Volume until I ran across a version by user @storma where they indicated when price would be long or short, but that code also utilized the incorrect calculation from user @liw0.
In an effort to make Time Segmented Volume more accessible and easier to read, I have re-coded it here. The calculations are based on the code from @vitelot and I have added direction indicators below the chart.
If the histogram (TSV) is greater than zero and greater than the moving average, price should be moving long and there will be a green box below the chart.
If TSV falls below the moving average while still being greater than zero, the trend may be exhausting and has been coded to read Price Action Long - FAILURE with a black x below the chart.
If the histogram (TSV) is less than zero and less than the moving average, price should be moving short and there will be a red box below the chart.
If TSV rises above the moving average while still being less than zero, the trend may be exhausting and has been coded to read Price Action Short - FAILURE with a black x below the chart.
At times, the moving average may be above zero while TSV is below zero or vice versa. In these situations the chart will indicate long or short based on whether or not TSV is greater or less than zero. It is possible a new trend may be forming as the moving average obviously lags, but also possible price is consolidating with little volume and causing TSV to oscillate close to zero.
More information regarding Time Segmented Volume can be found here: www.worden.com
Original code ported by @liw0
Corrected by @vitelot
Updated/Enhancements by @eylwithsteph with inspiration from @storma
As always, trade at your own risk.

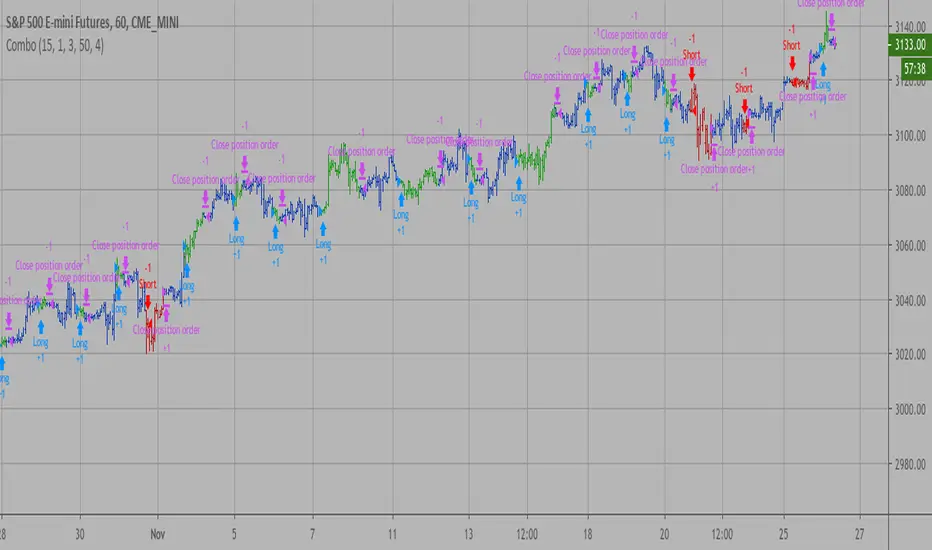
Combo Backtest 123 Reversal & D_ELI (Ehlers Leading Indicator) This is combo strategies for get a cumulative signal.
First strategy
This System was created from the Book "How I Tripled My Money In The
Futures Market" by Ulf Jensen, Page 183. This is reverse type of strategies.
The strategy buys at market, if close price is higher than the previous close
during 2 days and the meaning of 9-days Stochastic Slow Oscillator is lower than 50.
The strategy sells at market, if close price is lower than the previous close price
during 2 days and the meaning of 9-days Stochastic Fast Oscillator is higher than 50.
Second strategy
This Indicator plots a single
Daily DSP (Detrended Synthetic Price) and a Daily ELI (Ehlers Leading
Indicator) using intraday data.
Detrended Synthetic Price is a function that is in phase with the dominant
cycle of real price data. This one is computed by subtracting a 3 pole Butterworth
filter from a 2 Pole Butterworth filter. Ehlers Leading Indicator gives an advanced
indication of a cyclic turning point. It is computed by subtracting the simple
moving average of the detrended synthetic price from the detrended synthetic price.
Buy and Sell signals arise when the ELI indicator crosses over or under the detrended
synthetic price.
See "MESA and Trading Market Cycles" by John Ehlers pages 64 - 70.
WARNING:
- For purpose educate only
- This script to change bars colors.
