Liquidation_linesLibrary "Liquidationline"
f_calculateLeverage(_leverage, _maintainance, _value, _direction)
Parameters:
_leverage
_maintainance
_value
_direction
f_liqline_update(_Liqui_Line, _killonlowhigh)
Parameters:
_Liqui_Line
_killonlowhigh
f_liqline_draw(_Liqui_Line, _priceorliq)
Parameters:
_Liqui_Line
_priceorliq
f_liqline_add(_Liqui_Line, linetoadd, _limit)
Parameters:
_Liqui_Line
linetoadd
_limit
Liquidationline
Fields:
creationtime
stoptime
price
leverage
maintainance
line_active
line_color
line_thickness
line_style
line_direction
line_finished
text_active
text_size
text_color
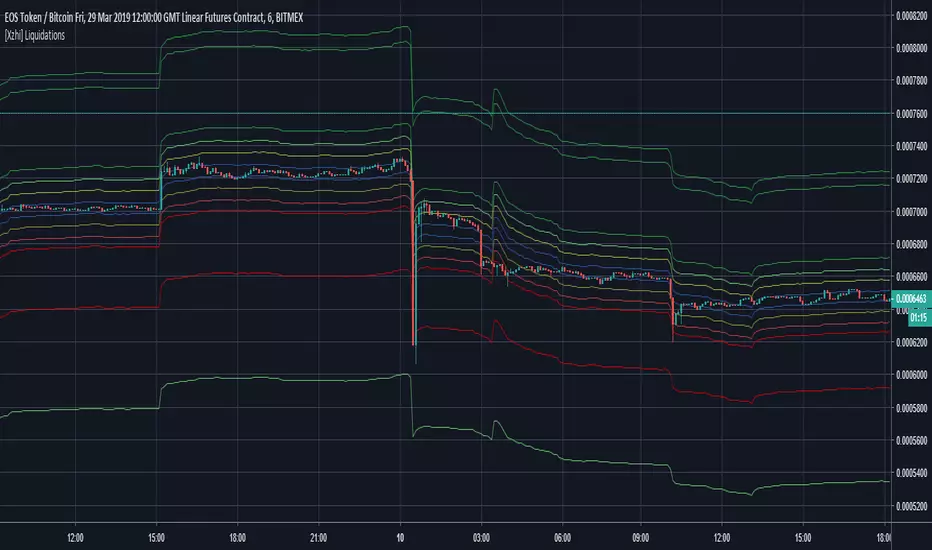
this library can draw typical liquidation lines, which can be called e.g. by indicator signals
You can see the default implementation in the lower part of the code, starting with RUNTIME
Don't forget to increase max lines to 500 in your script.
It can look like this screenshot here, with only minor changes to your executing script.
The base is the same
Liquidationlevels

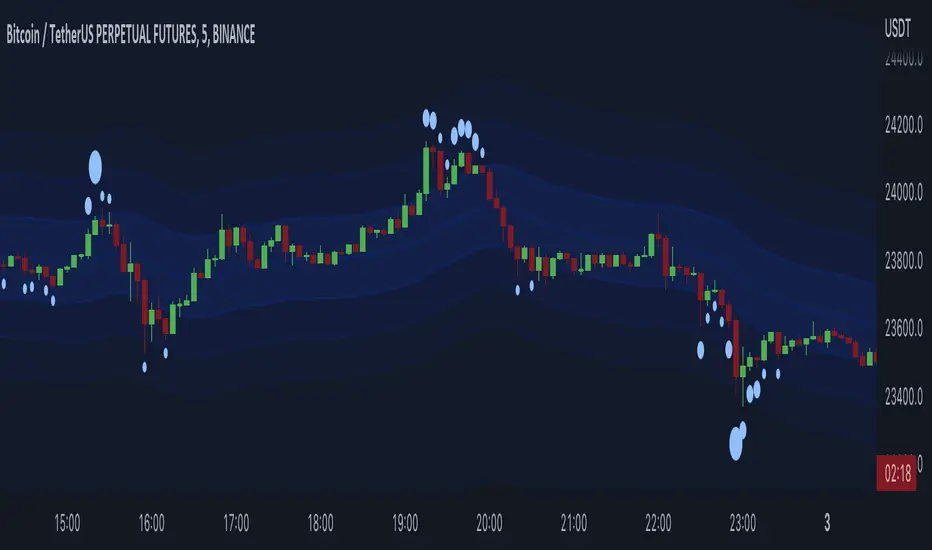
Liquidation Bands (+CVD Bubbles) - By LeviathanAlong with CVD bubbles, this script plots continuous bands that represent 100x, 75x, 50x, 25x liquidation levels. The bands can serve as support/resistance, reversal points, expected volatility range and more.
The indicator uses either the Exponential Moving Average (EMA) or the Volume Weighted Average Price (VWAP) as a base for plotting continuous lines and zones set at the approximate distance of 100x, 75x, 50x, 25x leverage liquidation prices.
These bands can help you visualize:
- Dynamic Support and Resistance levels
- Levels that the price will gravitate towards
- Expected price range (potential volatility)
- Reversal points
- ...
The "CVD Bubbles" part of this script plots circles that are based on my imitation of Cumulative Volume Delta (CVD).
CVD Bubbles will appear when buy/sell volume is increased. The larger the bubble, the more buying/selling at that candle.
"Buy Order" CVD Bubbles appear above candles and might signal:
- Late longers entering the market
- Large short liquidations (closed short=buy order)
- Large market buys getting absorbed by limit sell orders
=> Bias: potential reversal to the downside
"Sell Order" CVD Bubbles appear below candles and might signal:
- Late shorters entering the market
- Large long liquidations (closed long=sell order)
- Large market sells getting absorbed by limit buy orders
=> Bias: potential reversal to the upside
Combining Liquidation Bands and CVD Bubbles can serve you as confluence for taking a trade, but don't follow them blindly.
Settings:
"Mode" - Choose the base for Liquidation Bands (EMA or VWAP)
"EMA/CVD Length" - Choose the length (number of bars) for calculating EMA and CVD
"Level Calculation Mode" - Choose between 3 variations of calculating the distance to Liquidation Bands
"Standard Deviation Length" - Choose the length used for calculating the thresholds of CVD
"Appearance" - Choose the colors of lines, zones and CVD Bubbles
"STDEV MULT." - Multiply the thresholds used for CVD Bubble Sizes
Liquidation Levels V2 (Ultimate Edition)!(version 2.0) - Covers ALL pairs from Binance futures (USDT)!
The Liquidations Level Indicator is a new, fresh and innovative indicator that adds a new perspective into the charts.
The indicator plots (in real time !), the liquidation points/levels that are "created" for every new position that is currently opened in futures trading of a cryptocurrency.
The calculation and the plots work for both directions (either longs or shorts).
How it is done: We calculate all new large positions opened by other traders, by taking into account the Open Interest from major exchanges.
For each new large position that is opened, the indicator plots in the chart the liquidation levels for the specific position per leverage level (100x, 50x or 25x).
This is exactly what the Market Maker knows!
In crypto, the Market Maker, tends to push the price to these levels, making these levels targets.
You could combined it with any other Technical Analysis indicator you used to trade.
Add it to your favorites indicators and enjoy the price action. You will soon realize that our indicator can be a game-changer indicator !
Soon, we will add some here in TradingView, some ideas and strategies that we have already used with this indicator with success.
Here, a new game starts for you..and the Market Maker. Don't trade against him, trade with him (!)
_____________________________
Notes:
_____________________________
1) Second version supports allt the USDT crypto that are tradable on Binance futures (at least).
Right now you can use any of them (e.g. BTC , ETH, BNB, XRP, ADA, SOL, DOT, DOGE, MATIC, LTC, ATOM, , etc. )
paired with one of the above stablecoins:
USD, USDT, USDC , or BUSD.
2) You can adjust the lower limit to take into account for new positions (total amount is in millions USD/USDT/ USDC ), so you can filter the positions and display only the large ones.
This adjustment is up to you and it is different for each coin, as they have huge differences in Total Market Cap and the Total amount trading per day.
BTC is almost always first, and then ETH, Luna, etc. From our experience a amount of 5m in USD fits for BTC , 2m USD for ETH, and you can of course switch it.
3) Don't use the indicator with any other pair, except the above ( /USD, /USDT, /BUSD or / USDC ). The Open Interest is calculated per USD, so if you project this over a crazy pair (e.g. BTC /LTC) it will not project anything.
4) Initial version supports reading the Open Interest from Binance. Upcoming versions will expand this, as an option.
_____________________________
Extras:
_____________________________
This was our first effort to build something for the crypto community, that can be useful and of course free.
We hope we like it. If you like the indicator, just spread it.

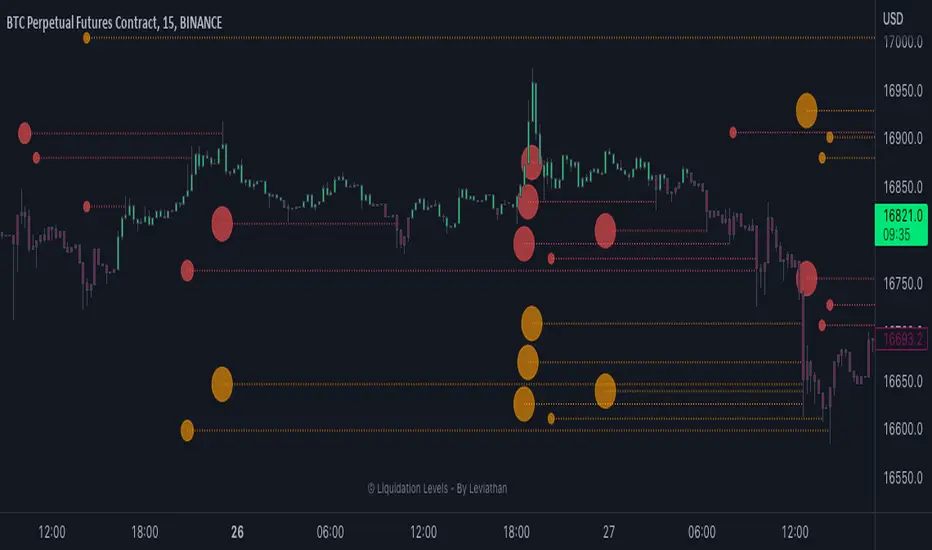
Liquidation Levels - By LeviathanThis indicator generates liquidation levels of over-leveraged traders and utilizes a variety of different tools to analyze data such as Open Interest and Volume to provide an edge in your trading system and help you with valuable market insights.
The concept of this indicator is inspired by the platform Hyblock and their Liquidation Levels tool.
The script offers a lot of flexibility in settings, so please read these instructions and test out different parameters to see what works best for you. Here is a short overview of all inputs, one by one.
PRIMARY SOURCE OF DATA
This input allows you to choose the primary source of data that the script uses to calculate liquidation levels. I encourage you to test them all and see which works best for the assets and timeframes you trade. You can also regularly switch between to see confluences.
My personal favorite inputs (and also most accurate ones) are Open Interest, Open Interest + Volume (OI+VOL), and Open Interest + CVD (OI+CVD), as they utilize Open Interest in the calculations, which is the most important factor when it comes to analyzing position opening/closing and market activity in general. The other options that do not include Open Interest (Volume, CVD) were mainly added to provide the possibility to use the indicator on pairs where OI data is not available. Please note that this indicator is built on Tradingview and can only use data (e.g., Open Interest) provided by Tradingview, which is unfortunately quite limited. This is why I recommend using the script with OI-based data source inputs on Binance's perpetual futures pairs, as this is where OI data is available. The volume-based data source inputs can be used on spot pairs, forex, indices, and other markets, where Open Interest data is not provided.
To summarize the use of Primary Source of Data input:
1. Open Interest - use on Binance’s perpetual futures or anywhere else where OI data is available
2. OI + VOL - use on Binance’s perpetual futures or anywhere else where OI data is available
3. OI + CVD - use on Binance’s perpetual futures or anywhere else where OI data is available
4. CVD - use on any pair you wish
5. Volume - use on any pair you wish
DIRECTIONAL BIAS
If turned on, the Directional bias function uses volume and some other calculations to predict which side’s liquidation levels are more likely to be filled and only keep those levels on your chart.
- Directional Bias for Liquidation Levels
Turned ON: only one side’s liquidation levels are shown on the chart
Turned OFF: all liquidation levels are shown on the chart
- Directional Bias for Liquidation Level Bubbles
Turned ON: only one side’s liquidation level bubbles are shown on the chart
Turned OFF: all liquidation level bubbles are shown on the chart
I've separated directional bias options between Liquidation Levels and Liquidation Level Bubbles because sometimes it can be useful to have one of them ON and the other one OFF.
REDUCE SENSITIVITY
The Reduce Sensitivity option allows you to multiply the thresholds for "Smaller Size Liquidation," "Medium Size Liquidation," and "Large Size Liquidation" simultaneously. This is a useful feature as it enables you to easily filter larger positions and their liquidations without having to manually alter the standard deviation multipliers, which will be discussed in further detail later in the article.
The default value is 1, which means that it does nothing.
Increasing it above 1 will increase all thresholds and therefore generate fewer liquidation levels but with larger relative sizes.
Decreasing it below 1 will lower all thresholds and therefore generate more liquidation levels but with both smaller and larger relative sizes.
BASE
This input gives you the possibility to choose between four different bases, from which the liquidation levels will be generated.
CLOSE ⇒ Levels are plotted above and below the close of the candle
HALF ⇒ Levels are plotted above and below the middle of the candle ((high+low)/2)
VWAP ⇒ Levels are plotted above and below the volume-weighted average price
VWMA ⇒ Levels are plotted above and below the volume-weighted moving average
I suggest that you backtest them and see what works best for you.
LIQUIDATION LEVEL BUBBLES
If enabled, "Liquidation Level Bubbles" mark the beginning of a new liquidation level and indicate the relative size of liquidations that would occur if the price were to reach that level.
Liquidation Bubbles or Liquidation Levels in general appear when there is a large influx of new positions and logically, (significant) new positions lead to (significant) new liquidation levels. Liquidation Bubbles can be used to estimate the size and therefore significance of a given liquidation level. It could be argued that the price is more likely to be attracted to larger Liquidation Level Bubbles. While this is often true, it is not always the case as the strong momentum created by large positions can sustain for a prolonged period before reversing and filling the remaining levels Similarly to other features in this indicator, significant new positions are identified and filtered using standard deviation thresholds and their multipliers. New positions are considered significant when newly opened positions exceed the threshold for "Smaller Size Liquidation," leading to the creation of new liquidation levels and bubbles.
1. If new positions exceed the first standard deviation multiplier ("Smaller Size Liquidation Level"), but do not exceed “Medium Size Liquidation Level”, a smaller-sized bubble appears.
2. If new positions exceed the second standard deviation multiplier (”Medium Size Liquidation Level”), but do not exceed “Large Size Liquidation Level”, a medium-sized bubble appears.
3. If new positions surpass the third standard deviation multiplier (”Large Size Liquidation Level”), a large-sized bubble appears.
Significant opened positions are identified and filtered by size using three "thresholds" in the form of standard deviations, which can be modified in the indicator settings, in the section called "Standard Deviation Multipliers".
**Increasing** the standard deviation multipliers of Liquidation Level Bubbles effectively increases the threshold for a given bubble to occur, making the conditions for its appearance stricter.
⇒ Fewer Liquidation Levels - just larger positions are included
**Decreasing** the standard deviation multipliers of Liquidation Level Bubbles effectively decreases the threshold for a given bubble to occur, making the conditions for its appearance looser.
⇒ More Liquidation Levels - smaller positions are included
Keep in mind that this should always be the case:
*Smaller Size Liquidation Level < Medium Size Liquidation Level < Large Size Liquidation Level*
MARKET ORDER BUBBLES
"Market Order Bubbles" is my experimental concept used as a way to analyze large volumes and visualize the market activity at significant levels under certain conditions. It is based on my imitation of CVD which is also used in other parts of the script. The aim of this concept is to give you an idea about the real-time heavy market buying and selling, which could indicate eg. large liquidations, large entries/exits. in order to add confluence to your analysis. Please note that this concept is still in its early stages and may be confusing as it might have been poorly implemented. I recommend taking the time to thoroughly read through this section in order to fully understand it. On the other hand, early backtesting results appear very promising, as the win rate of countertrading buy and sell bubbles under certain conditions was fairly high (70%). I will continue working on this tool, so stay tuned for future updates.
**Market Buy Order Bubbles** appear above the price and possibly signal the following:
- Short positions being liquidated (exit short = buy order)
- New traders entering late longs based on FOMO (enter long = buy order)
- New short positions (sells) of “smarter” traders absorbing liquidated/closed shorts (buys)
⇒ Possible reversal to the downside - look for the liquidation levels of longs to get filled
**Market Sell Order Bubbles** appear below the price and possibly signal the following:
- Long positions being liquidated (exit long = sell order)
- New traders entering late shorts based on FOMO (enter short = sell order)
- New long positions (buys) of “smarter” traders absorbing liquidated/closed longs (sells)
⇒ Possible reversal to the upside - look for the liquidation levels of shorts to get filled
significant volumes are identified and filtered using three “thresholds” in the form of standard deviations, which can be modified in indicator settings.
1. If buy/sell volume surpasses the first standard deviation (”**Smaller Size Market Orders**”), then the **smaller-sized bubble** appears.
2. If buy/sell volume surpasses the second standard deviation (”**Medium Size Market Orders**”), then the **medium-sized bubble** appears.
3. If buy/sell volume surpasses the third standard deviation (”**Large Size Market Orders**”), then the **large-sized bubble** appears.
**Increasing** the standard deviation multipliers effectively increases the threshold for a given bubble to appear, making the conditions for its occurrence more strict.
**Decreasing** the standard deviation multipliers effectively decreases the threshold for a given bubble to appear, making the conditions for its occurrence more strict.
Keep in mind that this should always be the case:
*Smaller Size Market Orders < Medium Size Market Orders < Large Size Market Orders*
COLOR CANDLES
The Color Candles function is a useful and interesting feature that will enhance your analysis with additional context. If enabled, the indicator will color the chart's candles based on different data. Currently, there are three options to choose from, with more to be added in future updates.
Color Candles: OI DELTA
This option will color the candles to reflect Open Interest Delta. If there is a net increase in open positions (positive Open Interest Delta), the candle will be colored green. If there is a net decrease in open positions (negative Open Interest Delta), the candle will be colored red. It is important to note that this option only functions on pairs for which Tradingview provides OI data
Color Candles: VOLUME
This option utilizes volume data to help you identify the trend and momentum, coloring the candles accordingly - upward impulses are colored green and downward impulses are colored red. This makes it easier to recognize trend reversals and adjust your directional bias accordingly.
Color Candles: STOCH
This option uses the Stochastic Oscillator and SMA to color the candles, helping you identify momentum as upward green moves transition to downward red moves and vice versa.
LEVERAGE RATIO
Leverage ratio is another experimental concept I have added to this script. If turned on, it provides a broad insight into whether the market is relatively over-leveraged or if the leverage is relatively low. The aim is to use it as a confluence in anticipating incoming volatility and possibly use it to understand other aspects of market activity. It is still in its early stages of development and needless to say, it only works on pairs where Open Interest data is provided by Tradingview.
Crosses above price = Leverage is relatively high
Crosses below price = Leverage is relatively low
MARKET INFO SCREENER, LEVEL LEGEND, HIDE FILLED LINES
The last three inputs of Basic Settings section:
”The Market Info Screener” feature will display a small panel on the right side of your chart that provides useful data about the market, including Open Interest, Volume, the aggressive side of traders, and the Leverage Ratio. More data coming in future updates.
"Level Legend" option will display a small legend on the right side of the chart, helping you or others viewing the chart to understand what the objects on the chart mean.
"Hide Filled Lines" option will hide liquidation levels that have already been filled, only displaying the active ones in order to reduce clutter on your chart.
APPEARANCE
The “Appearance” settings offer a variety of modifications for colors, styles, and visibility.
The "Line Style" input allows you to choose the style and width of the liquidation level lines. You can also select which levels to display, as well as the color of the liquidation level lines and bubbles. The "Max Number of Lines" input allows you to specify the number of level lines you want on a chart. If you feel that there is too much clutter, you can decrease this number, and old lines will be removed. Please note that Tradingview has a built-in limit of 500 lines on a given chart, so this value cannot be set above 500. The "Market Buy/Sell Bubble Style" input can be used to modify the color and style of the market order bubbles. Enabling the "Show Settings Screener" option will display a screener with a list of all your settings on the right side of the chart, making it easier to share your preferred settings with others."
STANDARD DEVIATION MULTIPLIERS
This is where you can set the standard deviation thresholds for Liquidation Levels and Market Order Bubbles. These values can be customized to your preference, as the default values may not be suitable for your needs or you may want to experiment with different values to see more or fewer liquidation levels or market order bubbles on your chart. Personally, I sometimes use this feature to increase the Large Size Market Orders or Large Size Liquidation Levels multipliers so that large-sized bubbles are only assigned to extremely large positions or volumes.
If you want to only analyze larger positions or volumes, you can increase the "Smaller Size" multipliers, which act as a minimum threshold.
If you also want to include even smaller positions or volumes in your analysis, you can decrease the values of the "Smaller Size" multipliers, which act as a minimum threshold
Please note that the "Reduce Sensitivity" option in Basic Settings affects the standard deviation multipliers of the liquidation levels. Changing the "Reduce Sensitivity" value will equally multiply all of them (the ratio between Smaller, Medium, and Large multiplier values will remain the same)
STANDARD DEVIATION LENGTH
"Standard Deviation Length" defines the length (number of bars) used in all calculations that utilize the standard deviation function in this script. Decreasing it will generate Liquidation Levels and Liquidation Bubbles based more on recent data. Increasing it will generate Liquidation Levels and Liquidation Bubbles based on more long-term data.
CVD LENGTH
"CVD Length" refers to the length used in calculating cumulative volumes. Decreasing it will generate Liquidation Levels, Market Order Bubbles, and apply Directional bias based more on recent data. Increasing it will generate those based on more long-term data."
LEVEL CALCULATION MODES
“Level Calculation Modes” enable you to switch between three modes of calculating the distance between the base and actual liquidation levels.
COPYRIGHT
"Copyright" option will add your username to the copyright section at the bottom of the chart, giving you credit for your analysis if you post it somewhere.
Liquidation Levels v2 [LG]The main premise of this indicator is to identify when large cryptocurrency futures positions are opened, and then plot the liquidation levels of those positions. Market makers know this data and tend to push price towards these levels, as there is guaranteed liquidity at or approaching those levels.
Remember, we want to buy when others are forced to sell, not when they want to sell, and vice versa. Whales want to position, but need to do so in areas of larger liquidity, as they want to minimize slippage and detection as much as possible.
This indicator is very useful during times of chop, when the market is taking liquidity anywhere it exists as whales are forcing retail players out of their positions.
This indicator will also plot where positions with a total value in excess of the user-defined threshold are opened or closed, so you are able to better gauge how market participants are reacting to price levels.
Commonly used leverage levels are 100x, 50x, and 25x, but can be adjusted by the user depending on what they are noticing is attracting price levels.
This indicator is recommended for use on the 1 minute chart of the Binance BTCUSD perpetual contract pair. This will allow for as much precision as possible for the majority of users. Note: The only supported coin at this point is BTC - other coins to follow soon.
SUMMARY
1) View liquidation levels of large positions opened
2) View exact moments where large positions are opened or closed
3) Gauge available liquidity to upside or downside to better assist in determining longer term reversal points
COMING SOON
1) Additional coins
2) VPVR inspired vertical histogram or other visualization tool summarizing total available liquidity at specific price level
3) Total delta of available long and short liquidity
4) Push notifications when price takes liquidity
5) Requests as outlined in the comments
This indicator was inspired by the Hyblock Capital liquidation levels and offers an improvement upon the popular existing Liquidation Levels indicator by mlapplications.

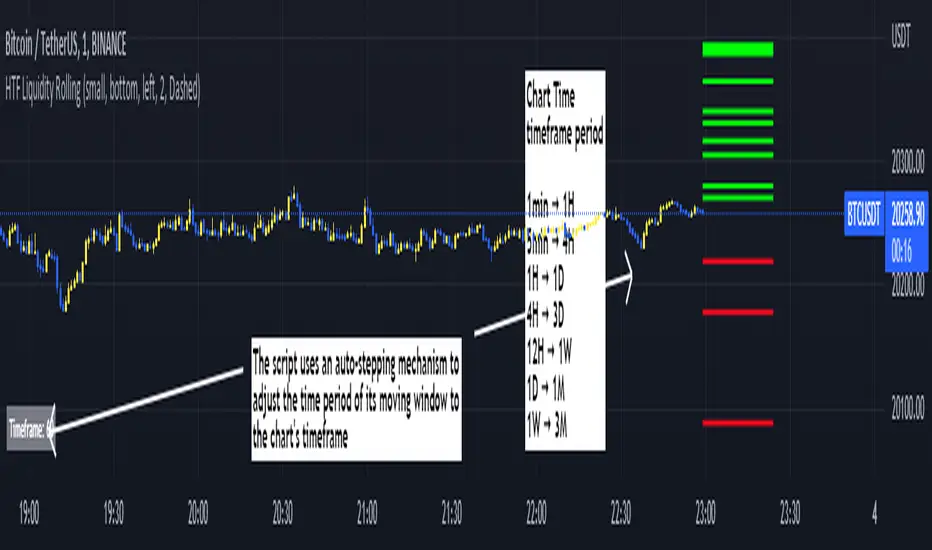
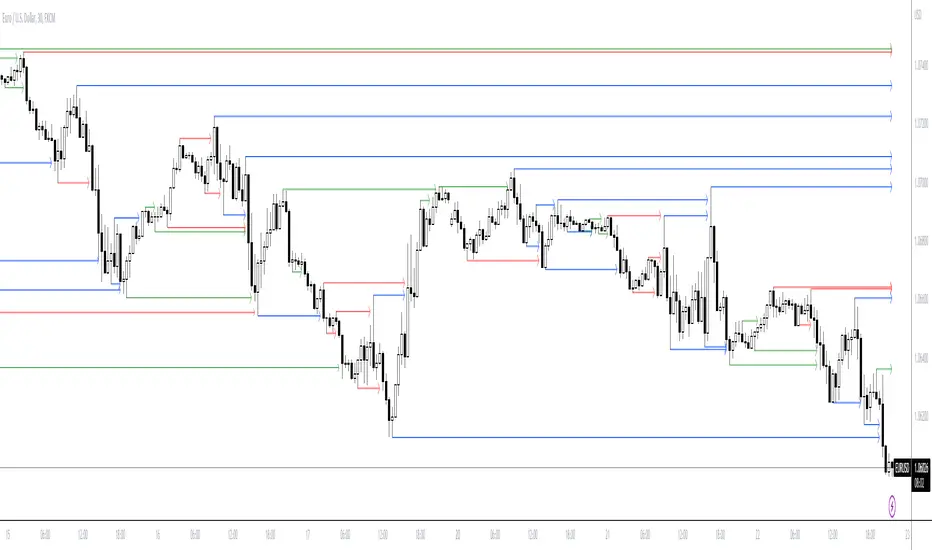
Rolling HTF Liquidity Levels [CHE]█ OVERVIEW
This indicator displays a Rolling HTF Liquidity Levels . Contrary to HTF Liquidity Levels indicators which use a fix time segment, Rolling HTF Liquidity Levels calculates using a moving window defined by a time period (not a simple number of bars), so it shows better results.
This indicator is inspired by
The indicator introduces a new representation of the previous rolling time frame highs & lows (DWM HL) with a focus on untapped levels.
█ CONCEPTS
Untapped Levels
It is popularly known that the liquidity is located behind swing points or beyond higher time frames highs/lows.
Rolling HTF Liquidity Levels uses a moving window, it does not exhibit the static of the HTF Liquidity Levels plots.
█ HOW TO USE IT
Load the indicator on an active chart (see the Help Center if you don't know how).
Time period
By default, the script uses an auto-stepping mechanism to adjust the time period of its moving window to the chart's timeframe. The following table shows chart timeframes and the corresponding time period used by the script. When the chart's timeframe is less than or equal to the timeframe in the first column, the second column's time period is used to calculate the Rolling HTF Liquidity Levels:
Chart Time
timeframe period
1min 🠆 1H
5min 🠆 4H
1H 🠆 1D
4H 🠆 3D
12H 🠆 1W
1D 🠆 1M
1W 🠆 3M
By default, the time period currently used is displayed in the lower-right corner of the chart. The script's inputs allow you to hide the display or change its size and location.
This indicator should make trading easier and improve analysis. Nothing is worse than indicators that give confusingly different signals.
I hope you enjoy my new ideas
best regards
Chervolino
TriexDev - Liquidation Rekt LevelsTriexDev - Liquidation Rekt Levels TradingView Indicator
A basic indicator which lets you see where positions will be liquidated. Each line is based on default leverage levels typically used for trading. (3x,5x,10x,25x,50x)
Have a subtle 'label prompt' on the 3x - because I had noticed some people didn't understand what labels were in other indicators.
In the settings:
- There is an offset to adjust the levels horizontally, this is to help make it easier to track if the chart has hit liquidation positions.
- You can change colours/opacity of the lines.
- You can hide the 'Labels', and/or 'label prompt'
- In the 'Style' tab you can hide individual levels.
Inspired/initially based off 'Mex Rekt Level'
I often have this added to my charts, and toggle visibility when I want to check the liq levels.
GitHub Repo for tidier/more detailed documentation as it is updated.

ICT LIQUIDITY indicator [Focused Trader]This indicator allows you to draw liquidity according to ICT. Specifically, you can choose to draw liquidity for specific sessions (Asia,New York,London).
Filtering by session
You can chooose to display only liquidities created in specific session. For example, the favourite liquidity is that of Asia. And then, in London market usually grabs it. So you set to display only liquidites of asia.
Session background
You can also display background over specific session, this is very usefull to see how market behaves - liquidity created in Asia is very often taken in London session. You can use any colour you'd like.
Colouring and style of lines
There is an option to choose colour for liquidity lines from different sessions and also choose specific colour for highs and lows. You can also set different styles (dash, dot, arrow, ...) of liquidty lines.
ICT FVG indicator [Focused Trader]This is simple fair value gap indicator. It draws FVG (fair value gaps) as boxes. If FVG is partially filled, it is also displayed and smaller size FVG is drawn. If FVG is filled totally, it is deleted from chart. There is limitation of 500 drawing objects for indicators on Tradingview, so keep in mind that this indicator will display only last 500 FVGs.
For simplicity, there is only one setting, which is coloring of FVGs. It is perhaps a good idea to lower your opacity (to about 10%) and choose color of FVG according to your preferences and current theme (dark or white).

Trendmaster - LiquidationsTrendmaster™ - Liquidations is a Crypto Specific Indicator that shows liquidation levels depending on the leverage of positions entered within a certain period.
What are Liquidation Levels?
A liquidation level is expressed as a percentage value of the assets in a trader's margin account.
If a Crypto trader's positions go against them, their account will eventually reach the liquidation level, unless the trader injects additional funds.
Another name for liquidation level is liquidation margin.
How to use Liquidations:
High leverage positions such as 100x or 50x traders have a higher probability of being liquidated within intraday trading.
The lower a trader's leverage is, can decrease the probability of their position getting liquidated.
This means that using the Liquidations Indicator, users can see other traders’ liquidation levels based on several time periods.
The liquidation levels shown by the Indicator are 100x, 50x, 20x, 10x, 5x, 3x, and 2x in the periods Daily, Weekly, Monthly, and Yearly.
This means that within a certain period users can see the liquidation positions of other traders at all of those periods and use that information to predict price movements and reversal points.

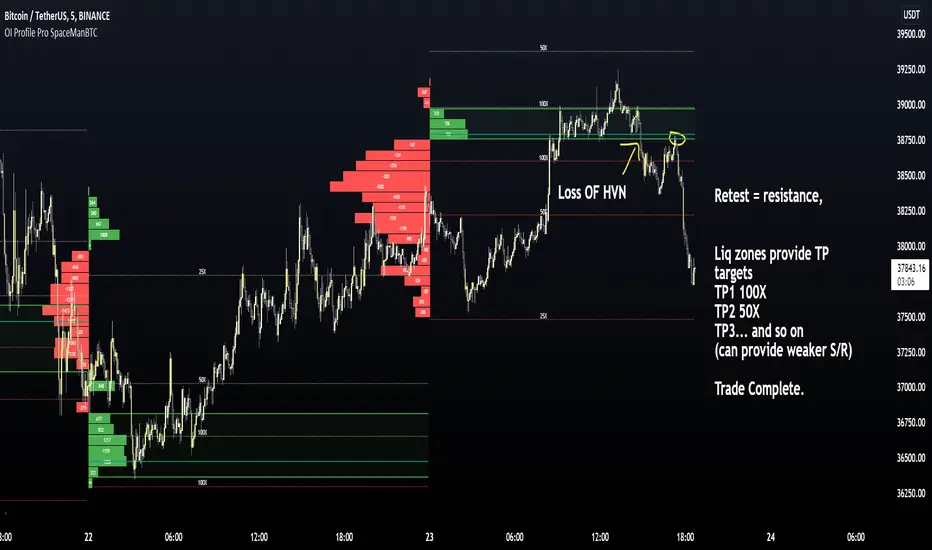
OI Profile Pro SpaceManBTCOI Profile Pro SpaceManBTC
The indicator provides a way to show the Open Interest Delta in relation to the price this occurs,
the increase and decrease will be reflected in the profile in a realtime display of the market providing trader insight as to what is occuring.
Users are granted options such as
HVN - Auto detects areas of High Open Interest
HVN/Liqs - Provides points of maximum likely liquidation areas
Historic Highlight - to highligh previous liqudation interaction points
Weighting - Determine profile weight relative to OI Delta
Spread - New calculation metric for the profile
Users can select their margin manually else the Auto settings for margin will do its job based on the chart selected, perp vs usdt.
All settings are set to auto with spaceman recommended defaults.
Liquidation points can be useful for Targets when taking a trade.
HVN/OI. Can be used as S/R dynamically as well as the OI develops throughout the session.
Historic Highlighting can be used for backtesting and displaying probability of likelyness for a target to be hit.
ToDo:
Additional display options
Improve HVN Calculation for efficiency
Pivot and liquidation lines [LM]Hello traders,
I would like to introduce you pivot and liquidation zones. Levels are rendered based on pivot points. We are looking for confluence of liquidation lines in order to have the gist where the market could go. calculation for the liquidation lines are taken from Bybit. It's good to look for line clusters. Indicator doesn't tell you where the market will go but it tells you where are the potential zones of position liquidations
There are several settings:
pivot setting - ordinary pivot lines setting
first leverage - setting for first leverage
second leverage - setting for second leverage
third leverage - setting for first leverage
fourth leverage - setting for second leverage
Hope you will enjoy it.

Bybit Calculator Liquidation levelsThis script uses the bybit liquidation calculator method to identify liquidation levels.
Given an entry price and a leverage, the calculator will give you a liquidation price. Those liquidation prices are displayed by this script.
It saves some time as we avoid asking the calculator the liquidation prices for the main leverage multipliers once.
These levels could be used to identify liquidations wicks. As we approach levels, traders that don't use stop loss will be liquidated and create a larger move through these levels. I personally set the entry price to be a large volume node and that seems to somewhat predict interesting levels to watch for (but use at your own risk)
Example:
- pair: BTC/USDT
- margin mode: isolated
- position: long
- leverage: x50
- entry price: 33640
- quantity: irrelevant for isolated
-> the calculator gives a liquidation price of 33135.4 USDT, this level is displayed below entry price with a x50 annotation

Liquidation Levels
I got sick of calculating leverage all of the time, so I made this real time calculator. It is primarily for crypto derivatives.
It tracks and displays the liquidation price for 5 customisable leverage levels and plots them either historically and/or in real time, with labels beside each including the estimated price.
These calculations include maintenance margin and can be configured for linear futures (USDT) or non-linear futures. Never again make dumb mistakes that are obvious with a bit of maths.
To jazz it up, you can customise the colours, disable various labels, set different leverage multiples, and change the offsets and number of bars to plot in the past.
Alternatively, you can change the offset to 24 on an hourly chart and change show last bars to 0. By doing this, you can see which levels most often get liquidated. It is crude, I know, and there are better tools for tracking liquidation hunts. This is not an attempt to replace or compete with them.
Enjoy and trade safely.

PT LiquidityVersion 1.0 of our Liquidity indicator helps determine areas where price might gravitate to fill liquidations. We have six levels of interest, broken down into three levels for shorts (highlighted in red) & three levels for longs (highlighted in green). Each level is labeled 25x, 50x, 100x. We added a cloud for a visual to assist in short/long liquidation zones. You want to be taking short setups at the top of the cloud when shorts get squeezed & taking long setups at the bottom of the cloud when longs get squeezed. The indicator has a proprietary formula that allows the levels to change based on volume and time frames. The levels are generated in real-time with a rolling VWMA.
Strategy:
If you are scalping, price tends to ping pong between the 50x & 100x longs (green) to 50x & 100x shorts (red). If we shift outside that zone, consider the trend to have changed. Look at a higher time frame (12h+) for trend direction. Price usually reverses when the daily takes all three liquidation levels. You want to see a strong reaction (wick) once we tap that last liquidation level.
This Oscillator was built around our buy sell indicator & it is used on all time frames for swinging & scalping. It is included as part of the library. Just message us for access!

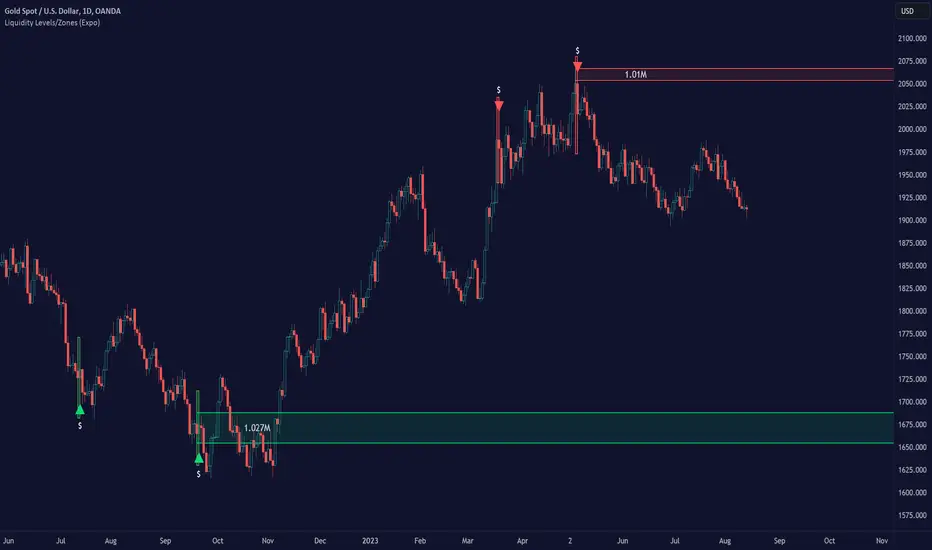
Liquidity Levels/Zones (Expo)Liquidity Levels/Zones (Expo) automatically identifies and displays key liquidity levels/zones.
Liquidity describes the extent to which an asset can be bought and sold quickly, without affecting the price. It is a measure of how many buyers and sellers are present, and whether transactions can take place easily.
Levels/Zones are displayed where there is a significant level of trading activity and when there is both high supply and demand for an asset, security, or contract. These levels can leave clues for future price behavior and act as support/resistance zones. The trading activity can confirm the existence, or a continuation, of a trend or a trend reversal.
The user can modify the settings so that short- term, medium-term, and long- term liquidity levels/zones are displayed.
The indicator can be used standalone or as a part of your current trading strategy.
Real-time
No repainting
Works on any market
HOW TO USE
1. Use the indicator to identify key liquidity levels/zones.
2. Use the indicator to identify high trading activity.
3. Use the indicator to confirm the existence, or a continuation, of a trend or a trend reversal.
INDICATOR IN ACTION
1-hour chart
I hope you find this indicator useful , and please comment or contact me if you like the script or have any questions/suggestions for future improvements. Thanks!
I will continually work on this indicator, so please share your experience and feedback as it will enable me to make even better improvements. Thanks to everyone that has already contacted me regarding my scripts. Your feedback is valuable for future developments!
ACCESS THE INDICATOR
• Contact me on TradingView or use the links below
-----------------
Disclaimer
Copyright by Zeiierman.
The information contained in my scripts/indicators/ideas does not constitute financial advice or a solicitation to buy or sell any securities of any type. I will not accept liability for any loss or damage, including without limitation any loss of profit, which may arise directly or indirectly from the use of or reliance on such information.
All investments involve risk, and the past performance of a security, industry, sector, market, financial product, trading strategy, or individual’s trading does not guarantee future results or returns. Investors are fully responsible for any investment decisions they make. Such decisions should be based solely on an evaluation of their financial circumstances, investment objectives, risk tolerance, and liquidity needs.
My scripts/indicators/ideas are only for educational purposes!
MR Liq lvlHi Guys!
- This script show you liquidations levels with leverage of 100X, 50X, 25X & 10X (shorts & longs).
- This indicator "only" works for XBT on Bitmex.
- Other indicators only show the liquidations up to 25X .
- The idea of this indicator is to help the user to determine those levels where Bitmex hunt liquidity.
Best Regards.
Mr.amin

BITMEX LIQUIDATION LEVELSThis is a BITMEX exchange liquidation levels with different leverages.
Calculations are made by Bitmex calculator.
Included leverage levels 1, 2, 3, 5, 10, 15, 20, 25, 30, 50 and 100x
By default indicator calculates levels from current price.
To input your own price unchek "Auto or manual" checkbox and input your price data.
----------------------------------------------------------------------------------------------------------------
Данный индикатор считает уровни ликвидации на бирже BITMEX с разными плечами.
Вычисления сделаны по калькулятору биржи BITMEX.
Внесенные уровни по плечам: 1, 2, 3, 5, 10, 15, 20, 25, 30, 50 и 100х
По умолчанию индикатор считает уровни от текущей цены.
Для ручного расчета снимите галочку с "Auto or manual" и внесите свои данные.
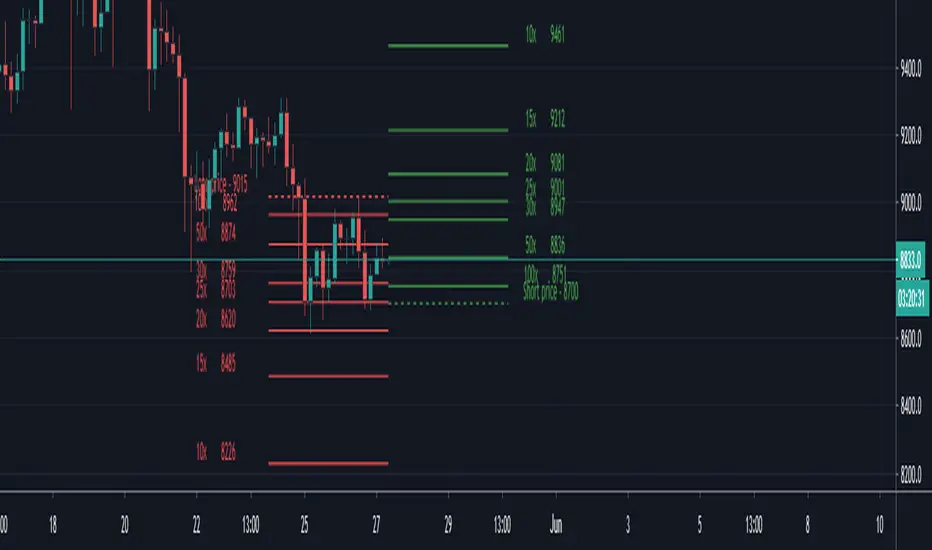
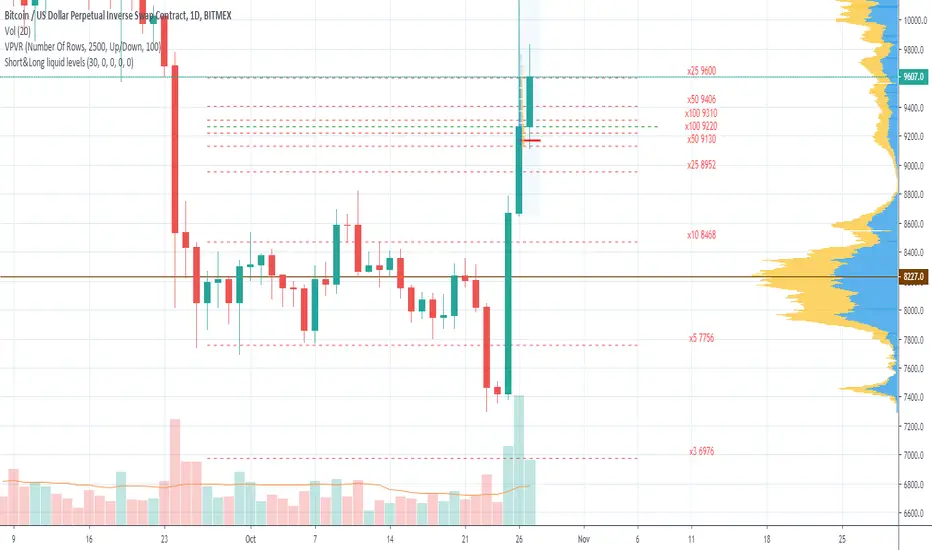
Short&Long liquid levels (XBT & ETH)Shows liquidation levels of marginal LONG and SHORT positions on BITMEX for XBTUSD and ETHUSD pairs.
Levels are calculated from the basis price, which you can change manually. The best choice is using the Volume Profile indicator in conjunction, so you can take POC for the basis price. As well, you can use significant horizontal levels or a middle line of a price channel. In order to prevent chart collapse, last candle open price is used by default.
Indicator presents x100, x50, x25, x10, x5, x3, x2 levels for XBTUSD and x50, x35, x25, x20, x10, x5, x3 for ETHUSD. Each level is marked with labels by default, and you can turn the labels off in the styles menu.
The indicator is only visible on XBTUSD, BTCUSD, BTCUSDT, ETHUSD, ETHUSDT pairs.
You can turn on/off Short or Long liquidation levels.
The basis price is the same for Longs and shorts by default, specify separate price for short if you need.
If you have any advice to improve the indicator or if you find any mistake, please leave your feedback.
Bitmex Liquidations (More levels)Author of the script is Jaqobs
Moving averages based on VWMA and Bitmex's leverage liquidation multipliers.
Added more levels so it is easier to visually see where scaled limit orders should be placed in order to catch extreme wicks.