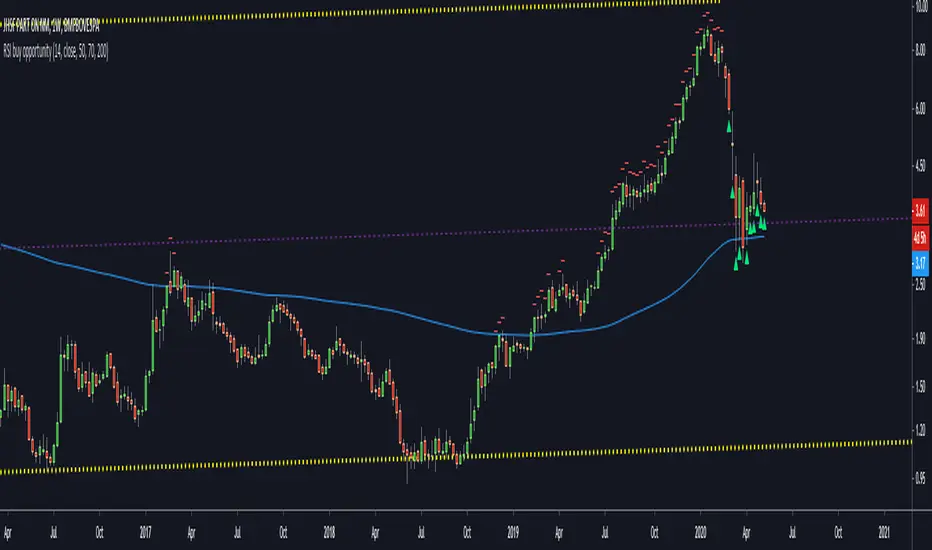
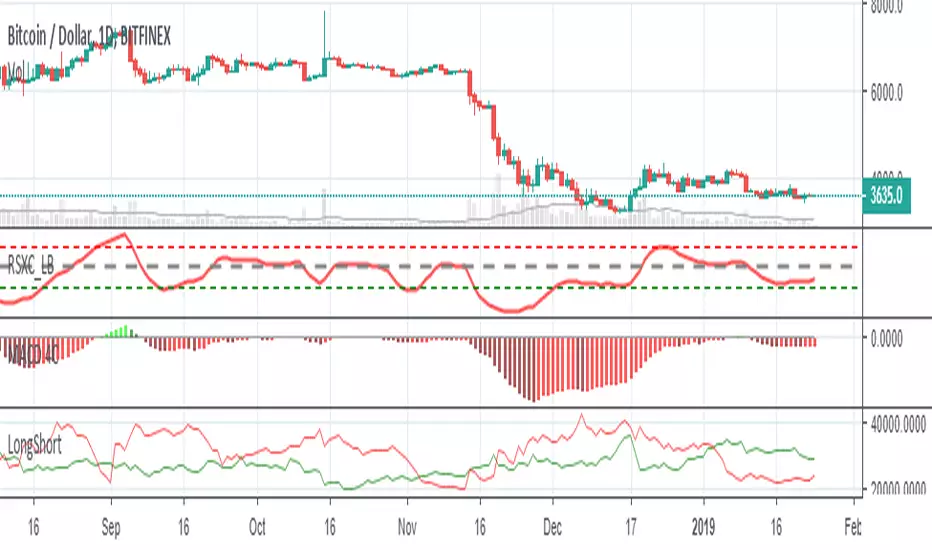
RSI buy opportunityRSI buy opportunity is an indicator to look for the best entries on weekly charts.
It depends on each stock and the values should change to optimize the entry.
Buy when green triangle shows up.
Never buy when red signal appears.
PANJANG
Hash Ribbons Backtest - Bitcoin Beats YT
Hello Hello Hello and welcome back to Bitcoin Beats!
This is a script written by capriole_charles
Go check out the original!
I have added leverage and stoploss % but also made it a strategy so we can look back at past trades to see patterns and profit.
Personally I feel this is not enough data to trade off as BTC is such a young asset. However I have seen other models similar to this for other assets that hold strong.
Trade safe!
Good bye from bitcoin beats!
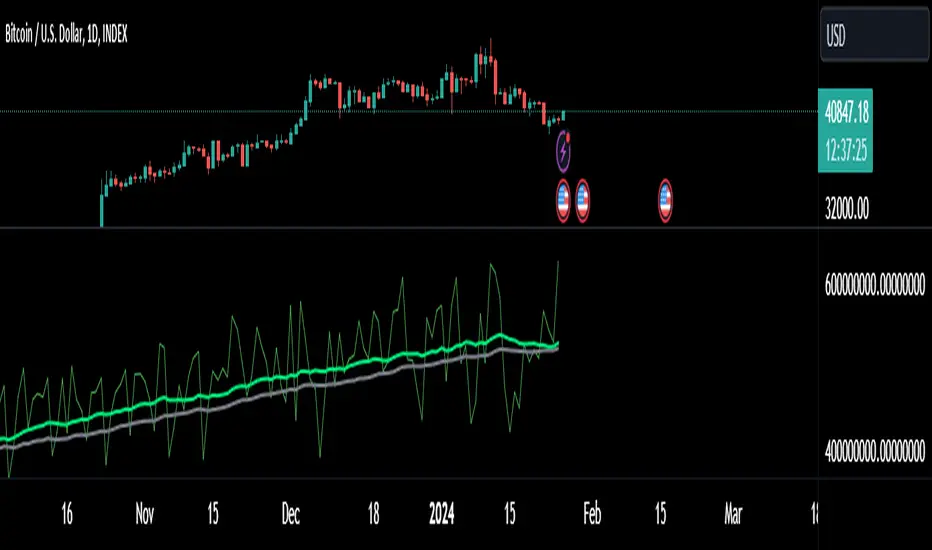
Not Meant For The 1H! My Bad! higher timeframes are better!
The "Spring" is the confirmed Miner capitulation period:
The 1st "gray" circle is the start of Capitulation (1 month Hash Rate crosses UNDER 2 month Hash Rate)
Last "green" circle is the end of Capitulation (1 month Hash Rate crosses OVER 2 month Hash Rate)
The "greener" the spring gets (up until blue) represents Hash Rate recovery (it is increasing)
The "blue" circle is the first instance of positive momentum following recovery of Hash Rate (1m HR > 2m HR). This is historically a rewarding place to buy with limited downside.
Donchain BreakoutIt is a long only strategy.
1. Buy when price breaks out of the upper band.
2. Exit has two options. Option 1 allows you to exit using lower band. Option 2 allows you to exit using basis line.
3. Slippage and commissions are not considered in the return calculation.

Bollinger Band BreakoutIt is a long only strategy.
1. Buy when price breaks out of the upper band.
2. Exit has two options. Option 1 allows you to exit using lower band. Option 2 allows you to exit using moving average.
3. Option 1 preferred over option 2 if the instrument is highly volatile.
4. Slippage and commissions are not considered in the return calculation.

Rate Of Change Earnings Move - ROCEMRate Of Change Earnings Move
What is it and how does it work?
The Rate of Change Earnings Move indicator or ROCEM is an indicator designed for giving the user an idea of how much a stock has moved up or down in past earnings reports. This is ideal for options traders who can use ROCEM to calculate whether or not their long straddles are actually probable of happening.
How it works
The indicator measures the absolute value rate of change and then calculates the average rate of change for the day of the earnings report for the past 8 earnings reports (2 years). It then takes the current stock price and finds the upper and lower price based on the average rate of change for past earnings.
I have also included a moving average (purple line), use this to see if the current rate of change is higher than usual.
Additionally, earnings reports are marked with a red x on the indicator.
How to trade ROCEM
This is primarily made for options trading so I will be explaining how it can be used for that. It is not suited for traditional stock trading as it does not determine a market direction.
Select a stock with an upcoming earnings
Enter your per leg commissions in the indicator if you want it to calculate new upper and lower prices (makes it easier to determine if the options trade will pass the breakeven when commissions are factored in)
Compare your long straddle breakevens with the upper and lower prices of the indicator. If the upper breakeven is smaller than the upper price in ROCEM and the lower breakeven is larger than the lower price in ROCEM, then a long straddle position could be considered a reasonable trade based on past earnings performance.

BUY and SELL - Backtest single EMA cross By che_traderHi, I hope you're well!
At the request of my friend @jansrbtc I'm going to publish a simple emas crossing strategy.
We will do long or short at the cross of the two ema.
Good strategy for when an asset is in trend.
Warm: In choppy periods this indicator can be very affected by large drawdowns.
Enjoy!

CoT Absolute Percent-Buschi
English
I'm often asked to provide an alternate view on the CoT data. For example, the indicator "Commercial index" is an oscillator from 0 to 100, but oftentimes it can be helpful to look at the absolute position. So, here the absolute position of certain parts of the CoT report are given, alongside with the percentage of a given time frame to put them in place.
The inputs are:
CoT Part Number ('1' for Commercials Short, '2' for Commercials Long, '3' for Commercials Netto, '4' for Large Speculators Short, '5' for Large Speculators Long, '6' for Large Speculators Netto, '7' for Small Speculators Short, '8' for Small Speculators Long, '9' for Small Speculators Netto, '10' for Open Interest)
Review Period (in years, just used for the percentage)
Percent Line 1, 2, 3, 4 (just to provide some lines which can be altered as required)
DISCLAIMER: I'm aware of Pine Script's ability to provide options as inputs (which would be much nicer for the CoT Parts). Alas, it is only available since version 3, and I noticed that for some reason the CoT data is not correctly adjusted to last Tuesday when using higher versions than 1. If someone knows a solution, please contact me.
Deutsch
Ich werde oft gefragt, eine alternative Sicht auf die CoT-Daten zu geben. Der Indikator "Commercial Index" zum Beispiel schwankt als Oszillator zwischen 0 und 100, aber oft kann der Blick auf die absolute Positionierung hilfreich sein. Also werden hier die Absolutpositionen verschiedene CoT-Bestandteile wiedergegeben, zusammen mit einer prozentualen Einteilung über eine vorgegebene Zeitspanne, um sie einordnen zu können.
The Eingaben lauten:
CoT Part Number ('1' Commercials Short, '2' Commercials Long, '3' Commercials Netto, '4' Large Speculators Short, '5' Large Speculators Long, '6' Large Speculators Netto, '7' Snall Speculators Short, '8' Small Speculators Long, '9' Small Speculators Netto, '10' Open Interest)
Review Period (Zeitintervall in Jahren, um die Prozentlinien zeichnen zu können)
Percent Line 1, 2, 3, 4 (um die Prozentlinien zur Verfügung zu stellen, die dann beliebig geändert werden können)
DISCLAIMER: Ich weiß über die Möglichkeit Bescheid, ab Pine Script Version 3 Optionen als Eingaben benutzen zu können (was deutlich angenehmer für die CoT-Bestandteile wäre). Leider habe ich gemerkt, dass die CoT-Daten bei Versionen über 1 leider nicht korrekt auf letzten Dienstag adjustiert werden, keine Ahnung warum. Falls jemand eine Lösung kennt, bitte kontaktieren.

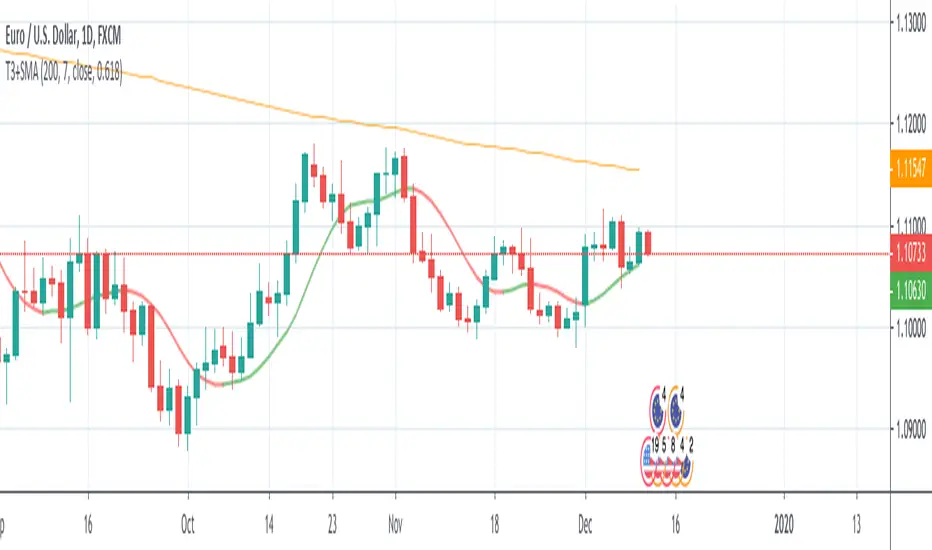
T3+SMA This source code is subject to the terms of the Mozilla Public License 2.0 at mozilla.org
© 03.freeman
This strategy is based only on T3 moving average, but uses sma 200 as filter for enter long or short.
The default settings considers a daily timeframe.
The strategy is very simple: long if T3 increase, short if T3 decrease.
Note that if you set volume factor to 0 you will have an exponential moving average, while if you set to 1 you'll get a DEMA.
Leledc Exhaustion Bar V4 PLUSLeledc Exhaustion Bar indicator created by glaz converted to Pine 4, plotshape was added.

Reliability[UO]This is an SMA based indicator. It gives a sense of long term behavior of the asset to make a reliable trade setup
How reliable is your asset to trade without gambling? Is there a reliable trend?
Is this price dip an opportunity to buy?
Is this price spike an opportunity to sell? Or would you avoid buying now and rather wait a bit for prices to fall down to a more reasonable level?
You can recognize all of those points on this indicator. The best to do is to look at the prices and patterns on the indicator to learn about those points.

Hash RibbonsBuying during Miner Capitulation yields wonderful returns.
The best buy signals occur on Hash Rate "recovery", and when price momentum is also positive.
Historically, this strategy has yielded average returns to cycle peak of >5000%, with max Drawdown of -15%.
Follow me to learn more about this indicator.


Multiple BTC RSIs in a single indicatorPlots in a single indicator the Bitcoin RSI of multiple exchanges. The selected exchanges are Bitmex, Binance and Coinbase. The reason is that these are the ones with the highest 24h volume (coinmarketcap) and have a ticker available in Trading View.
One drawback with this indicator is that it doesn't automatically adjusts its resolution when the Bitcoin chart is rendered across timeframes. You have to manually update the time resolution in the settings window for the indicator.

ETHUSDSHORTS+ETHUSDLONGS - Bitfinex ETH Shorts & Longs & TotalBitfinex ETH Shorts & Longs & Total
There is "Shorts" & "Longs" & "Shorts + Longs" & "Shorts - Longs"


Bitfinex Sentiment Index [Long-Short]BSI provides two attractive graphs that breakdown the long (green area) and short (red area) positions ratio for the all Bitfinex margin cryptocurrency pairs only .
It is a quantitative measure of the bullishness or bearishness that can be used as a trading rule or in a trading system entries or exits. Included slow stochastic oscillator.

Speed_long_short-v2[WOZDUX]Indicator longs and shorts version 2.
------
Индикатор лонги и шорты версия 2.

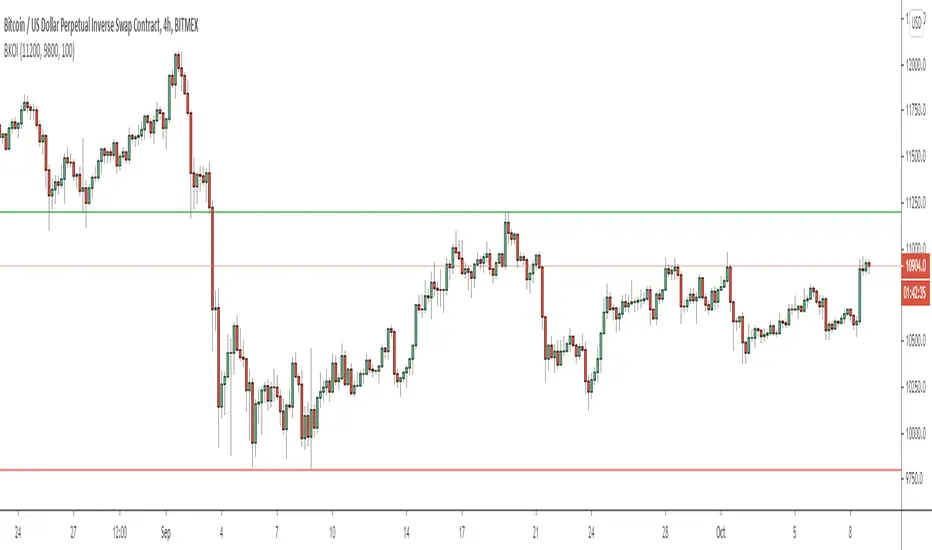
Breakout IndicatorThis script allows you to set breakout alerts.
An alert will be triggered only when price breaks and closes beyond the specified prices. You will get an alert on the first candle that closes beyond the levels you set.

Total Power IndicatorHello traders!
This indicator was originally developed by Daniel Fernandez (Currency Trader magazine, 2011).
It is based on the two well-known indicators by Dr. Alexander Elder - Bulls Power and Bears Power.
Signals
1) Long when Bull and Total lines indicate 100 (it happens rarely)
2) Short when Bear and Total lines indicate 100 (it happens rarely)
3) Bull and Bear lines crossovers
4) Long when Bull line crosses Total line from below
5) Short when Bear line crosses Total line from below
6) Long/Short when Bull/Bear lines cross adjustable level.
Like and follow for more open source indicators!
Happy Trading!
