Cerber Strategy ETH/BTC Cerber Strategy: High-Precision Crypto Trend Follower
The Cerber Strategy is a low-frequency, high-conviction trend following system designed to capture massive quarterly crypto moves while
filtering out 90% of consolidation noise. It combines a momentum-based "Sniper Entry" (entering only on verified breakouts) with a
"Trend Confirmation" filter (Weekly DEMA) to ensure capital is only deployed during macro bull runs.
Usage:
* Timeframe: Daily (1D) mandatory.
* Assets: Optimized for BTC and ETH, works on high-volatility alts.
* Style: Position Trading (holding for weeks/months).
* Risk: Extremely high efficiency (high Profit Factor), very low drawdown compared to Buy & Hold. Perfect for a "Set and Forget"
portfolio allocation.
Longterm

Pi Cycle BTC Top + Pre-Alert BandsPi Cycle BTC Top + Pre-Alert Bands is an advanced implementation of the classic Pi Cycle Top model, designed for Bitcoin cycle analysis on higher timeframes (especially 1D BTCUSD/BTCUSD·INDEX).
The original Pi Cycle Top uses two moving averages:
• 111-day SMA (short MA)
• 350-day SMA ×2 (long MA)
A Pi Top is signaled when the 111 SMA crosses above the 350×2 SMA. Historically, this has occurred near major BTC cycle highs.
This script extends that idea with a 3-step early-warning sequence:
• Pi Green – early compression: short/long MA ratio crosses upward into the green band (convergence from below is required).
• Pi Yellow – mid-cycle warning: only fires if a valid Green has already occurred in the same cycle.
• Pi Cycle Top – final top: the classic Pi Cycle cross, limited to one top signal per cycle. After a top, no new Yellow or Top signals can appear until a new Green event starts the next cycle.
Background shading shows the active phase (Green / Yellow / late-cycle zone), so you can see at a glance where BTC is within its Pi-based macro structure.
All logic is non-repainting: request.security() uses lookahead_off and no future data is accessed.
Typical use
This indicator is intended as a macro-cycle timing and risk-awareness tool, not a stand-alone entry system. Many traders use it to:
• Watch for Pi Green as the start of a potential late-cycle advance.
• Treat Pi Yellow as a rising-risk environment and tighten risk management.
• Use the Pi Cycle Top as a historical high-risk zone where large profit-taking or hedging may be considered.
Always combine this with your own analysis (trend, volume, on-chain, macro) before making decisions.
How to set alerts
Add the indicator to your chart (1D BTCUSD or BTCUSD·INDEX recommended).
Click Alerts → Condition → Pi Cycle BTC Top + Pre-Alert Bands.
Choose one of:
• Pi Cycle – Green Pre-Alert (early convergence)
• Pi Cycle – Yellow Pre-Alert (after Green only)
• Pi Cycle – TOP (Single per Cycle, after Green)
Use “Once per bar close” for higher-timeframe reliability.
Disclaimer
This tool is for educational and analytical purposes only. The Pi Cycle concept is based on historical behavior and does not guarantee future results. This is not financial advice; always do your own research and manage risk appropriately.

SPY200SMA (+4%/-3%) TQQQ/QQQ STRATEGYSummary of the Improved Strategy: When the price of AMEX:SPY is +4% above the 200SMA BUY NASDAQ:TQQQ and when the price of SPY drops to -3% under the SPY 200SMA SELL everything and slowly DCA into NASDAQ:QQQ over the next 6-12 months or until price returns to +4% above the SPY 200SMA at which point you will go back into 100% TQQQ.
Note: (if the price of QQQ goes 30% above the 200SMA of QQQ deleverage to QQQ or Sell to protect yourself from dot com level event)
More info and stats -https://www.reddit.com/r/LETFs/comments/1nhye66/spy_200sma_43_tqqqqqq_long_term_investment/

Profitsmaxx DayProfitProfitsMaxx DayProfit is the ultimate all-in-one indicator designed for traders who want consistent, high-quality trade signals across any coin and any timeframe. Built for day traders, it delivers precise entry and exit alerts that adapt seamlessly to market conditions — whether you’re trading crypto, forex, or indices.
Powered by advanced algorithms that combine market structure, momentum, and trend analysis, ProfitsMaxx Day Profit helps traders capture profitable moves while minimizing false signals. It’s trusted by both beginners and experienced traders as a reliable tool for daily trading success.
With its clear visuals, intuitive interface, and multi-market compatibility, Day Profit stands as the all-time best ProfitsMaxx indicator — giving you the edge to trade smarter, react faster, and grow your profits with confidence.
👉 Available now at www.profitsmaxx.com

Long-Term Trend & Valuation Model [Backquant]Long-Term Trend & Valuation Model
Invite-only. A universal long-term valuation strategy and trend model built to work across markets, with an emphasis on crypto where cycles and volatility are large. Intended primarily for the 1D timeframe. Inputs should be adjusted per asset to reflect its structure and volatility.
If you would like to checkout the simplified and open source valuation, check out:
What this is
A two-layer framework that answers two different questions.
• The Valuation Engine asks “how extended is price relative to its own long-term regime” and outputs a centered oscillator that moves positive in supportive conditions and negative in deteriorating conditions.
• The Trend Model asks “is the market actually trending in a sustained direction” and converts several independent subsystems into a single composite score.
The combination lets you separate “where we are in the cycle” from “what to do about it” so allocation and timing can be handled with fewer conflicts.
Design philosophy
Crypto and many risk assets move in multi-month expansions and contractions. Short tools flip often and can be misleading near regime boundaries. This model favors slower, high-confidence information, then summarizes it in simple visuals and alerts. It is not trying to catch every swing. It is built to help you participate in the meat of long uptrends, de-risk during deteriorations, and identify stretched conditions that deserve caution or patience.
Valuation Engine, high level
The Valuation Engine blends several slow signals into one measure. Exact transforms, windows, and weights are private, but the categories below describe the intent. Each input is standardized so unlike units can be combined without one dominating.
Momentum quality — favors persistent, orderly advances over erratic spikes. Helps distinguish trend continuation from noise.
Mean-reversion pressure — detects when price is far from a long anchor or when oscillators are pulling back toward equilibrium.
Risk-adjusted return — long-window reward to variability. Encourages time in market when advances are efficient rather than merely fast.
Volume imbalance — summarizes whether activity is expanding with advances or with declines, using a slow envelope to avoid day-to-day churn.
Trend distance — expresses how stretched price is from a structural baseline rather than from a short moving average.
Price normalization — a long z-score of price to keep extremes comparable across cycles and symbols.
How the Valuation Engine is shaped
Standardization — components are put on comparable scales over long windows.
Composite blend — standardized parts are combined into one reading with protective weighting. No single family can override the rest on its own.
Smoothing — optional moving average smoothing to reduce whipsaw around zero or around the bands.
Bounded scaling — the composite is compressed into a stable, interpretable range so the mid zone and extremes are visually consistent. This reduces the effect of outliers without hiding genuine stress.
Volatility-aware re-expansion — after compression, the series is allowed to swing wider in high-volatility regimes so “overbought” and “oversold” remain meaningful when conditions change.
Thresholds — fixed OB/OS levels or dynamic bands that float with recent dispersion. Dynamic bands use k times a rolling standard deviation. Fixed bands are simple and comparable across charts.
How to read the Valuation Oscillator
Above zero suggests a supportive backdrop. Rising and positive often aligns with uptrends that are gaining participation.
Below zero suggests deterioration or risk aversion. Falling and negative often aligns with distribution or with trend exhaustion.
Touches of the upper band show stretch on the optimistic side. Repeated tags without breakdown often occur late in cycles, especially in crypto.
Touches of the lower band show stretch on the pessimistic side. They are common in washouts and early bases.
Visual elements
Valuation Oscillator — colored by sign for instant context.
OB/OS guides — fixed or dynamic bands.
Background and bar colors — optional, tied to the sign of valuation for quick scans.
Summary table — optional, shows the standardized contribution of the major categories and the final composite score with a simple status icon.
Trend Model, composite scoring
The trend side aggregates several independent subsystems. Each subsystem issues a vote: long, short, or neutral. Votes are averaged into a composite score. The exact logic of each subsystem is intentionally abstracted. The families below describe roles, not formulas.
Long-horizon price state — checks where price sits relative to multiple structural baselines and whether those baselines are aligned.
Macro regime checks — favors sustained risk-on behavior and penalizes persistent deterioration in breadth or volatility structure.
Ultimate confirmation — a conservative filter that only votes when directional evidence is persistent.
Minimalist sanity checks — keep the model responsive to obvious extremes and prevent “stuck neutral” states.
Higher timeframe or overlay inputs — optional votes that consider slower contexts or relative strength to stabilize borderline periods.
You define two cutoffs for the composite: above the long threshold the state is Long , below the short threshold the state is Short , in between is Cash/Neutral . The script paints a signal line on price for an at-a-glance view and provides alerts when the composite crosses your thresholds.
How it can be used
Cycle framing in crypto — use deep negative valuation as accumulation context, then look for the composite trend to move through your long threshold. Late in cycles, extended positive valuation with weakening composite votes is a caution cue for de-risking or tighter management.
Regime-based allocation — increase risk or loosen take-profits when the composite is firmly Long and valuation is rising. Decrease risk or rotate to stable holdings when the composite is Short and valuation is falling.
Signal gating — run shorter-term entry systems only in the direction of the composite. This reduces counter-trend trades and improves holding discipline during strong uptrends.
Sizing overlay — scale position sizes by the magnitude of the valuation reading. Smaller sizes near the upper band during aging advances, larger sizes near zero after strong resets.
DCA context — for long-only accumulation, schedule heavier adds when valuation is negative and stabilizing, then lighten or pause adds when valuation is very positive and flattening.
Cross-asset rotation — compare symbols on 1D with the same fixed bands. Favor assets with positive valuation that are also in a Long composite state.
Interpreting common patterns
Early build-out — valuation rises from below zero, but the composite is still neutral. This is often the base-building phase. Patience and staged entries can make sense.
Healthy advance — valuation positive and trending up, composite firmly Long. Pullbacks that keep valuation above zero are usually opportunities rather than trend breaks.
Late-cycle stretch — valuation pinned near the upper band while the composite starts to weaken toward neutral. Consider trimming, tightening risk, or shifting to a “let the market prove it” stance.
Distribution and unwind — valuation negative and falling, composite Short. Rallies are treated as counter-trend until both turn.
Settings that matter
Timeframe
This model is intended for 1D as the primary view. It can be inspected on higher or lower frames, but the design choices assume daily bars for crypto and other risk assets.
Asset-specific tuning
Inputs should be adjusted per asset. Coins with high variability benefit from longer lookbacks and slightly wider dynamic bands. Lower-volatility instruments can use shorter windows and tighter bands.
Valuation side
Lookback lengths — longer values make the oscillator steadier and more cycle-aware. Shorter values increase sensitivity but create more mid-zone noise.
Smoothing — enable to reduce flicker around zero and around the bands. Disable if you want faster warnings of regime change.
Dynamic vs fixed thresholds — dynamic bands float with recent dispersion and keep OB/OS comparable across regimes. Fixed bands are simple and make inter-asset comparison easy.
Scaling and re-expansion — keep this enabled if you want extremes to remain interpretable when volatility rises.
Trend side
Composite thresholds — widen the neutral zone if you want fewer flips. Tighten thresholds if you want earlier signals at the cost of more transitions.
Visibility — use the price-pane signal line and bar coloring to keep the regime in view while you focus on structure.
Alerts
Valuation OB/OS enter and exit — the oscillator entering or leaving stretched zones.
Zero-line crosses — valuation turning positive or negative.
Trend flips — composite crossing your long or short threshold.
Strengths
Separates “valuation context” from “trend state,” which improves decisions about when to add, reduce, or stand aside.
Composite voting reduces reliance on any single indicator family and improves robustness across regimes.
Volatility-aware scaling keeps signals interpretable during quiet and wild markets.
Clear, configurable visuals and alerts that support long-horizon discipline rather than frequent toggling.
Final thoughts
This is a universal long-term valuation strategy and trend model that aims to keep you aligned with the dominant regime while giving transparent context for stretch and risk. For crypto on 1D, it helps map accumulation, expansion, distribution, and unwind phases with a single, consistent language. Tune lookbacks, smoothing, and thresholds to the asset you trade, let the valuation side tell you where you are in the cycle, and let the composite trend side tell you what stance to hold until the market meaningfully changes.

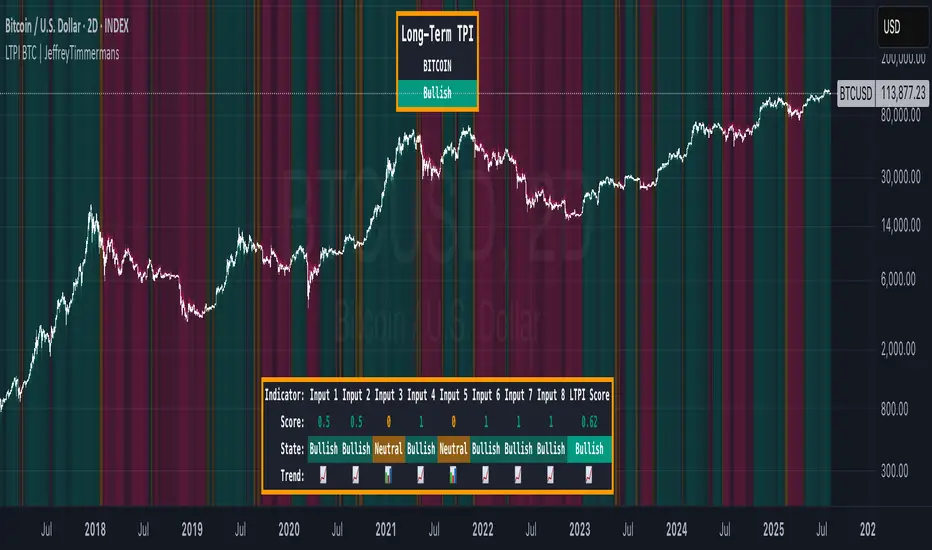
LTPI BTC | JeffreyTimmermansLong-Term Trend Probability Indicator
The "Long-Term Trend Probability Indicator" on BTC is a custom-built tool designed to analyze BTC from a long-term perspective. Unlike short-term indicators that react to price volatility, LTPI focuses on major trend shifts on BTC, and therefore across the entire crypto market, helping to identify major trend shifts early.
This version of the LTPI is applied to BTC, making it a BTC specific trend following tool, but very broad (crypto wise), because BTC is the biggest asset.
Key Features
Long-Term Focus:
Designed for macro market analysis with less sensitivity to short-term noise.
8 Input Signals:
Combines 8 carefully selected inputs (trend following indicators) into a single score that reflects the overall market condition.
Market Regimes:
Classifies the BTC trend into:
Bullish: Strong uptrend, expansion phase
Bearish: Strong downtrend, contraction phase
Neutral: Transitional or uncertain
Visual Background:
Background colors clearly display which regime is active.
Comprehensive Dashboard:
The panel at the bottom shows each input’s state, the composite LTPI score, and the resulting market trend.
How It Works
Inputs Analysis:
Each of the 8 inputs outputs one of three states:
+1 (Bullish)
-1 (Bearish)
0 (Neutral)
Score Calculation:
The total score is the sum of all 8 input signals divided by 8.
Score > 0.1 = Bullish
Score < -0.1 = Bearish
Between -0.1 and 0.1 = Neutral
Background Coloring:
Background colors dynamically adjust to reflect the long-term market regime.
Use Cases
Long-Term Positioning:
Identify periods of global expansion or contraction to position yourself accordingly.
Macro Confirmation:
Use LTPI in combination with medium-term (MTPI) and short-term tools for multi-timeframe confirmation.
Market Timing:
Alerts when LTPI crosses key thresholds help highlight the start of major bullish or bearish phases.
Dynamic Alerts:
Bullish Entry: LTPI score crosses above 0.1
Bearish Entry: LTPI score crosses below -0.1
Neutral Zone: Score moves back between -0.1 and 0.1
Conclusion
The Long-Term Trend Probability Indicator (LTPI – BTC) is a powerful tool for identifying long-term market phases across the entire crypto ecosystem. By focusing on long term trends and combining 8 inputs into a single probability score, it provides a clear macro trend perspective for strategic decision-making.
Greer Free Cash Flow Yield✅ Title
Greer Free Cash Flow Yield (FCF%) — Long-Term Value Signal
📝 Description
The Greer Free Cash Flow Yield indicator is part of the Greer Financial Toolkit, designed to help long-term investors identify fundamentally strong and potentially undervalued companies.
📊 What It Does
Calculates Free Cash Flow Per Share (FY) from official financial reports
Divides by the current stock price to produce Free Cash Flow Yield %
Tracks a static average across all available financial years
Color-codes the yield line:
🟩 Green when above average (stronger value signal)
🟥 Red when below average (weaker value signal)
💼 Why It Matters
FCF Yield is a powerful metric that reveals how efficiently a company turns revenue into usable cash. This can be a better long-term value indicator than earnings yield or P/E ratios, especially in capital-intensive industries.
✅ Best used in combination with:
📘 Greer Value (fundamental growth score)
🟢 Greer BuyZone (technical buy zone detection)
🔍 Designed for:
Fundamental investors
Value screeners
Dividend and FCF-focused strategies
📌 This tool is for informational and educational use only. Always do your own research before investing.

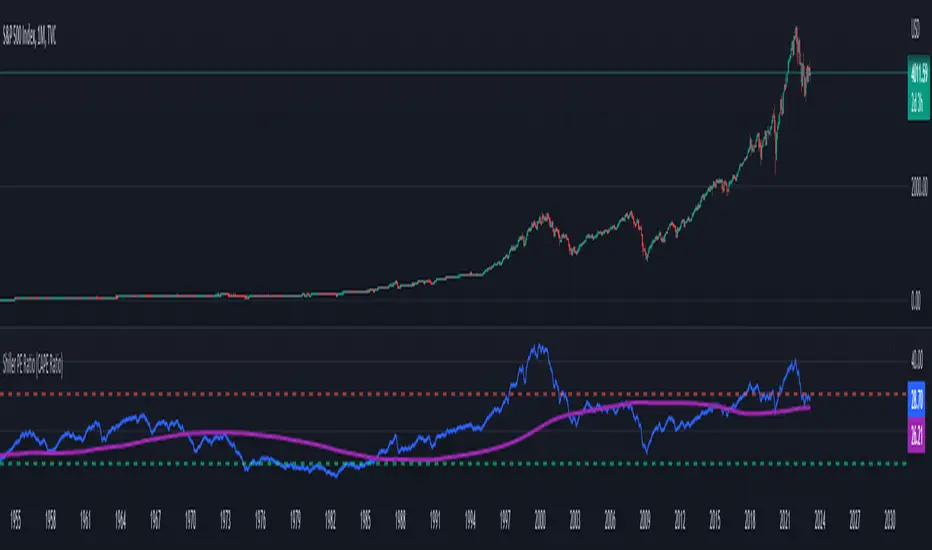
S&P 500 & Normalized CAPE Z-Score AnalyzerThis macro-focused indicator visualizes the historical valuation of the U.S. equity market using the CAPE ratio (Shiller P/E), normalized over its long-term average and standard deviations. It helps traders and investors identify overvaluation and undervaluation zones over time, combining both statistical signals and historical context.
💡 Why It’s Useful
This indicator is ideal for macro traders and long-term investors looking to contextualize equity valuations across decades. It helps identify statistical extremes in valuation by referencing the standard deviation of the CAPE ratio relative to its long-term mean. The overlay of S&P 500 price with valuation zones provides a visual confirmation tool for macro decisions or timing insights.
It includes:
✅ Three display modes:
-S&P 500 (color-coded by CAPE valuation zone)
-Normalized CAPE (vs. long-term mean)
-CAPE Z-Score (standardized measure)
🎯 How to Interpret
Dynamic coloring of the S&P 500 price based on CAPE valuation:
🔴 Z > +2σ → Highly Overvalued
🟠 Z > +1σ → Overvalued
⚪ -1σ < Z < +1σ → Neutral
🟢 Z < -1σ → Undervalued
✅ Z < -2σ → Strong Buy Zone
-Live valuation label showing the current CAPE, Z-score, and zone.
-Macro event shading: major historical events (e.g. Great Depression, Oil Crisis, Dot-com Bubble, COVID Crash) are shaded on the chart for context.
✅ Built-in alerts:
CAPE > +2σ → Potential risk zone
CAPE < -2σ → Potential opportunity zone
📊 Use Cases
This indicator is ideal for:
🧠 Macro traders seeking long-term valuation extremes.
📈 Portfolio managers monitoring systemic valuation risk.
🏛️ Long-term investors timing strategic allocation shifts.
🧪 How It Works
CAPE ratio (Shiller PE) is retrieved from Quandl (MULTPL/SHILLER_PE_RATIO_MONTH).
The script calculates the long-term average and standard deviation of CAPE.
The Z-score is computed as:
(CAPE - Mean) / Standard Deviation
Users can switch between:
S&P 500 chart, color-coded by CAPE valuation zones.
Normalized CAPE, centered around zero (historic mean).
CAPE Z-score, showing statistical positioning directly.
Visual bands represent +1σ, +2σ, -1σ, -2σ thresholds.
You can switch between modes using the “Display” dropdown in the settings panel.
📊 Data Sources
CAPE: MULTPL/SHILLER_PE_RATIO_MONTH via Quandl
S&P 500: Monthly close prices of SPX (TradingView data)
All data updated on monthly resolution
This is not a repackaged built-in or autogenerated script. It’s a custom-built and interactive indicator designed for educational and analytical use in macroeconomic valuation studies.

Modern Economic Eras DashboardOverview
This script provides a historical macroeconomic visualization of U.S. markets, highlighting long-term structural "eras" such as the Bretton Woods period, the inflationary 1970s, and the post-2020 "Age of Disorder." It overlays key economic indicators sourced from FRED (Federal Reserve Economic Data) and displays notable market crashes, all in a clean and rescaled format for easy comparison.
Data Sources & Indicators
All data is loaded monthly from official FRED series and rescaled to improve readability:
🔵 Real GDP (FRED:GDP): Total output of the U.S. economy.
🔴 Inflation Index (FRED:CPIAUCSL): Consumer price index as a proxy for inflation.
⚪ Debt to GDP (FRED:GFDGDPA188S): Federal debt as % of GDP.
🟣 Labor Force Participation (FRED:CIVPART): % of population in the labor force.
🟠 Oil Prices (FRED:DCOILWTICO): Monthly WTI crude oil prices.
🟡 10Y Real Yield (FRED:DFII10): Inflation-adjusted yield on 10-year Treasuries.
🔵 Symbol Price: Optionally overlays the charted asset’s price, rescaled.
Historical Crashes
The dashboard highlights 10 major U.S. market crashes, including 1929, 2000, and 2008, with labeled time spans for quick context.
Era Classification
Six macroeconomic eras based on Deutsche Bank’s Long-Term Asset Return Study (2020) are shaded with background color. Each era reflects dominant economic regimes—globalization, wars, monetary systems, inflationary cycles, and current geopolitical disorder.
Best Use Cases
✅ Long-term macro investors studying structural market behavior
✅ Educators and analysts explaining economic transitions
✅ Portfolio managers aligning strategy with macroeconomic phases
✅ Traders using history for cycle timing and risk assessment
Technical Notes
Designed for monthly timeframe, though it works on weekly.
Uses close price and standard request.security calls for consistency.
Max labels/lines configured for broader history (from 1860s to present).
All plotted series are rescaled manually for better visibility.
Originality
This indicator is original and not derived from built-in or boilerplate code. It combines multiple economic dimensions and market history into one interactive chart, helping users frame today's markets in a broader structural context.

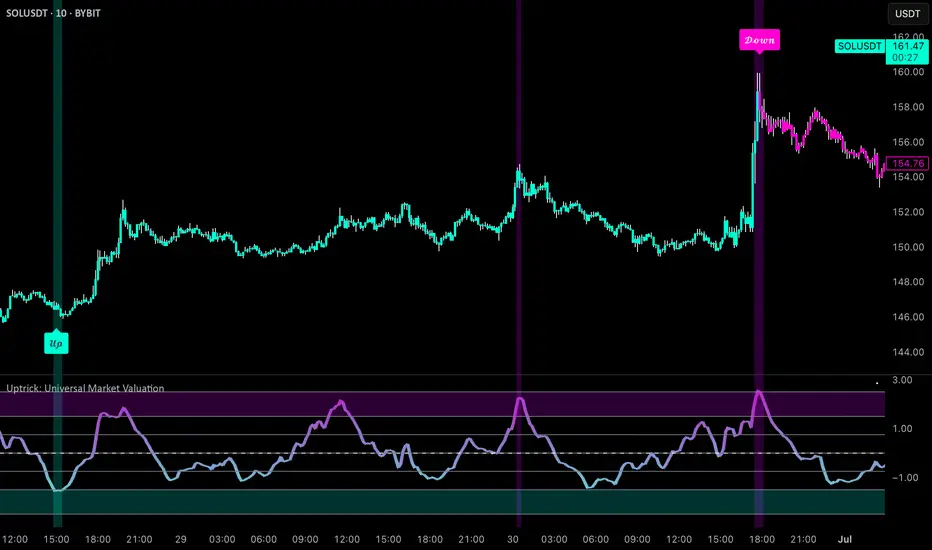
Uptrick: Universal Market ValuationIntroduction
Uptrick: Universal Market Valuation is created for traders who seek an analytical tool that brings together multiple signals in one place. Whether you focus on intraday scalping or long-term portfolio management, the indicator merges various well-known technical indicators to help gauge potential overvaluation, undervaluation, and trend direction. It is engineered to highlight different market dimensions, from immediate price momentum to extended cyclical trends.
Overview
The indicator categorizes market conditions into short-term, long-term, or a classic Z-Score style reading. Additionally, it draws on a unified trend line for directional bias. By fusing elements from traditionally separate indicators, the indicator aims to reduce “false positives” while giving a multidimensional view of price behavior. The indicator works best on cryptocurrency markets while remaining a universal valuation indicator that performs well across all timeframes. However, on lower timeframes, the Long-Term Combo input may be too long-term, so it's recommended to select the Short-Term Combo in the inputs for better adaptability.
Originality and Value
The Uptrick: Universal Market Valuation indicator is not just a simple combination of existing technical indicators—it introduces a multi-layered, adaptive valuation model that enhances signal clarity, reduces false positives, and provides traders with a more refined assessment of market conditions.
Rather than treating each included indicator as an independent signal, this script normalizes and synthesizes multiple indicators into a unified composite score, ensuring that short-term and long-term momentum, mean reversion, and trend strength are all dynamically weighted based on market behavior. It employs a proprietary weighting system that adjusts how each component contributes to the final valuation output. Instead of static threshold-based signals, the indicator integrates adaptive filtering mechanisms that account for volatility fluctuations, drawdowns, and momentum shifts, ensuring more reliable overbought/oversold readings.
Additionally, the script applies Z-Score-based deviation modeling, which refines price valuation by filtering out extreme readings that are statistically insignificant. This enhances the detection of true overvaluation and undervaluation points by comparing price behavior against a dynamically calculated standard deviation threshold rather than relying solely on traditional fixed oscillator bands. The MVRV-inspired ratio provides a unique valuation layer by incorporating historical fair-value estimations, offering deeper insight into market overextension.
The Universal Trend Line within the indicator is designed to smooth trend direction while maintaining responsiveness to market shifts. Unlike conventional trend indicators that may lag significantly or produce excessive false signals, this trend-following mechanism dynamically adjusts to changing price structures, helping traders confirm directional bias with reduced noise. This approach enables clearer trend recognition and assists in distinguishing between short-lived pullbacks and sustained market movements.
By merging momentum oscillators, trend strength indicators, volume-driven metrics, statistical deviation models, and long-term valuation principles into a single framework, this indicator eliminates the need for juggling multiple individual indicators, helping traders achieve a holistic market perspective while maintaining customization flexibility. The combination of real-time alerts, dynamic color-based valuation visualization, and customizable trend-following modes further enhances usability, making it a comprehensive tool for traders across different timeframes and asset classes.
Inputs and Features
• Calculation Window (Short-Term and Long-Term)
Defines how much historical data the indicator uses to evaluate the market. A smaller window makes the indicator more reactive, benefiting high-frequency traders. A larger window provides a steadier perspective for longer-term holders.
• Smoothing Period (Short-Term and Long-Term)
Controls how much the raw indicator outputs are “smoothed out.” Lower values reveal subtle intraday fluctuations, while higher values aim to present more robust, stable signals.
• Valuation Mechanism (Short Term Combo, Long Term Combo, Classic Z-Score)
Allows you to pick how the indicator evaluates overvaluation or undervaluation. Short Term Combo focuses on rapid oscillations, Long Term Combo assesses market health over more extended periods, and the Classic Z-Score approach highlights statistically unusual price levels.
Short-Term
• Determination Mechanism (Strict or Loose)
Governs the tolerance for labeling a market as overvalued or undervalued. Strict requires stronger confirmation; Loose begins labeling sooner, potentially catching moves earlier but risking more false signals.
Strict
Loose
• Select Color Scheme
Lets you choose the aesthetic style for your charts. Visual clarity can significantly improve reaction time, especially when multiple indicators are combined.
• Z-Score Coloring Mode (Heat or Slope)
Determines how the Classic Z-Score line and bars are colored. In Heat mode, the indicator intensifies color as readings move further from a baseline average. Slope mode changes color based on the direction of movement, making turning points more evident.
Classic Z-Score - Heat
Classic Z-Score - Slope
• Trend Following Mode (Short, Long, Extra Long, Filtered Long)
Offers various ways to compute and smooth the universal trend line. Short is more sensitive, Long and Extra Long are meant for extended time horizons, and Filtered Long applies an extra smoothing layer to help you see overarching trends rather than smaller fluctuations.
Short Term
Long Term
Extra Long Term
Filtered Long Term
• Table Display
An optional feature that places a concise summary table on the chart. It shows valuation states, trend direction, volatility condition, and other metrics, letting you observe multi-angle readings at a glance.
• Alerts
Multiple alert triggers can be set up—for crossing into overvaluation zones, for abrupt changes in trend, or for high volatility detection. Traders can stay informed without needing to watch charts continuously.
Why These Indicators Were Merged
• RSI (Relative Strength Index)
RSI is a cornerstone momentum oscillator that interprets speed and change of price movements. It has widespread recognition among traders for detecting potential overbought or oversold conditions. Including RSI provides a tried-and-tested layer of momentum insight.
• Stochastic Oscillator
This oscillator evaluates the closing price relative to its recent price range. Its responsiveness makes it valuable for pinpointing near-term price fluctuations. Where RSI offers a broader momentum picture, Stochastic adds fine-tuned detection of short-lived rallies or pullbacks.
• MFI (Money Flow Index)
MFI assesses buying and selling pressure by incorporating volume data. Many technical tools are purely price-based, but MFI’s volume component helps address questions of liquidity and actual money flow, offering a glimpse of how robust or weak a current move might be.
• CCI (Commodity Channel Index)
CCI shows how far price lies from its statistically “typical” trend. It can spot emerging trends or warn of overextension. Using CCI alongside RSI and Stochastic further refines the valuation layer by capturing price deviation from its underlying trajectory.
• ADX (Average Directional Index)
ADX reveals the strength of a trend but does not specify its direction. This is especially useful in combination with other oscillators that focus on bullish or bearish momentum. ADX can clarify whether a market is truly trending or just moving sideways, lending deeper context to the indicator's broader signals.
• MACD (Moving Average Convergence Divergence)
MACD is known for detecting momentum shifts via the interaction of two moving averages. Its inclusion ensures the indicator can capture transitional phases in market momentum. Where RSI and Stochastic concentrate on shorter-term changes, MACD has a slightly longer horizon for identifying robust directional changes.
• Momentum and ROC (Rate of Change)
Momentum and ROC specifically measure the velocity of price moves. By indicating how quickly (or slowly) price is changing compared to previous bars, they help confirm whether a trend is gathering steam, losing it, or is in a transitional stage.
• MVRV-Inspired Ratio
Drawn loosely from the concept of comparing market value to some underlying historical or fair-value metric, an MVRV-style ratio can help identify if an asset is trading above or below a considered norm. This additional viewpoint on valuation goes beyond simple price-based oscillations.
• Z-Score
Z-Score interprets how many standard deviations current prices deviate from a central mean. This statistical measure is often used to identify extreme conditions—either overly high or abnormally low. Z-Score helps highlight potential mean reversion setups by showing when price strays far from typical levels.
By merging these distinct viewpoints—momentum oscillators, trend strength gauges, volume flow, standard deviation extremes, and fundamental-style valuation measures—the indicator aims to create a well-rounded, carefully balanced final readout. Each component serves a specialized function, and together they can mitigate the weaknesses of a single metric acting alone.
Summary
This indicator simplifies multi-indicator analysis by fusing numerous popular technical signals into one tool. You can switch between short-term and long-term valuation perspectives or adopt a classic Z-Score approach for spotting price extremes. The universal trend line clarifies direction, while user-friendly color schemes, optional tabular summaries, and customizable alerts empower traders to maintain awareness without constantly monitoring every market tick.
Disclaimer
The indicator is made for educational and informational use only, with no claims of guaranteed profitability. Past data patterns, regardless of the indicators used, never ensure future results. Always maintain diligent risk management and consider the broader market context when making trading decisions. This indicator is not personal financial advice, and Uptrick disclaims responsibility for any trading outcomes arising from its use.
Long and Short Term Highs and LowsLong and Short Term Highs and Lows
Overview:
This indicator is designed to help traders identify significant price points by marking new highs and lows over two distinct timeframes—a long-term and a short-term period. It achieves this by drawing optional channel lines that outline the highest highs and lowest lows over the chosen time periods and by plotting visual markers (triangles) on the chart when a new high or low is detected.
Key Features:
Dual Timeframe Analysis:
Long Term: Uses a user-defined “Time Period” (default 52) and “Time Unit” (default: Weekly) to determine long-term high and low levels.
Short Term: Uses a separate “Time Period” (default 50) and “Time Unit” (default: Daily) to compute short-term high and low levels.
Optional Channel Display:
For both long and short term periods, you have the option to display a channel by plotting the highest and lowest values as lines. This visual channel helps to delineate the range within which the price has traded over the selected period.
New High/Low Markers:
The indicator identifies moments when the highest high or lowest low is updated relative to the previous bar.
When a new high is established, an up triangle is plotted above the bar.
Conversely, when a new low occurs, a down triangle is plotted below the bar.
Separate input toggles allow you to enable or disable these markers independently for the long-term and short-term setups.
Inputs and Settings:
Long Term High/Low Period Settings:
Show New High/Low? (STW): Toggle to enable or disable the plotting of new high/low markers for the long-term period.
Time Period: The number of bars used to calculate the highest high and lowest low (default is 52).
Time Unit: The timeframe on which the long-term calculation is based (default is Weekly).
Show Channel? (SCW): Toggle to display the channel lines that connect the long-term high and low levels.
Short Term High/Low Period Settings:
Show New High/Low?: Toggle to enable or disable the plotting of new high/low markers for the short-term period.
Time Period: The number of bars used for calculating the short-term extremes (default is 50).
Time Unit: The timeframe on which the short-term calculations are based (default is Daily).
Show Channel?: Toggle to display the channel lines for the short-term highs and lows.
Indicator Logic:
Channel Calculation:
The script uses the request.security function to pull data from the specified timeframes. For each timeframe:
It calculates the lowest low over the defined period using ta.lowest.
It calculates the highest high over the defined period using ta.highest.
These values can be optionally plotted as channel lines when the “Show Channel?” option is enabled.
New High/Low Detection:
For each timeframe, the indicator compares the current high (or low) with its immediate previous value:
New High: When the current high exceeds the previous bar’s high, an up triangle is drawn above the bar.
New Low: When the current low falls below the previous bar’s low, a down triangle is drawn below the bar.
Usage and Interpretation:
Trend Identification:
When new highs (or lows) occur, they can signal the start of a strong upward (or downward) movement. The indicator helps you visually track these critical turning points over both longer and shorter periods.
Channel Breakouts:
The optional channel display offers additional context. Price movement beyond these channels may indicate a breakout or a significant shift in trend.
Customizable Timeframes:
You can adjust both the time period and time unit to fit your trading style—whether you’re focusing on longer-term trends or short-term price action.
Conclusion:
This indicator provides a dual-layer analysis by combining long-term and short-term perspectives, making it a versatile tool for identifying key highs and lows. Whether you are looking to confirm trend strength or spot potential breakouts, the “Long and Short Term Highs and Lows” indicator adds a valuable visual element to your TradingView charts.

3x Supertrend (for Vietnamese stock market and vn30f1m)The 4Vietnamese 3x Supertrend Strategy is an advanced trend-following trading system developed in Pine Script™ and designed for publication on TradingView as an open-source strategy under the Mozilla Public License 2.0. This strategy leverages three Supertrend indicators with different ATR lengths and multipliers to identify optimal trade entries and exits while dynamically managing risk.
Key Features:
Option to build and hold long term positions with entry stop order. Try this to avoid market complex movement and retain long term investment style's benefits.
Advanced Entry & Exit Optimization: Includes configurable stop-loss mechanisms, pyramiding, and exit conditions tailored for different market scenarios.
Dynamic Risk Management: Implements features like selective stop-loss activation, trade window settings, and closing conditions based on trend reversals and loss management.
This strategy is particularly suited for traders seeking a systematic and rule-based approach to trend trading. By making it open-source, we aim to provide transparency, encourage community collaboration, and help traders refine and optimize their strategies for better performance.
License:
This script is released under the Mozilla Public License 2.0, allowing modifications and redistribution while maintaining open-source integrity.
Happy trading!

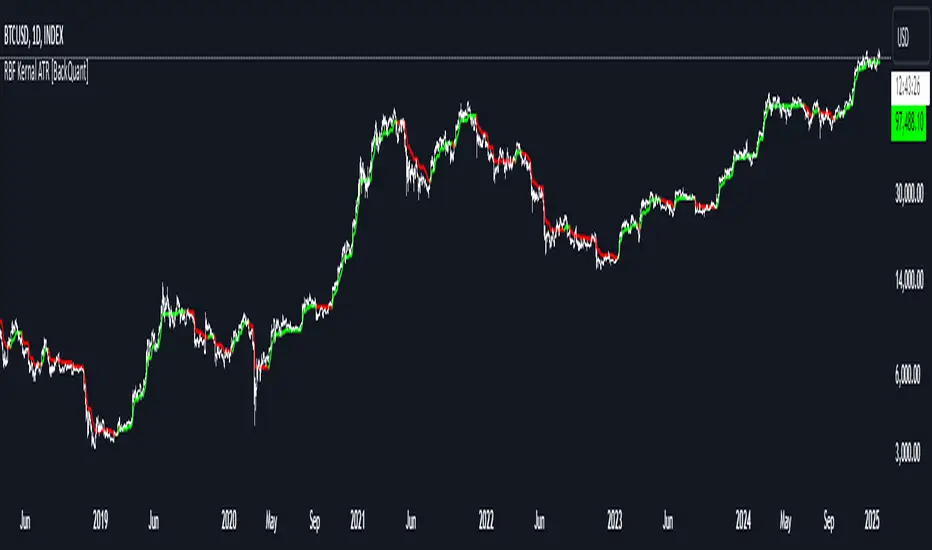
Radial Basis Kernal ATR [BackQuant]Radial Basis Kernel ATR
The Radial Basis Kernel ATR is a trading indicator that combines the classic Average True Range (ATR) with advanced Radial Basis Function (RBF) kernel smoothing . This innovative approach creates a highly adaptive and precise tool for detecting volatility, identifying trends, and providing dynamic support and resistance levels.
With its configurable parameters and ability to adjust to market conditions, this indicator offers traders a robust framework for making informed decisions across various assets and timeframes.
Key Feature: Radial Basis Function Kernel Smoothing
The Radial Basis Function (RBF) kernel is at the heart of this indicator, applying sophisticated mathematical techniques to smooth price data and calculate an enhanced version of ATR. By weighting data points dynamically, the RBF kernel ensures that recent price movements are given appropriate emphasis without overreacting to short-term noise.
The RBF kernel uses a gamma factor to control the degree of smoothing, making it highly adaptable to different asset classes and market conditions:
Gamma Factor Adjustment :
For low-volatility data (e.g., indices), a smaller gamma (0.05–0.1) ensures smoother trends and avoids overly sharp responses.
For high-volatility data (e.g., cryptocurrencies), a larger gamma (0.1–0.2) captures the increased price fluctuations while maintaining stability.
Experimentation is Key : Traders are encouraged to backtest and visually compare different gamma values to find the optimal setting for their specific asset and strategy.
The gamma factor dynamically adjusts based on the variance of the source data, ensuring the indicator remains effective across a wide range of market conditions.
Average True Range (ATR) with Dynamic Bands
The ATR is a widely used volatility measure that captures the degree of price movement over a specific period. This indicator enhances the traditional ATR by integrating the RBF kernel, resulting in a smoothed and adaptive ATR calculation.
Dynamic bands are created around the RBF kernel output using a user-defined ATR factor , offering valuable insights into potential support and resistance zones. These bands expand and contract based on market volatility, providing a visual representation of potential price movement.
Moving Average Confluence
For additional confirmation, the indicator includes the option to overlay a moving average on the smoothed ATR. Traders can choose from several moving average types, such as EMA , SMA , or Hull , and adjust the lookback period to suit their strategy. This feature helps identify broader trends and potential confluence areas, making the indicator even more versatile.
Long and Short Trend Detection
The indicator provides long and short signals based on the directional movement of the smoothed ATR:
Long Signal : Triggered when the ATR crosses above its previous value, indicating bullish momentum.
Short Signal : Triggered when the ATR crosses below its previous value, signaling bearish momentum.
These trend signals are visually highlighted on the chart with green and red bar coloring (optional), providing clear and actionable insights.
Customization Options
The Radial Basis Kernel ATR offers extensive customization options, allowing traders to tailor the indicator to their preferences:
RBF Kernel Settings
Source : Select the price data (e.g., close, high, low) used for the kernel calculation.
Kernel Length : Define the lookback period for the RBF kernel, controlling the smoothing effect.
Gamma Factor : Adjust the smoothing sensitivity, with smaller values for smoother trends and larger values for responsiveness.
ATR Settings
ATR Period : Set the period for ATR calculation, with shorter periods capturing more short-term volatility and longer periods providing a broader view.
ATR Factor : Adjust the scaling of ATR bands for dynamic support and resistance levels.
Confluence Settings
Moving Average Type : Choose from various moving average types for additional trend confirmation.
Moving Average Period : Define the lookback period for the moving average overlay.
Visualization
Trend Coloring : Enable or disable bar coloring based on trend direction (green for long, red for short).
Background Highlighting : Add optional background shading to emphasize long and short trends visually.
Line Width : Customize the thickness of the plotted ATR line for better visibility.
Alerts and Automation
To help traders stay on top of market movements, the indicator includes built-in alerts for trend changes:
Kernel ATR Trend Up : Triggered when the ATR indicates a bullish trend.
Kernel ATR Trend Down : Triggered when the ATR signals a bearish trend.
These alerts ensure traders never miss important opportunities, providing timely notifications directly to their preferred device.
Suggested Gamma Values
The effectiveness of the gamma factor depends on the asset type and the selected kernel length:
Low Volatility Assets (e.g., indices): Use a smaller gamma factor (approximately 0.05–0.1) for smoother trends.
High Volatility Assets (e.g., crypto): Use a larger gamma factor (approximately 0.1–0.2) to capture sharper price movements.
Experimentation : Fine-tune the gamma factor using backtests or visual comparisons to optimize for specific assets and strategies.
Trading Applications
The Radial Basis Kernel ATR is a versatile tool suitable for various trading styles and strategies:
Trend Following : Use the smoothed ATR and dynamic bands to identify and follow trends with confidence.
Reversal Trading : Spot potential reversals by observing interactions with dynamic ATR bands and moving average confluence.
Volatility Analysis : Analyze market volatility to adjust risk management strategies or position sizing.
Final Thoughts
The Radial Basis Kernel ATR combines advanced mathematical techniques with the practical utility of ATR, offering traders a powerful and adaptive tool for volatility analysis and trend detection. Its ability to dynamically adjust to market conditions through the RBF kernel and gamma factor makes it a unique and indispensable part of any trader's toolkit.
By combining sophisticated smoothing , dynamic bands , and customizable visualization , this indicator enhances the ability to read market conditions and make more informed trading decisions. As always, backtesting and incorporating it into a broader strategy are recommended for optimal results.
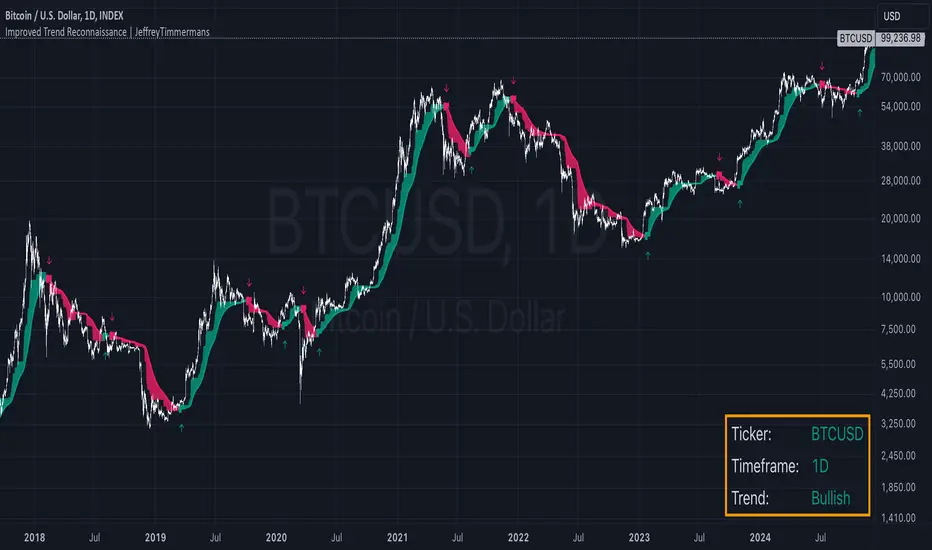
Improved Trend Reconnaissance | JeffreyTimmermansImproved Trend Reconnaissance
The Improved Trend Reconnaissance indicator is a robust tool designed to help traders identify and follow trends while avoiding market noise. It is especially effective for capturing longer-term trends and sustained price movements over extended time periods. By leveraging smoothed trend analysis and volatility-based consolidation detection, this indicator provides clear and actionable insights for traders focusing on significant market trends.
What Does This Indicator Do?
At its core, this indicator calculates a Half Trend value and applies advanced smoothing techniques to emphasize longer-term trends. Additionally, it incorporates volatility analysis using the Average True Range (ATR) to detect periods of consolidation, where trend signals are muted to prevent false signals.
Key Components Explained
Half Trend Calculation:
This indicator determines a Half Trend value based on the relationship between the Exponential Moving Average (EMA) of closing prices and the highest highs and lowest lows over a specified range.
The trend is further smoothed to minimize short-term fluctuations, ensuring the focus remains on sustained price movements.
ATR-Based Consolidation Detection:
By comparing the range of price highs and lows to a multiple of ATR, the indicator detects consolidation zones where the market is range-bound. During these periods, trend signals are suppressed to avoid false positives.
Trend Visualization:
Bullish Trends: Highlighted in green with upward markers and optional trend-colored candles.
Bearish Trends: Highlighted in red with downward markers and optional trend-colored candles.
Designed for Longer-Term Trends:
The default settings are optimized to capture longer-term trends, making this indicator particularly valuable for traders looking to identify and follow substantial market movements over extended periods.
Key Features
Optimized for Capturing Longer Trends:
With the default settings, the indicator is tailored to identify and follow longer-term price trends, reducing noise from minor fluctuations. This makes it ideal for traders focused on significant trends and extended price movements.
Customizable Inputs:
Parameters such as trend range, smoothing length, ATR calculation period, and consolidation threshold are fully customizable.
Visual settings, including trend colors and signal sizes, can be adjusted for personalized trading needs.
Dynamic Signal Generation:
Bullish Signals: Generated when the smoothed Half Trend crosses upward and the market is trending.
Bearish Signals: Generated when the smoothed Half Trend crosses downward and the market is trending.
Alerts can notify traders in real time when these conditions occur.
Enhanced Visualization:
Candle coloring based on trend direction provides an immediate visual representation of market momentum.
Plotted trend lines and filled regions between them emphasize the current trend's strength and direction.
Real-Time Dashboard:
Displays essential information, including the current ticker, trend direction, and status (bullish or bearish), directly on the chart.
How to Use This Indicator
Identify Longer-Term Trends:
Use the smoothed Half Trend line and trend-colored candles to identify and follow significant price trends.
The default settings are specifically designed to focus on extended trends, making it easier to spot major market moves.
Avoid Noise in Consolidation:
Pay attention to the consolidation detection feature, which suppresses signals during range-bound market conditions, aka mean-reverting markets.
This ensures that signals generated are more reliable and actionable.
Confirm Trend Signals:
Use the visual markers (flags) and dashboard status to validate bullish or bearish trends before making trading decisions.
Set Alerts:
Set alerts for bullish or bearish signals to stay informed about key market movements without constantly monitoring the charts.
Adapt for Your Strategy:
While optimized for longer-term trends, the customizable settings allow you to adapt the indicator for shorter-term strategies if needed.
What Makes This Indicator Unique?
Focus on Longer-Term Trends:
Unlike many indicators that respond to short-term fluctuations, this tool is tailored for longer-term trend-following systems, ensuring that traders capture the most meaningful price movements.
Noise Reduction:
By combining smoothing techniques and ATR-based consolidation detection, the indicator reduces market noise and focuses on actionable insights.
Clear Visual Representation:
The combination of trend-colored candles, plotted lines, and dashboard information simplifies the analysis of complex market trends.
Customizability:
Fully adjustable parameters ensure the indicator meets the specific needs of a wide range of trading styles.
Real-Time Feedback:
Alerts and dashboard integration keep traders informed, enabling timely and well-informed decision-making.
The Improved Trend Reconnaissance indicator is an essential tool for traders looking to focus on longer-term trends and sustained market movements. With its default settings optimized for capturing significant trends over extended periods, it offers clarity, precision, and actionable insights for successful trend-following trading.
-Jeffrey
DCA Fundamentals 1.0DCA Fundamentals 1.0
Description:
DCA Fundamentals 1.0 is an invite-only indicator designed to help traders and investors make informed decisions by analyzing key fundamental metrics of a company. It aggregates essential financial data—such as book value, earnings per share, total equity, total debt, net income, and total revenue—to provide a comprehensive overview of the stock’s intrinsic value and risk profile. By examining factors like the debt-to-equity ratio and dynamically computing Buffet’s Limit, this tool assists in identifying whether a stock may be undervalued, fairly valued, or overvalued.
Key Features:
Intrinsic Value Calculation: Estimates a stock’s intrinsic worth using a weighted combination of book value per share and EPS.
Buffet’s Limit & Margin of Safety: Adjusts intrinsic value based on the company’s debt-to-equity ratio, providing a margin of safety percentage to gauge potential investment risk.
Debt Warning: Highlights when the debt-to-equity ratio exceeds 2, signaling possible financial instability.
Data Visualization: Displays equity, debt, net income, and revenue as area plots or histograms, helping users quickly assess financial health.
Investment Status: Classifies the stock as undervalued, fairly valued, or overvalued based on current price relative to intrinsic value and Buffet’s Limit.
Dividend-to-ROE Ratio: Offers insight into dividend payout sustainability relative to the company’s return on equity.
Instructions
Fallback Data Handling:
If any financial data is unavailable, fallback values are automatically used to ensure that key calculations remain meaningful and uninterrupted.
Intrinsics & Risk Assessment:
Intrinsic Value: Computed using book value and EPS to understand the stock’s core worth.
Buffet’s Limit: Adjusted from the intrinsic value based on the debt-to-equity ratio. The resulting margin of safety helps gauge the current price’s risk level.
Debt Warning:
Debt-to-Equity Ratio > 2: Triggers a red warning, advising caution due to potentially excessive debt.
Visual Indicators:
Intrinsically Undervalued (Green Area): When price is below intrinsic value, a green shaded area suggests the stock may be undervalued, potentially presenting a buying opportunity.
Debt vs. Equity (Area Plots):
Red Area: Represents debt. A larger red area signals relatively high debt levels.
Green Area: Represents equity. A larger green area suggests stronger financial health.
Revenue & Net Income (Histograms):
Green Bars: Positive or improving fundamentals.
Red Bars: Negative or declining performance.
Investment Status:
Undervalued (Green): Price below intrinsic value.
Fairly Valued (Yellow): Price between intrinsic value and Buffet’s Limit.
Overvalued (Red): Price above intrinsic value, implying increased downside risk.
Table Display:
A convenient table summarizes key metrics at a glance, including P/E ratio, Debt-to-Equity ratio, intrinsic value, margin of safety, net income, total revenue, and the Dividend-to-ROE Ratio.
Dividend-to-ROE Ratio:
This metric provides additional context on the company’s dividend policy relative to its return on equity, aiding in evaluating dividend sustainability.
Disclaimer
Important Disclaimer:
The DCA Fundamentals 1.0 indicator is provided solely for educational and informational purposes. It is not investment advice, a recommendation, or an endorsement of any security or strategy. All calculations are based on data provided by third parties, and their accuracy or completeness is not guaranteed.
Investing and trading involve significant risks. You may lose more than your initial investment. Historical performance or indicators cannot guarantee future results. Before making any investment decisions, you should conduct thorough research, consider consulting a qualified financial professional, and implement robust risk management strategies.
By using DCA Fundamentals 1.0, you acknowledge these risks and agree that neither the creator nor any affiliated parties are responsible for any losses incurred. Use this tool at your own discretion and risk.

Trend Titan Neutronstar [QuantraSystems]Trend Titan NEUTRONSTAR
Credits
The Trend Titan NEUTRONSTAR is a comprehensive aggregation of nearly 100 unique indicators and custom combinations, primarily developed from unique and public domain code.
We'd like to thank our TradingView community members: @IkKeOmar for allowing us to add his well-built "Normalized KAMA Oscillator" and "Adaptive Trend Lines " indicators to the aggregation, as well as @DojiEmoji for his valuable "Drift Study (Inspired by Monte Carlo Simulations with BM)".
Introduction
The Trend Titan NEUTRONSTAR is a robust trend following algorithm meticulously crafted to meet the demands of crypto investors. Designed with a multi layered aggregation approach, NEUTRONSTAR excels in navigating the unique volatility and rapid shifts of the cryptocurrency market. By stacking and refining a variety of carefully selected indicators, it combines their individual strengths while reducing the impact of noise or false signals. This "aggregation of aggregators" approach enables NEUTRONSTAR to produce a consistently reliable trend signal across assets and timeframes, making it an exceptional tool for investors focused on medium to long term market positioning.
NEUTRONSTAR ’s powerful trend following capabilities provide investors with straightforward, data driven analysis. It signals when tokens exhibit sustained upward momentum and systematically removes allocations from assets showing signs of weakness. This structure aids investors in recognizing peak market phases. In fact, one of NEUTRONSTAR ’s most valuable applications is its potential to help investors time exits near the peak of bull markets. This aims to maximize gains while mitigating exposure to downturns.
Ultimately, NEUTRONSTAR equips investors with a high precision, adaptable framework for strategic decision making. It offers robust support to identify strong trends, manage risk, and navigate the dynamic crypto market landscape.
With over a year of rigorous forward testing and live trading, NEUTRONSTAR demonstrates remarkable robustness and effectiveness, maintaining its performance without succumbing to overfitting. The system has been purposefully designed to avoid unnecessary optimization to past data, ensuring it can adapt as market conditions evolve. By focusing on aggregating valuable trend signals rather than tuning to historical performance, the NEUTRONSTAR serves as a reliable universal trend following system that aligns with the natural market cycles of growth and correction.
Core Methodology
The foundation of the NEUTRONSTAR lies in its multi aggregated structure, where five custom developed trend models are combined to capture the dominant market direction. Each of these aggregates has been carefully crafted with a specific trend signaling period in mind, allowing it to adapt seamlessly across various timeframes and asset classes. Here’s a breakdown of the key components:
FLARE - The original Quantra Signaling Matrix (QSM) model, best suited for timeframes above 12 hours. It forms the foundation of long term trend detection, providing stable signals.
FLAREV2 - A refined and more sophisticated model that performs well across both high and low timeframes, adding a layer of adaptability to the system.
NEBULA - An advanced model combining FLARE and FLAREV2. NEBULA brings the advantages of both components together, enhancing reliability and capturing smoother, more accurate trends.
SPARK - A high speed trend aggregator based on the QSM Universal model. It focuses on fast moving trends, providing early signals of potential shifts.
SUNBURST - A balanced aggregate that combines elements of SPARK and FLARE, confirming SPARK’s signals while minimizing false positives.
Each of these models contributes its own unique perspective on market movement. By layering fast, medium, and slower trend following signals, NEUTRONSTAR can confirm strong trends while filtering out shorter term noise. The result is a comprehensive tool that signals clear market direction with minimized false signals.
A Unique Approach to Trend Aggregation
One of the defining characteristics of NEUTRONSTAR is its deliberate choice to avoid perfectly time coherent indicators within its aggregation. In simpler terms, NEUTRONSTAR purposefully incorporates trend following indicators with slightly different signal periods, rather than synchronizing all components to a single signaling period. This choice brings significant benefits in terms of diversification, adaptability, and robustness of the overall trend signal.
When aggregating multiple trend following components, if all indicators were perfectly time coherent - meaning they responded to market changes in exactly the same way and over the time periods - the resulting signal would effectively be no different from a single trend following indicator. This uniformity would limit the system’s ability to capture a variety of market conditions, leaving it vulnerable to the same noise or false signals that any single indicator might encounter. Instead, NEUTRONSTAR leverages a balanced mix of indicators with varied timing: some fast, some slower, and some in the medium range. This choice allows the system to extract the unique strengths of each component, creating a combined signal that is stronger and more reliable than any single indicator.
By incorporating different signal periods, NEUTRONSTAR achieves what can be thought of as a form of edge accumulation. The fast components within NEUTRONSTAR , for example, are highly sensitive to quick shifts in market direction. These indicators excel at identifying early trend signals, enabling NEUTRONSTAR to react swiftly to emerging momentum. However, these fast indicators alone would be prone to reacting to market noise, potentially generating too many premature signals. This is where the medium term indicators come into play. These components operate with a slower reaction time, filtering out the short term fluctuations and confirming the direction of the trend established by the faster indicators. The combination of these varying signal speeds results in a balanced, adaptive response to market changes.
This approach also allows NEUTRONSTAR to adapt to different market regimes seamlessly. In fast moving, volatile markets, the faster indicators provide an early alert to potential trend shifts, while the slower components offer a stabilizing influence, preventing overreaction to temporary noise. Conversely, in steadier or trending markets, the medium and slower indicators sustain the trend signal, reducing the likelihood of premature exits. This flexible design enhances NEUTRONSTAR ’s ability to operate effectively across multiple asset classes and timeframes, from short term fluctuations to longer term market cycles.
The result is a powerful, multi-layered trend following tool that remains adaptive, capturing the benefits of both fast and medium paced reactions without becoming overly sensitive to short term noise. This unique aggregation methodology also supports NEUTRONSTAR ’s robustness, reducing the risk of overfitting to historical data and ensuring that the system can perform reliably in forward testing and live trading environments. The slightly staggered signal periods provide a greater degree of resilience, making NEUTRONSTAR a dependable choice for traders looking to capitalize on sustained trends while minimizing exposure during periods of market uncertainty.
In summary, the lack of perfect time coherence among NEUTRONSTAR ’s sub components is not a flaw - but a deliberate, robust design choice.
Risk Management through Market Mode Analysis
An essential part of NEUTRONSTAR is its ability to assess the market's underlying behavior and adapt accordingly. It employs a Market Mode Analysis mechanism that identifies when the market is either in a “Trending State” or a “Mean Reverting State.” When enough confidence is established that the market is trending, the system confirms and signals a “Trending State,” which is optimal for maintaining positions in the direction of the trend. Conversely, if there’s insufficient confidence, it labels the market as “Mean Reverting,” alerting traders to potentially avoid trend trades during likely sideways movement.
This distinction is particularly valuable in crypto, where asset prices often oscillate between aggressive trends and consolidation periods. The Market Mode Analysis keeps traders aligned with the broader market conditions, minimizing exposure during periods of potential whipsaws and maximizing gains during sustained trends.
Zero Overfitting: Design and Testing for Real World Resilience
Unlike many trend following indicators that rely heavily on backtesting and optimization, NEUTRONSTAR was built to perform well in forward testing and live trading without post design adjustments. Over a year of live market exposure has all but proven its robustness, with the system’s methodology focused on universal applicability and simplicity rather than curve fitting to past data. This approach ensures the aggregator remains effective across different market cycles and maintains relevance as new data unfolds.
By avoiding overfitting, NEUTRONSTAR is inherently more resistant to the common issue of strategy degradation over time, making it a valuable tool for traders seeking reliable market analysis you can trust for the long term.
Settings and Customization Options
To accommodate a range of trading styles and market conditions, NEUTRONSTAR includes adjustable settings that allow for fine tuning sensitivity and signal generation:
Calculation Method - Users can choose between calculating the NEUTRONSTAR score based on aggregated scores or by using the state of individual aggregates (long, neutral, short). The score method provides faster signals with slightly more noise, while the state based approach offers a smoother signal.
Sensitivity Threshold - This setting adjusts the system’s sensitivity, defining the width of the neutral zone. Higher thresholds reduce sensitivity, allowing for a broader range of volatility before triggering a trend reversal.
Market Regime Sensitivity - A sensitivity adjustment, ranging from 0 to 100, that affects the sensitivity of the sub components in market regime calculation.
These settings offer flexibility for users to tailor NEUTRONSTAR to their specific needs, whether for medium term investment strategies or shorter term trading setups.
Visualization and Legend
For intuitive usability, NEUTRONSTAR uses color coded bar overlays to indicate trend direction:
Green - indicates an uptrend.
Gray - signals a neutral or transition phase.
Purple - denotes a downtrend.
An optional background color can be enabled for market mode visualization, indicating the overall market state as either trending or mean reverting. This feature allows traders to assess trend direction and strength at a glance, simplifying decision making.
Additional Metrics Table
To support strategic decision making, NEUTRONSTAR includes an additional metrics table for in depth analysis:
Performance Ratios - Sharpe, Sortino, and Omega ratios assess the asset’s risk adjusted returns.
Volatility Insights - Provides an average volatility measure, valuable for understanding market stability.
Beta Measurement - Calculates asset beta against BTC, offering insight into asset volatility in the context of the broader market.
These metrics provide deeper insights into individual asset behavior, supporting more informed trend based allocations. The table is fully customizable, allowing traders to adjust the position and size for a seamless integration into their workspace.
Final Summary
The Trend Titan NEUTRONSTAR indicator is a powerful and resilient trend following system for crypto markets, built with a unique aggregation of high performance models to deliver dependable, noise reduced trend signals. Its robust design, free from overfitting, ensures adaptability across various assets and timeframes. With customizable sensitivity settings, intuitive color coded visualization, and an advanced risk metrics table, NEUTRONSTAR provides traders with a comprehensive tool for identifying and riding profitable trends, while safeguarding capital during unfavorable market phases.

Johnny's Adjusted BB Buy/Sell Signal"Johnny's Adjusted BB Buy/Sell Signal" leverages Bollinger Bands and moving averages to provide dynamic buy and sell signals based on market conditions. This indicator is particularly useful for traders looking to identify strategic entry and exit points based on volatility and trend analysis.
How It Works
Bollinger Bands Setup: The indicator calculates Bollinger Bands using a specified length and multiplier. These bands serve to identify potential overbought (upper band) or oversold (lower band) conditions.
Moving Averages: Two moving averages are calculated — a trend moving average (trendMA) and a long-term moving average (longTermMA) — to gauge the market's direction over different time frames.
Market Phase Determination: The script classifies the market into bullish or bearish phases based on the relationship of the closing price to the long-term moving average.
Strong Buy and Sell Signals: Enhanced signals are generated based on how significantly the price deviates from the Bollinger Bands, coupled with the average candle size over a specified lookback period. The signals are adjusted based on whether the market is bullish or bearish:
In bullish markets, a strong buy signal is triggered if the price significantly drops below the lower Bollinger Band. Conversely, a strong sell signal is activated when the price rises well above the upper band.
In bearish markets, these signals are modified to be more conservative, adjusting the thresholds for triggering strong buy and sell signals.
Features:
Flexibility: Users can adjust the length of the Bollinger Bands and moving averages, as well as the multipliers and factors that determine the strength of buy and sell signals, making it highly customizable to different trading styles and market conditions.
Visual Aids: The script vividly plots the Bollinger Bands and moving averages, and signals are visually represented on the chart, allowing traders to quickly assess trading opportunities:
Regular buy and sell signals are indicated by simple shapes below or above price bars.
Strong buy and sell signals are highlighted with distinctive colors and placed prominently to catch the trader's attention.
Background Coloring: The background color changes based on the market phase, providing an immediate visual cue of the market's overall sentiment.
Usage:
This indicator is ideal for traders who rely on technical analysis to guide their trading decisions. By integrating both Bollinger Bands and moving averages, it provides a multi-faceted view of market trends and volatility, making it suitable for identifying potential reversals and continuation patterns. Traders can use this tool to enhance their understanding of market dynamics and refine their trading strategies accordingly.

FluxFilter Trend Strategy [BITsPIP]Hello fellow traders, I'm excited to share with you the FluxFilter Trend Strategy, a trading approach I've developed for those interested in exploring trend-following strategies. My goal was to create something straightforward and accessible, so traders looking to refine their portfolios can easily integrate its features. By the end of this guide, I hope you'll have a solid grasp of how the FluxFilter Trend Strategy functions, appreciate its benefits, understand its potential drawbacks, and see how it might fit into various trading contexts.
I) Overview
The FluxFilter Trend Strategy is tailored to align with the market's long-term trend. It examines the price data from the previous year to gauge the market's overall trajectory by employing moving averages. Subsequently, within shorter timeframes, the strategy utilizes a combination of modified Supertrend, Hull Suite, and various trend-following and filtering techniques to generate buy or sell signals. Although its advanced take profit and stop loss mechanisms might initially present a learning curve, they are integral to the strategy's effectiveness. They are designed to secure gains by capturing prevailing trends and mitigating the impact of false reversal signals.
II) Deep Backtesting
Deep backtesting stands as a cornerstone in the development of trading strategies, offering a robust method for traders to assess the performance of their strategy against historical data. This process yields a retrospective view, illustrating how the strategy might have navigated through past market fluctuations, thereby shedding light on its potential robustness and areas for refinement. However, it's crucial to acknowledge that a strategy's performance can be influenced by a myriad of factors including market dynamics, the chosen timeframe, and the inherent attributes of the traded asset. Consequently, it's advisable to conduct thorough backtesting under various conditions to ascertain the strategy's reliability before applying it to actual trading scenarios.
III) Benefits
A primary advantage of the FluxFilter Trend Strategy is its proficiency in discerning genuine market trends from mere price fluctuations, thereby avoiding premature or uncertain trades. Unlike approaches that take high risks on speculative trades, this strategy prioritizes a high degree of confidence in the direction of the trade. It meticulously waits for a clear confirmation of the market trend. Once this certainty is established, the strategy promptly generates trade signals, ensuring that traders are positioned to capitalize on optimal market entry points without delay. This approach not only enhances the potential for profit but also aligns with a disciplined and methodical trading ethos.
IV) Applications
FluxFilter Trend Strategy can be applied across various timeframes, with a particular efficacy in those under 15 minutes. Its adaptable framework means it can be customized to cater to a variety of asset classes, encompassing stocks, commodities, forex, and cryptocurrencies. Initially, the strategy was specifically calibrated for low-volatile cryptocurrencies, as reflected in the default settings for stop loss and take profit values. It's important to recognize that the unique volatility and trend patterns of your selected market necessitate careful adjustments to these parameters. This fine-tuning of profit targets and stop loss thresholds is crucial for aligning the strategy with the specific dynamics of your chosen market, which I will discuss shortly.
V) Strategy's Logic
1. Trend Identification: My conviction lies in the power of trend trading to yield long-term gains. Central to the FluxFilter Trend Strategy is the Hull Suite indicator, a tool developed by InSilico, serving as one of the confirmation indicators. This indicator acts as a compass for trend direction; a price residing above the Hull Suite line signals an uptrend, potentially marking an entry point for a buy position or confirming it. In contrast, a price positioned below this line suggests a downtrend, potentially indicating a strategic moment to sell or confirming the sell.
2. Noise Reduction: The financial markets are known for their 'noise'—short-lived price movements that can obscure the true market direction. The FluxFilter Trend Strategy is designed to sift through this noise, thereby facilitating more lucid and informed trading decisions. It employs a set of straightforward yet innovative techniques to single out significant misleading fluctuations. This is achieved by analyzing recent bars to spot bars with unusually large bodies, which often represent misleading market noise.
3. Risk Management: A key facet of the strategy is its emphasis on pragmatic risk management. Traders are empowered to establish practical stop-loss and take-profit levels, tailoring these crucial parameters to the specific market they are engaging in. This customization is instrumental in optimizing long-term profitability, ensuring that the strategy adapts fluidly to the unique characteristics and volatility patterns of different trading environments.
VI) Strategy's Input Settings and Default Values
1. Modified Supertrend
i. Factor: Serving as a multiplier in the Average True Range (ATR) calculation, this parameter adjusts the distance of the Supertrend line relative to the price chart. Elevating the factor value widens the gap between the Supertrend line and price, offering a more conservative stance. On the flip side, diminishing the factor value pulls the Supertrend line closer to the price action, heightening its sensitivity. While the preset value is 1, you have the flexibility to modify this to suit your trading approach.
ii. ATR Length: This defines the count of bars that are incorporated into the ATR computation, directly influencing the Supertrend's adaptability to market changes. With a default setting of 30 bars, it strikes a balance, smoothing over short-term fluctuations while maintaining a meaningful sensitivity to market trends. Adjusting this parameter allows you to tailor the indicator's responsiveness to suit your trading strategy, considering the volatility and behavioral patterns of the asset you are trading.
2. Hull Suite
i. Hull Suite Length: Designed for capturing long-term trends, the Hull Suite Length is configured at 1000. Functioning comparably to moving averages, the Hull Suite features upper and lower bands, though these are not employed in our current strategy.
ii. Length Multiplier: It's advisable to maintain a minimal value for the Length Multiplier, prioritizing the optimization of the Hull Suite Length. Presently, it is set to 1.
3. Filtering Indicators
i. Fluctuation Filtering Percentage: It's advisable to set this parameter to ten times the size of the average bar in your specific market, as this helps effectively mitigate the impact of market fluctuations. While the initial default is 0.4(%), based on the BTCUSDT market, it's crucial to adjust this figure to align with the characteristics of different assets or markets you're trading in.
ii. Fluctuation Filtering Bars: This parameter designates the count of preceding bars to consider when assessing market fluctuations. It's fully customizable, allowing you to tailor it based on your market insights. The preset default is 3, a balance chosen to minimize susceptibility to potentially misleading signals.
iii. Trend Confirmation Percentage: This metric is pivotal for verifying the viability of a trend post-entry. If the trade doesn't achieve this percentage in profit, it indicates a deviation from the expected trend. Under such circumstances, it may be prudent to exit the trade prematurely rather than awaiting the stop-loss trigger. It's recommended to set this parameter at half the size of the average candle body for the market you're analyzing. The initial default is set at 0.2(%).
4. StopLoss and TakeProfit
i. StopLoss and TakeProfit Settings: Two distinct approaches are available. Semi-Automatic StopLoss/TakeProfit Setting and Manual StopLoss/TakeProfit Setting. The Semi-Automatic mode streamlines the process by allowing you to input values for a 5-minute timeframe, subsequently auto-adjusting these values across various timeframes, both lower and higher. Conversely, the Manual mode offers full control, enabling you to meticulously define TakeProfit values for each individual timeframe.
ii. TakeProfit Threshold # and TakeProfit Value #: Imagine this mechanism as an ascending staircase. Each step represents a range, with the lower boundary (TakeProfit Value) designed to close the trade upon being reached, and the upper boundary (TakeProfit Threshold) upon being hit, propelling the trade to the next level, and forming a new range. This stair-stepping approach enhances risk management and has the potential to increase profitability. The pre-set configurations are tailored for volatile markets, such as BTCUSDT. It's advisable to devote time to tailoring these settings to your specific market, aiming to achieve optimal results based on backtesting.
iii. StopLoss Value: In line with its name, this value marks the limit of loss you're prepared to accept should the market trend go against your expectations. It's crucial to note that once your asset reaches the first TakeProfit range, the initial StopLoss value becomes obsolete, supplanted by the first TakeProfit Value. The default StopLoss value is pegged at 1.8(%), a figure worth considering in your trading strategy.
VII) Entry Conditions
The principal element that triggers the signal is the Modified Supertrend. Additional indicators serve as confirmatory tools. Nonetheless, to refine your strategy effectively, it's crucial to fine-tune the parameters. This involves adjusting input variables such as take profit levels, threshold parameters, and the filtering values discussed previously.
VIII) Exit Conditions
The strategy stipulates exit conditions primarily governed by stop loss and take profit parameters. On infrequent occasions, if the trend lacks confirmation post-entry, the strategy mandates an exit upon the issuance of a reverse signal (whether confirmed or unconfirmed) by the strategy itself.
Good Luck!!

DNS Relax Buy/SellDNS Relax Buy/Sell Indicator
It is a very simple indicator to use for long-term investors.
It uses ema 3 in Buy and Sell alerts. If ema 3 crosses the baseline line (ema200 Daily) up, it means Buy, and if it breaks down, it means Sell.
There is also a 'take profit line' to determine and see the profit rate.
It can be changed from the settings.
Additionally, the blue line on the indicator (appears as full blue) is the closing price line of the bar where the buy signal is located. It can be turned off from the style settings.
You can also turn buy and sell signals on and off from the settings.
My advice to you is to use this indicator in small time periods. for example, in 1-minute, 3-minutes or 5-minutes time periods.
It can be used in all financial instruments.
Wishing you to always win.

Buy Below Prev_Low. Sell 100% Above Avg. Pyramiding.This is simple indicator script for long term investors. It will check if the low of today is less than low of yesterday (or any time frame candle) and if the condition is satisfied, then the alert will be triggerred and that particular stock will be bought.
Each time a unit is bought, the average price is calculated and also the trget selling price, which is set at 100% above the average buying price. So once the price reaches that selling price target, the entire holding is sold.
The code resets all the variables back to 0 once a sell signal is triggerred.

Swing Algo V1.4◆ Introduction
The latest version of the Swing Algo features a complementary system consisting of two internal swing trading logics: an enhanced Swing Algo V1.3 and a secondary control engine to stabilize the overall strategy behaviour in times of increased market chop. Both algorithms feature different averaging lines as well as oscillators, leading to a higher strategy diversification for swing trading as well as a reduced maximum drawdown in comparison to each stand-alone strategy.
While the Swing Algo V1.x series so far featured a single trend-following swing algorithm for each release, where one just switches between Long and Short trades based on one general logic, here two strategies, which act independently of each other, are applied. Due to this, we introduce a third position a trader can be in: the Hedge. The overall logic is as follows:
When both sub-logics are Long, the overall strategy is Long.
When both sub-logics are Short, the overall strategy is Short.
When one sub-logic is Long and the other is Short, the overall strategy is in a Hedge position. It doesn't matter which component is Short and which is Long.
As PineScript doesn't currently offer a real steady hedging-function for two competing swing trading sub-logics (in the sense of a continuously applied Hedge state after hedging conditions are met at least once for an entry), a workaround via position closes was created for this release. For each new internal sub-signal, the overall strategy changes its state (Long/Short/Hedge) visibly on the chart, and the trader can adjust their position accordingly.
For detailed differences to previous Swing Algo V1.x releases, see further below.
◆ Purpose of this Script
This indicator will give Long, Short and Hedge signals on the chart that can be used for e.g. swing trading. Each of the aforementioned sub-logics uses a combination of several (custom) functions and rules to find good entry points for trend trading. After many iterations and tests I came up with this particular setup, which is highly optimized for the ETH/USD trading pair on the daily (D) timeframe.
Attention was also paid to stability, as all parameters are set onto plateaus, so that smaller changes in the characteristic price action should not affect the efficiancy too much, done as an attempt to reduce overfitting as much as possible. Additionally this dual algorithm system is specifically designed to have a safety net: should for the unlikely scenario one swing trading algorithm not trigger at a certain mid-term reversal point, the probability is high that the other will trigger, resulting in an overall hedged position (so that no money is lost in the meantime) until the first algorithm can rejoin at the next mid-term trend change.
For other assets and/or timeframes it is in principle possible to change algorithmic parameters within the indicator settings to tune the swing algorithms, though it is strongly recommended to use the standard asset and timeframe mentioned above.
◆ Viability
For the here presented backtest data, we omitted the biggest portion of the cryptocurrency bullrun in 2017 (starting only at 1st July 2017) so that the results become more realistic for long-term swing traders (investing at least 2-4 years into trading) if such large runs do not happen again. As cryptocurrencies like Ethereum are still to this date capable of doing comparatively smaller runs of about 2-3x in a few weeks/months during accumulation phases (as witnessed e.g. in 2020 and more recently in 2023) and bigger runs during bullmarkets (as witnessed in 2021), the quality of the shown results is still realistic for long-term trend trading efforts over several years, Note that very conservative trading parameters as mentioned below in "Forwardtesting and Backtesting" are used here.
Generally do not expect results in a matter of days or weeks, and of course as with any trading strategy past performances are not indicative of future results.
◆ Forwardtesting and Backtesting
The individual components have been back- and partially forwardtested: The first sub-logic is an advancement of Swing Algo V1.3, with which we have extensive experience running back to October 2020 for its release, while the secondary control strategy, which was privately published for DeanTrader members as a stand-alone script on TradingView in June 2022 and was running in the background since then, is showing good & expected behaviour so far.
While this does not mean that fowardtesting was performed specifically for the combined Swing Algo V1.4 system we have now (which cannot be done realistically considering the timeframes used, i.e. months and especially years), we can at least look at some considerable experience with the individual components. Then again, as I have implemented an exact hedging-function so that both sub-algorithms run independently from each other, it is not likely to see any unexpected behaviour resulting purely from the combination into one script.
For strategy backtesting you can choose the backtest time interval to test the performance of this algorithm for different time windows and different trading pairs. Here various backtesting parameters (e.g. trading fees) can be customized. Default settings for the shown backtest are a starting balance of $1000, a slippage of 20 ticks (= $0.20) and a trading fee of 0.05 % (which is the worst taker fee on the Kraken Pro futures exchange) to have realistic settings. However as we do not conduct many trades with this strategy, fees should not impact our performance too much. As long-term swing traders, we at DeanTrader generally devote one initial portion of our portfolio to swing trading and from then on always use 100% of this portion for the next trade to get the compounding starting. This is in difference to other trading styles which use various, often very small, percentage values for their short- or mid-term trades. Please note that for the here presented backtest only 10% of compounded equity is used for each successive trade to show an estimation for a lower risk & lower reward approach . Keep this in mind when evaluating the backtest data. You can set appropriate values for each backtest parameter in the "Properties" setting menu of the strategy, including the order size percentage of equity value for your trades. Also note that due to the small number of trades the statistical significance is low. It is not possible to gather an abundance of long-term trend signals in the order of hundreds or thousands trades, as much more time would have to pass for this in the case of rather new assets like Ethereum.
Additionally to the TradingView Strategy Tester you can also plot your equity directly on the chart to get a sense for the performance. For this you can also scale the equity graph to e.g. match the starting point of your equity with some price point on the chart to get a direct comparison to 'Buy & Hold' strategies over time.
This indicator (and all other content I provide) is no financial advice. If you use this indicator you agree to my Terms and Conditions which can be found on my website linked on my TradingView profile or in my signature.
◆ Visual Representation on the Chart
Shown below is a screenshot of how the chart looks like when the strategy is applied. Here we can see two different averaging lines, where each line belongs to one of the two sub-logics respectively. Note that this is not a MA-crossover strategy, and the crossing of the lines is not accounted for in the code at all and therefore has no effect on the strategy's signal output. Also note that the price scale is set on logarithmic.
The space between the lines is filled with a faint background color as a rough visual indicator. Magenta-colored fills indicate zones where only Short or Hedge signals can appear, while green-colored fills indicate zones where only Long or Hedge signals can appear. Gray-colored fills mark zones where only Hedge signals can appear, which also means that Hedge signals can appear in any zone. So treat those background fills more as a visual aid to roughly know what can happen next, but pay most attention to the actual signals (with arrows) that appear on the chart.
◆ Differences to Other Versions
Consists now of two competing sub-algorithms instead of just one algorithm. The new system outputs Long, Short and Hedge signals instead of just Long and Short signals.
The first sub-logic is the spiritual successor of the original Swing Algo V1.3 release, with a modified oscillator part.
The second sub-logic serves as a control algorithm (while still having equal rights in terms of strategy impact), newly introduced to the Swing Algo series, but already forwardtested for roughly a year at time of release.
Lowers risk significantly by diversifying swing trading strategies, so that for the rare scenario of a missed trend on one sub-algorithm, losses are prevented as the overall strategy is hedged during that time.
Lowers risk further as the maximum drawdown of the combined strategy is reduced by roughly 1/3 in comparison to each stand-alone strategy while almost retaining the same net profit over a 6-year backtest compared to the first, leading sub-logic.
No guesswork anymore when to use which short leverage (1x corresponding to a Hedge, or 2x corresponding to a Short with an asset-value-change-to-gain-proportionality of -1) as it is clearly defined within the trading system via the displayed signals. In earlier Swing Algo versions, the short leverage for any particular Short signal had to be chosen by hand dependent on market sentiment, which required further market analysis, or was fixed at 2x, leading to less flexibility.
◆ Access
For access please contact me via DM on TradingView or via other channels (linked on my TradingView profile and in my signature).
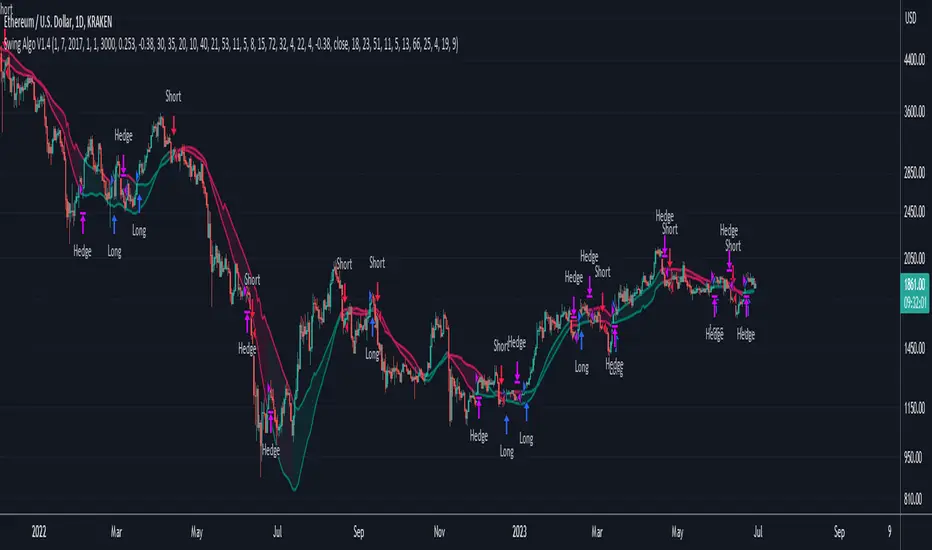
Fetch Buy And Hold StrategyThis script was created as an experiment using ChatGPT. I actually woudn't recommend using the ai program to help you with your Pinescripts, as it makes a fair amount of mistakes. It was a fun experiment however.
The script is a simple buy and hold tool. Here's what it does:
- Everytime the rsi enters below the set treshold, a counter increases.
- The second increase of the counter happens when the price goes above the treshold, and then dips below the treshold again.
- The program would fire off a buy signal when the counter hits the number 3.
- After the buy. the counter will reset.
Lets take a look at the following example where the rsi treshold is 30:
- So the rsi dips below 30 and the initial counter is set from 0 to 1.
- The price rises which brings the rsi back to 40.
- Then another dip happens and the rsi is now 25, increasing the counter from 1 two.
- Rsi now dips to 23 and nothing happens.
- Rsi goes back up to 31, and dips back to 28 which puts the counter at 3. A buy singal is now fired and the counter is set to 0.
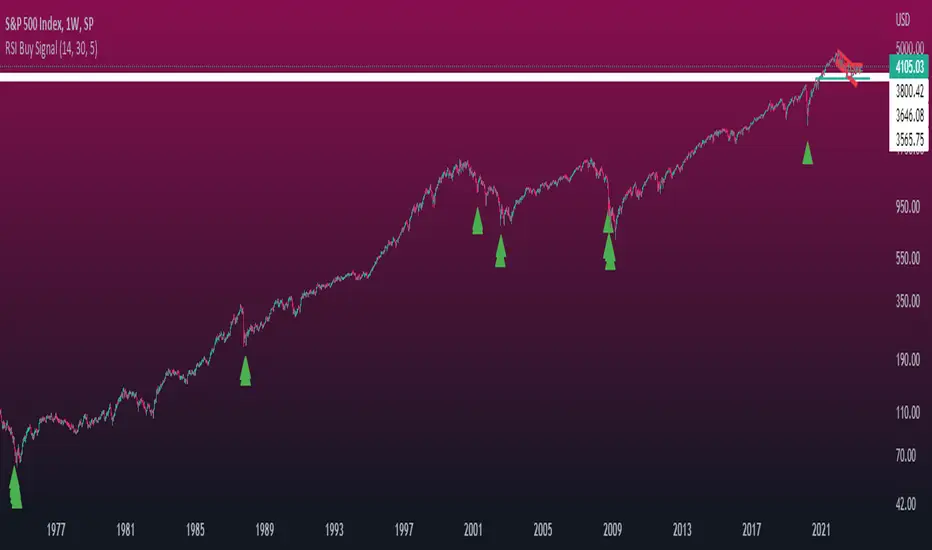
Shiller PE Ratio (CAPE Ratio) [WhaleCrew]Our Implementation of the famous Shiller PE Ratio (aka C yclically A djusted P rice-to- E arnings Ratio) a long-term valuation indicator for the S&P 500.
Calculation: Share price divided by 10 - year average, inflation - adjusted earnings
The indicator works on the M and 12M timeframe and has a built-in moving average that supports an upper and lower bollinger band.