WLI Swing High/Low advnc indicatorfor Class members
else
label.set_xy(lowMsg, bar_index, close)
label.set_text(lowMsg, "making New Low")
label.set_color(lowMsg, newSwingLowColor)
label.set_textcolor(lowMsg, color.white)
else
if not na(lowMsg)
label.delete(lowMsg)
lowMsg := na
Lowerhigh

Absolute ZigZagThis ZigZag Indicator is a bit unique in it's kind.
It uses my own Absolute ZigZag Lib to calculate the pivots:
Instead of using percentages or looking more than 1 bar left or right, this Zigzag library calculates pivots by just looking at the current bar highs and lows and the ones of one bar earlier. This is a very fast and accurate way of calculating pivots.
The library also features a solution for bars that have both a higher high and a higher low like seen below.
You can also use your own colors for the labels and the lines:
You can also quickly select a one-colored theme without changing all colors at once:

Williams Fractals - LH/HLSame of original Williams Fractals, but with the following changes
- changed arrow directions
- added option to show Lower Highs and Higher Lows
- added alerts for Lower High and Higher Low
Enjoy~~

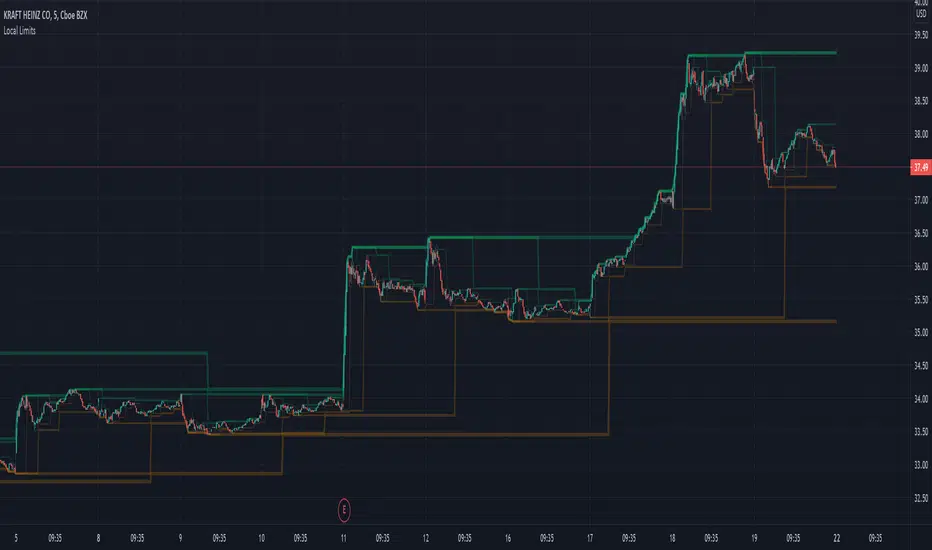
LocalLimitLibrary "LocalLimit"
Calculates the local upper or local lower limit for a given series. Applying multiple passes produces what appears like support or resistance levels.
See Local Limits for more detail.
upper(src) Produces the recent local upper limit for a given series.
Parameters:
src : The source series to derive from.
lower(src) Produces the recent local lower limit for a given series.
Parameters:
src : The source series to derive from.

LH-LL/HL-HH Confirmation Trend LineBased on Dow Theory, a series of successive higher highs (HH) and higher lows (HL) is the sign of an uptrend (bull trend) and a series of successive lower highs (LH) and lower lows (LL) is the sign of a downtrend (bear trend).
So this script indicates the trends using the concept and draws corresponding trend lines.
It took some effort to make it possible for users to see as many trend lines as they wish. Eventually the user could set the number alongside some other options in the indicator settings.
Use the script and send me your thoughts!

Local LimitsDisplays recent higher highs, lower highs, lower lows, and higher lows as a collection of local limit indicators.
In its simplicity is a lot more powerful than might appear at first glance.
Does not rely on volatility calculation.
Can be linked together to create an objective view of recent support and resistance levels.
Makes current trends more visible.
Excellent for use as a trailing stop algorithm.
Parameters
Single Bar Sensitivity: True (default) reacts to individual bars. False only responds to the alignment of 2 bars.
Margin (1-5): Adds extra distance from higher lows and lower highs to reduce the sensitivity of broken trends.
Single indicators with configurable sources:
Local Limit Higher
Local Limit Lower
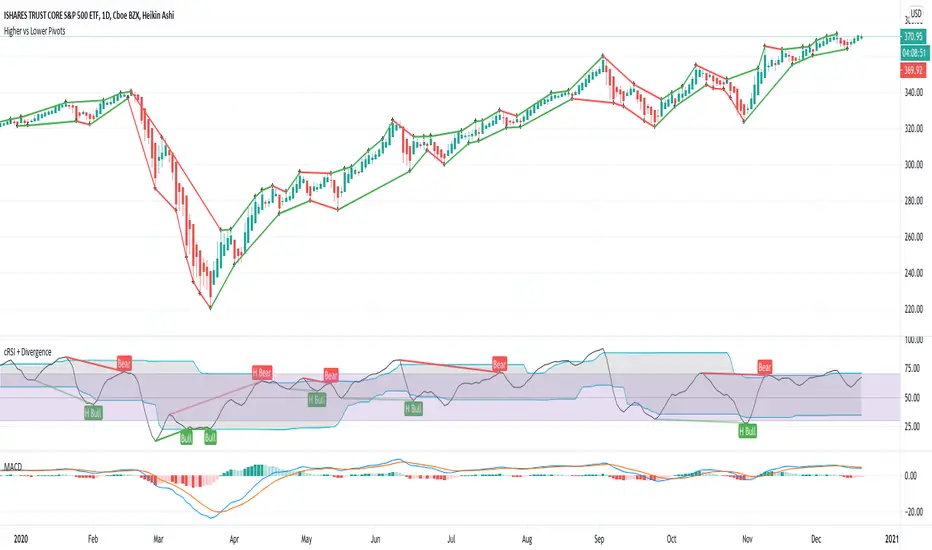
Higher vs Lower Pivots overlayA simple script that I made that draws lines between the high and low pivots. The color of the line define if the pivot is higher or lower than the previous pivot. The main thing to tune is the pivot look back vs look ahead, which are the same params used by the tradingview pivot indicator. There are several other params you can tweaks to get the look you want.
Double Zig Zag with HHLLHello Traders,
Here Double Zig Zag with HHLL script is with you. it calculates 2 Zig Zag simultaneously and draws them, and also it calculates and puts Higher High, Lower Low, Higher Low, Lower High labels. All these are done dynamically, it means last HH/HL/LL/LH can change. if price continues to go up then HL can turn to LL or if price continues to go down then LH can turn to HH. This script can be used for different purposes such trend analysis, support/resistance levels, breakouts etc.
I tried to make many things optional:
You can set Periods for Zig Zags as you wish
You can set different colors for both Zig Zag Up/Down lines
You have option to show both Zig Zag, one of them or none them
You have option to show both HHLL, one of them or none them
You can set Zig Zag 1 line style as Dashed or Dotted
You can set Line Widths for Zig Zags
Some examples:
Enjoy!

Highs & LowsHigh and Lows Script.
For all the price action lovers out there.
Hope you all enjoy.
Thanks

Swing PointsThis indicator gives a clear indication of price action swing-points as well as an indication of whether it is a higher, lower, or equal swing point relative to the last high/low.
