FibRatiosLibrary "FibRatios"
Library with calculation logic for fib retracement, extension and ratios
retracement(a, b, ratio, logScale, precision)
Calculates the retracement for points a, b with given ratio and scale
Parameters:
a : Starting point a
b : Second point b
ratio : Ratio for which we need to calculate retracement c
logScale : Flag to get calculations in log scale. Default is false
precision : rounding precision. If set to netagive number, round_to_mintick is applied. Default is -1
Returns: retracement point c for points a,b with given ratio and scale
retracementRatio(a, b, c, logScale, precision)
Calculates the retracement ratio for points a, b, c with given scale
Parameters:
a : Starting point a
b : Second point b
c : Retracement point. c should be placed between a and b
logScale : Flag to get calculations in log scale. Default is false
precision : rounding precision. If set to netagive number, round_to_mintick is applied. Default is 3
Returns: retracement ratio for points a,b,c on given scale
extension(a, b, c, ratio, logScale, precision)
Calculates the extensions for points a, b, c with given ratio and scale
Parameters:
a : Starting point a
b : Second point b
c : Retracement point. c should be placed between a and b
ratio : Ratio for which we need to calculate extension d
logScale : Flag to get calculations in log scale. Default is false
precision : rounding precision. If set to netagive number, round_to_mintick is applied. Default is -1
Returns: extensoin point d for points a,b,c with given ratio and scale
extensionRatio(a, b, c, d, logScale, precision)
Calculates the extension ratio for points a, b, c, d with given scale
Parameters:
a : Starting point a
b : Second point b
c : Retracement point. c should be placed between a and b
d : Extension point. d should be placed beyond a, c. But, can be with b,c or beyond b
logScale : Flag to get calculations in log scale. Default is false
precision : rounding precision. If set to netagive number, round_to_mintick is applied. Default is 3
Returns: extension ratio for points a,b,c,d on given scale
MATH

HiveLibraryLibrary "HiveLibrary"
: Custom library
RoundDown(number, decimals)
RoundDown() rounds the specified number down to the given number
of decimal places.
Parameters:
number : is the argument for rounding down & decimals is the number of digits after dot
decimals
Returns: return is the rounded down value of the number

JeeSauceScriptsLibrary "JeeSauceScripts"
getupdnvol()
GetTotalUpVolume(upvolume)
Parameters:
upvolume
GetTotalDnVolume(downvolume)
Parameters:
downvolume
GetDelta(totalupvolume, totaldownvolume)
Parameters:
totalupvolume
totaldownvolume
GetMaxUpVolume(upvolume)
Parameters:
upvolume
GetMaxDnVolume(downvolume)
Parameters:
downvolume
Getcvd()
Getcvdopen(cvd)
Parameters:
cvd
Getcvdhigh(cvd, maxvolumeup)
Parameters:
cvd
maxvolumeup
Getcvdlow(cvd, maxvolumedown)
Parameters:
cvd
maxvolumedown
Getcvdclose(cvd, delta)
Parameters:
cvd
delta
CombineData(data1, data2, data3, data4, data5, data6)
Parameters:
data1
data2
data3
data4
data5
data6
FindData(data, find)
Parameters:
data
find

TurntLibraryLibrary "TurntLibrary"
Collection of functions created for simplification/easy referencing. Includes variations of moving averages, length value oscillators, and a few other simple functions based upon HH/LL values.
ma(source, length, type)
Apply a moving average to a float value
Parameters:
source : Value to be used
length : Number of bars to include in calculation
type : Moving average type to use ("SMA","EMA","RMA","WMA","VWAP","SWMA","LRC")
Returns: Smoothed value of initial float value
curve(src, len, lb1, lb2)
Exaggerates curves of a float value designed for use as an exit signal.
Parameters:
src : Initial value to curve
len : Number of bars to include in calculation
lb1 : (Default = 1) First lookback length
lb2 : (Default = 2) Second lookback length
Returns: Curved Average
fragma(src, len, space, str)
Average of a moving average and the previous value of the moving average
Parameters:
src : Initial float value to use
len : Number of bars to include in calculation
space : Lookback integer for second half of average
str : Moving average type to use ("SMA","EMA","RMA","WMA","VWAP","SWMA","LRC")
Returns: Fragmented Average
maxmin(x, y)
Difference of 2 float values, subtracting the lowest from the highest
Parameters:
x : Value 1
y : Value 2
Returns: The +Difference between 2 float values
oscLen(val, type)
Variable Length using a oscillator value and a corresponding slope shape ("Incline",Decline","Peak","Trough")
Parameters:
val : Oscillator Value to use
type : Slope of length curve ("Incline",Decline","Peak","Trough")
Returns: Variable Length Integer
hlAverage(val, smooth, max, min, type, include)
Average of HH,LL with variable lengths based on the slope shape ("Incline","Decline","Trough") value relative to highest and lowest
Parameters:
val : Source Value to use
smooth
max
min
type
include : Add "val" to the averaging process, instead of more weight to highest or lowest value
Returns: Variable Length Average of Highest Lowest "val"
pct(val)
Convert a positive float / price to a percentage of it's highest value on record
Parameters:
val : Value To convert to a percentage of it's highest value ever
Returns: Percentage
hlrange(x, len)
Difference between Highest High and Lowest Low of float value
Parameters:
x : Value to use in calculation
len : Number of bars to include in calculation
Returns: Difference
midpoint(x, len, smooth)
The average value of the float's Highest High and Lowest Low in a number of bars
Parameters:
x : Value to use in calculation
len
smooth : (Default=na) Optional smoothing type to use ("SMA","EMA","RMA","WMA","VWAP","SWMA","LRC")
Returns: Midpoint
BinaryInsertionSortLibrary "BinaryInsertionSort"
Library containing functions which can help create sorted array based on binary insertion sort.
This sorting will be quicker than array.sort function if the sorting needs to be done on every bar and the size of the array is comparatively big.
This is created with the intention of using this to solve a bigger problem posted by @lejmer. Wish me luck!!
binary_insertion_sort(sortedArray, item, order)
binary insertion sort - inserts item into sorted array while maintaining sort order
Parameters:
sortedArray : array which is assumed to be sorted in the requested order
item : float|int item which needs to be inserted into sorted array
order : Sort order - positive number means ascending order whereas negative number represents descending order
Returns: int index at which the item is inserted into sorted array
update_sort_indices(sortIndices, newItemIndex)
adds the sort index of new item added to sorted array and also updates existing sort indices.
Parameters:
sortIndices : array containing sort indices of an array.
newItemIndex : sort index of new item added to sorted array
Returns: void
get_array_of_series(item, order)
Converts series into array and sorted array.
Parameters:
item : float|int series
order : Sort order - positive number means ascending order whereas negative number represents descending order
Returns:
get_sorted_arrays(item, order)
Converts series into array and sorted array. Also calculates the sort order of the value array
Parameters:
item : float|int series
order : Sort order - positive number means ascending order whereas negative number represents descending order
Returns:
Slope_TKLibrary "Slope_TK"
This library calculate the slope of a serie between two points
The serie can be ta.ema(close,200) for example
The size is the number of bars between the two points for the slope calculation, for example it can be 10
slope_of_ema200 = slope(t a.eam(close, 200) , 10 )
slope( float serie, int size )
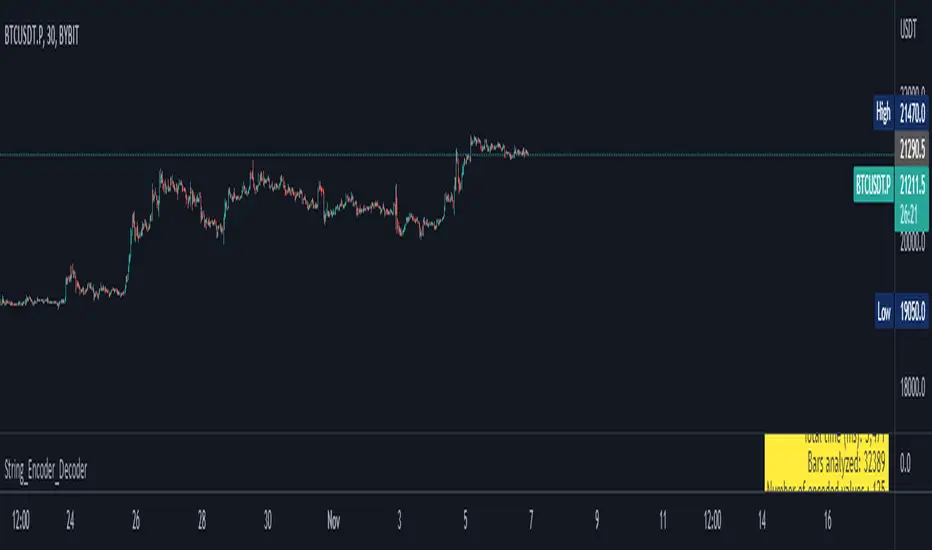
String_Encoder_DecoderLibrary "String_Encoder_Decoder"
String encoder and decoder to use in internal data tranfer in script calculations.
In example, script encode 125 values once and then decode them every candle.
encode(array or values (val1,val2,val3,val4,val5,val6)
encode: encode some values into string
Parameters:
array : of values or values1, value2 (up to 6 values)
(input values must be stringified)
Returns: encoded value
decode(val)
decode: decode into string
Parameters:
val : value to decode, must be stringified
Returns: decoded array of stringified values
fast_utilsLibrary "fast_utils"
This library contains my favourite functions. Will be updated frequently
count_int_digits()
Count int digits in number
Returns: : number of int digits in number
count_float_digits()
Count float digits in number
Returns: : number of float digits in number
stringify()
Convert values in array or matrix into string values
Returns: : array or matrix of string values
arrcompare()
Compare values in arrays
Returns: : bool value
arrdedup()
Remove duplicate values in array
Returns: : array without duplicates
ResInMins()
Converts current resolution in minutes
Returns: : return float number of minuted
MultOfRes(res, mult)
Convert current float TF in minutes to target string TF in "timeframe.period" format.
Parameters:
res : : current resolution in minutes
mult : : Multiple of current TF to be calculated.
Returns: : timeframe format string

fractionLibrary "fraction"
Fraction Creation and Basic Operations.
Cracked a tough problem in making this Polarity Agnostic Decimal without a cheating "abs * sign of input".
it's quite fast, however still test for errors before production use.
>> Big Neon Sign on 1/0 value. <<
Int Array (LOC 0/1)..
To/From Decimal(float)
Comparison ( < / == / >)
Add / Sub / Mult / Div
Invert polarity +/-
String output with 2 formats ..
make(_numerator, _denominator, _val)
Parameters:
_numerator : (int) above the line integer ie: ____ of (___ / bottom )
_denominator : (int) below the line integer ie: ____ of (top / ______ )
_val : (int) OPTIONAL (for no real reason including it) integer to multiply
Returns: array where index 0 is Numerator, 1 is Denominator
add(_fraction, _fraction2)
Perform add operation (left adds right onto )
Parameters:
_fraction : (array) left side Fraction Object
_fraction2 : (array) right side Fraction Object
Returns: array where index 0 is Numerator, 1 is Denominator
subtract(_fraction, _fraction2)
Perform subtract operation (left subtracts right from )
Parameters:
_fraction : (array) left side Fraction Object
_fraction2 : (array) right side Fraction Object
Returns: array where index 0 is Numerator, 1 is Denominator
multiply(_fraction, _fraction2)
Perform multiply operation (left multiplies by right )
Parameters:
_fraction : (array) left side Fraction Object
_fraction2 : (array) right side Fraction Object
Returns: array where index 0 is Numerator, 1 is Denominator
divide(_fraction, _fraction2)
Perform divide operation (left divides by right )
Parameters:
_fraction : (array) left side Fraction Object
_fraction2 : (array) right side Fraction Object
Returns: array where index 0 is Numerator, 1 is Denominator
negative(_fraction)
Perform Negative number inversion ie: (-1/2 => 1/2) or (3/5 => -3/5)
Parameters:
_fraction : (array) Fraction Object to invert to/from negative
Returns: array where index 0 is Numerator, 1 is Denominator
isSmaller(_fraction, _fraction2)
Check if first fraction is smaller
Parameters:
_fraction : (array) left side Fraction Object
_fraction2 : (array) right side Fraction Object
Returns: True if smaller, false if bigger
isLarger(_fraction, _fraction2)
Check if first fraction is larger
Parameters:
_fraction : (array) left side Fraction Object
_fraction2 : (array) right side Fraction Object
Returns: True if smaller, false if bigger
isEqual(_fraction, _fraction2)
Check if first fraction is equal
Parameters:
_fraction : (array) left side Fraction Object
_fraction2 : (array) right side Fraction Object
Returns: True if smaller, false if bigger
fromDec(_input, _epsilon, _iterations)
Convert Decimal to Fraction array
note : this is my own Negative Number Capable (tiny speed loss)
adaptation of the fastest algo out there
Exclusive for Tradingview.
Parameters:
_input : (float) Decimal Input
_epsilon : (int) (OPTIONAL) to precision 0's after dec 0.0000 -> epsilon 0's
_iterations : (int) (OPTIONAL) Maximum iterations Till give up
Returns: array where index 0 is Numerator, 1 is Denominator
toDec()
Convert Fraction to Decimal Output
Returns: Float of fration
toString(_fraction)
Create "A/B" or "A and B/C" String Value of Fraction.
Parameters:
_fraction : (array) Fraction Object to invert to/from negative
Returns: String as (-)? A and B/C format

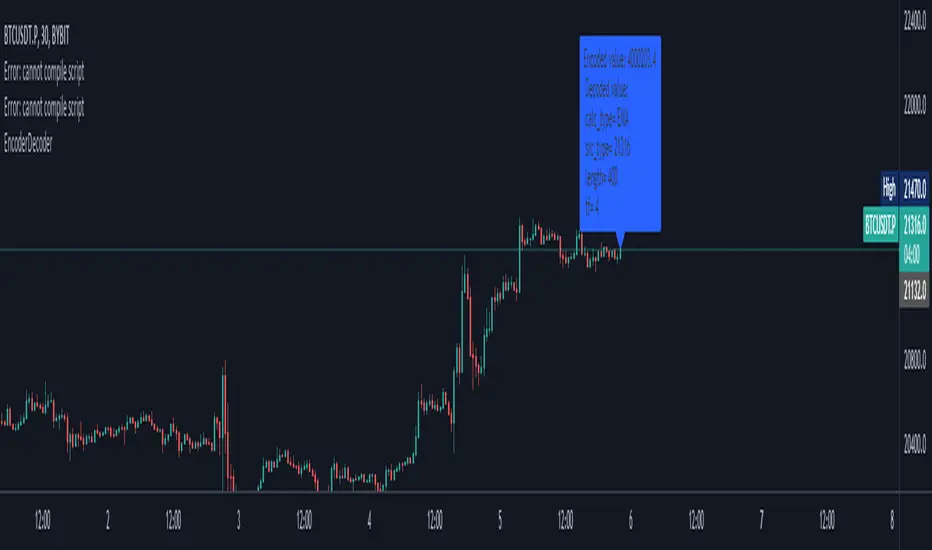
Encoder DecoderLibrary "EncoderDecoder"
Simple example how to encode some values into float number and then decode it back to original values
f_calctype()
Encode parameter
Returns: encoded value
f_calctype()
Decode parameter
Returns: decoded value
f_srctype()
Encode parameter
Returns: encoded value
f_srctype()
Decode parameter
Returns: decoded value
f_encode(calc_type, src_type, tf, length)
Encodes 4 paramters into float number
Parameters:
calc_type : 1st paramter to encode (its values defined in f_calctype functions) max number of values that can be encoded = 100
src_type : 2nd paramter to encode (its values defined in f_src_type functions) max number of values that can be encoded = 100
tf : 3rd paramter to encode (may be int number with format.price precision length!)
length : 4th paramter to encode (may be any int number)
Returns: float number
f_decode()
Decodes 4 paramters into tuple
Returns: tuple
kNNLibrary "kNN"
Collection of experimental kNN functions. This is a work in progress, an improvement upon my original kNN script:
The script can be recreated with this library. Unlike the original script, that used multiple arrays, this has been reworked with the new Pine Script matrix features.
To make a kNN prediction, the following data should be supplied to the wrapper:
kNN : filter type. Right now either Binary or Percent . Binary works like in the original script: the system stores whether the price has increased (+1) or decreased (-1) since the previous knnStore event (called when either long or short condition is supplied). Percent works the same, but the values stored are the difference of prices in percents. That way larger differences in prices would give higher scores.
k : number k. This is how many nearest neighbors are to be selected (and summed up to get the result).
skew : kNN minimum difference. Normally, the prediction is done with a simple majority of the neighbor votes. If skew is given, then more than a simple majority is needed for a prediction. This also means that there are inputs for which no prediction would be given (if the majority votes are between -skew and +skew). Note that in Percent mode more profitable trades will have higher voting power.
depth : kNN matrix size limit. Originally, the whole available history of trades was used to make a prediction. This not only requires more computational power, but also neglects the fact that the market conditions are changing. This setting restricts the memory matrix to a finite number of past trades.
price : price series
long : long condition. True if the long conditions are met, but filters are not yet applied. For example, in my original script, trades are only made on crossings of fast and slow MAs. So, whenever it is possible to go long, this value is set true. False otherwise.
short : short condition. Same as long , but for short condition.
store : whether the inputs should be stored. Additional filters may be applied to prevent bad trades (for example, trend-based filters), so if you only need to consult kNN without storing the trade, this should be set to false.
feature1 : current value of feature 1. A feature in this case is some kind of data derived from the price. Different features may be used to analyse the price series. For example, oscillator values. Not all of them may be used for kNN prediction. As the current kNN implementation is 2-dimensional, only two features can be used.
feature2 : current value of feature 2.
The wrapper returns a tuple: [ longOK, shortOK ]. This is a pair of filters. When longOK is true, then kNN predicts a long trade may be taken. When shortOK is true, then kNN predicts a short trade may be taken. The kNN filters are returned whenever long or short conditions are met. The trade is supposed to happen when long or short conditions are met and when the kNN filter for the desired direction is true.
Exported functions :
knnStore(knn, p1, p2, src, maxrows)
Store the previous trade; buffer the current one until results are in. Results are binary: up/down
Parameters:
knn : knn matrix
p1 : feature 1 value
p2 : feature 2 value
src : current price
maxrows : limit the matrix size to this number of rows (0 of no limit)
Returns: modified knn matrix
knnStorePercent(knn, p1, p2, src, maxrows)
Store the previous trade; buffer the current one until results are in. Results are in percents
Parameters:
knn : knn matrix
p1 : feature 1 value
p2 : feature 2 value
src : current price
maxrows : limit the matrix size to this number of rows (0 of no limit)
Returns: modified knn matrix
knnGet(distance, result)
Get neighbours by getting k results with the smallest distances
Parameters:
distance : distance array
result : result array
Returns: array slice of k results
knnDistance(knn, p1, p2)
Create a distance array from the two given parameters
Parameters:
knn : knn matrix
p1 : feature 1 value
p2 : feature 2 value
Returns: distance array
knnSum(knn, p1, p2, k)
Make a prediction, finding k nearest neighbours and summing them up
Parameters:
knn : knn matrix
p1 : feature 1 value
p2 : feature 2 value
k : sum k nearest neighbors
Returns: sum of k nearest neighbors
doKNN(kNN, k, skew, depth, price, long, short, store, feature1, feature2)
execute kNN filter
Parameters:
kNN : filter type
k : number k
skew : kNN minimum difference
depth : kNN matrix size limit
price : series
long : long condition
short : short condition
store : store the supplied features (if false, only checks the results without storage)
feature1 : feature 1 value
feature2 : feature 2 value
Returns: filter output

fibo_levelsLibrary "Fibo_levels"
Calculate Fibo levels from any 2 levels. Your need know only 2 price of 2 levels for calculate any level of Fibo: function 'fibo_lvl',
or calculate array of price Fibo levels : function 'fibo_lvls'
fibo_lvl(fibo_lvl1, price1, fibo_lvl2, price2, calc_level)
Parameters:
fibo_lvl1 : First of any level of fibo from 0 to 1 (example 0.236)
price1 : Price for 1th any level (example 2356.1)
fibo_lvl2 : Second of any level of fibo from 0 to 1 (example 0.382)
price2 : Price for 2th any level (example 2497.4)
calc_level : Price for level to calculate (example 0.5)
Returns: return price for calc_level fibo
fibo_lvls(bars, time1, time2, fibo_lvl1, price1, fibo_lvl2, price1)
Parameters:
fibo_lvl1 : First of any level of fibo from 0 to 1 (example 0.236)
price1 : Price for 1th any level (example 2356.1)
fibo_lvl2 : Second of any level of fibo from 0 to 1 (example 0.382)
price1 : Price for 2th any level (example 2497.4)
Returns: array of price for fibo levels : (0.0, 0.118, 0.236, 0.384, 0.5, 0.618, 0.786, 1.0, 1.27,-0.27,1.618,-0.618)

LibIndicadoresUteisLibrary "LibIndicadoresUteis"
Collection of useful indicators. This collection does not do any type of plotting on the graph, as the methods implemented can and should be used to get the return of mathematical formulas, in a way that speeds up the development of new scripts. The current version contains methods for stochastic return, slow stochastic, IFR, leverage calculation for B3 futures market, leverage calculation for B3 stock market, bollinger bands and the range of change.
estocastico(PeriodoEstocastico)
Returns the value of stochastic
Parameters:
PeriodoEstocastico : Period for calculation basis
Returns: Float with the stochastic value of the period
estocasticoLento(PeriodoEstocastico, PeriodoMedia)
Returns the value of slow stochastic
Parameters:
PeriodoEstocastico : Stochastic period for calculation basis
PeriodoMedia : Average period for calculation basis
Returns: Float with the value of the slow stochastic of the period
ifrInvenenado(PeriodoIFR, OrigemIFR)
Returns the value of the RSI/IFR Poisoned of Guima
Parameters:
PeriodoIFR : RSI/IFR period for calculation basis
OrigemIFR : Source of RSI/IFR for calculation basis
Returns: Float with the RSI/IFR value for the period
calculoAlavancagemFuturos(margem, alavancagemMaxima)
Returns the number of contracts to work based on margin
Parameters:
margem : Margin for contract unit
alavancagemMaxima : Maximum number of contracts to work
Returns: Integer with the number of contracts suggested for trading
calculoAlavancagemAcoes(alavancagemMaxima)
Returns the number of batches to work based on the margin
Parameters:
alavancagemMaxima : Maximum number of batches to work
Returns: Integer with the amount of lots suggested for trading
bandasBollinger(periodoBB, origemBB, desvioPadrao)
Returns the value of bollinger bands
Parameters:
periodoBB : Period of bollinger bands for calculation basis
origemBB : Origin of bollinger bands for calculation basis
desvioPadrao : Standard Deviation of bollinger bands for calculation basis
Returns: Two-position array with upper and lower band values respectively
theRoc(periodoROC, origemROC)
Returns the value of Rate Of Change
Parameters:
periodoROC : Period for calculation basis
origemROC : Source of calculation basis
Returns: Float with the value of Rate Of Change
BpaLibrary "Bpa"
TODO: library of Brooks Price Action concepts
isBreakoutBar(atr, high, low, close, open, tail, size)
TODO: check if the bar is a breakout based on the specified conditions
Parameters:
atr : TODO: atr value
high : TODO: high price
low : TODO: low price
close : TODO: close price
open : TODO: open price
tail : TODO: decimal value for a percent that represent the size of the tail of the bar that cant be preceeded to be considered strong close
size : TODO: decimal value for a percent that represents by how much the breakout bar should be bigger than others to be considered one
Returns: TODO: boolean value, true if breakout bar, false otherwise
TradingWolfLibaryLibrary "TradingWolfLibary"
getMA(int, string)
Gets a Moving Average based on type
Parameters:
int : length The MA period
string : maType The type of MA
Returns: A moving average with the given parameters
minStop(float, simple, float, string)
Calculates and returns Minimum stop loss
Parameters:
float : entry price (Close if calculating on the entry candle)
simple : int Calculate how many bars back to look at swings
float : Minimum Stop Loss allowed (Should be x 0.01) if input
string : Direciton of trade either "Long" or "Short"
Returns: Stop Loss Value

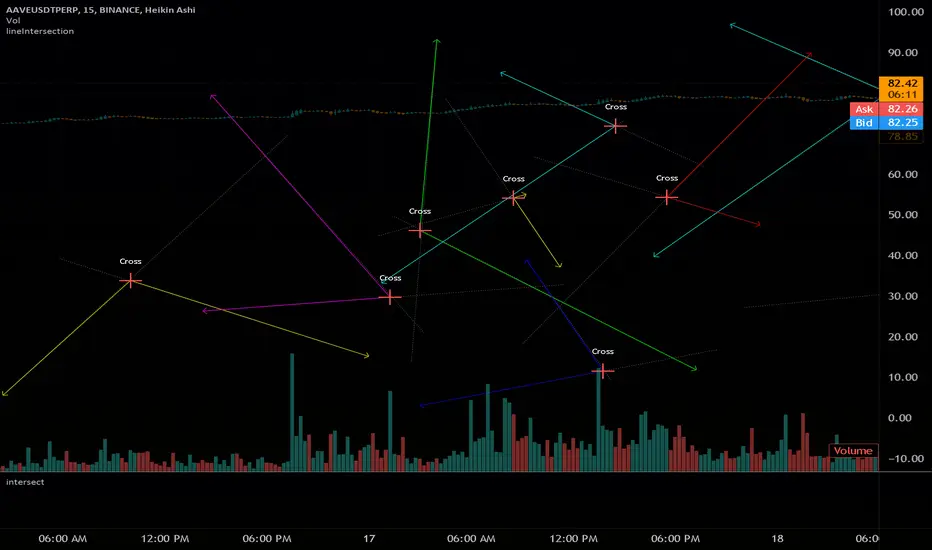
intersectLibrary "intersect"
Find Line Intersection X/Y coordinates.
Simple to use, will find intersection if it exists on the segments
if the line segments do not cross on segment, an 'na' value will be returned
if you plot new items with the output coords, they still plot.
avoid this by setting a na(x) condition before plotting new items
get(l1, l2, ( optional _round) )
line intersection coordinates
Parameters:
l1 : (line) first line
l2 : (line) second line
_round : True to make an INT for plotting
if not used, will not round ( overload loophole)
Returns: with x as int if bool is used
na_skip_highestLibrary "na_skip_highest"
Finds the highest historic value over len bars but skip na valued bars (eg, off days). In other words, this will ensure we find the highest value over len bars with a real value, and if there are any na bars in-between, we skip over but the loop will continue. This allows to mimic calculations on markets with off days (eg, weekends).
na_skip_highest(src, len)
Finds the highest historic value over len bars but skip na valued bars (eg, off days). In other words, this will ensure we find the highest value over len bars with a real value, and if there are any na bars in-between, we skip over but the loop will continue. This allows to mimic calculations on markets with off days (eg, weekends).
Parameters:
src : series float source (eg, close)
len : int length, number of recent bars to consider in the window to find the highest value
Returns: highest float highest value found over the len window
KernelFunctionsLibrary "KernelFunctions"
This library provides non-repainting kernel functions for Nadaraya-Watson estimator implementations. This allows for easy substitution/comparison of different kernel functions for one another in indicators. Furthermore, kernels can easily be combined with other kernels to create newer, more customized kernels. Compared to Moving Averages (which are really just simple kernels themselves), these kernel functions are more adaptive and afford the user an unprecedented degree of customization and flexibility.
rationalQuadratic(_src, _lookback, _relativeWeight, _startAtBar)
Rational Quadratic Kernel - An infinite sum of Gaussian Kernels of different length scales.
Parameters:
_src : The source series.
_lookback : The number of bars used for the estimation. This is a sliding value that represents the most recent historical bars.
_relativeWeight : Relative weighting of time frames. Smaller values result in a more stretched-out curve, and larger values will result in a more wiggly curve. As this value approaches zero, the longer time frames will exert more influence on the estimation. As this value approaches infinity, the behavior of the Rational Quadratic Kernel will become identical to the Gaussian kernel.
_startAtBar : Bar index on which to start regression. The first bars of a chart are often highly volatile, and omitting these initial bars often leads to a better overall fit.
Returns: yhat The estimated values according to the Rational Quadratic Kernel.
gaussian(_src, _lookback, _startAtBar)
Gaussian Kernel - A weighted average of the source series. The weights are determined by the Radial Basis Function (RBF).
Parameters:
_src : The source series.
_lookback : The number of bars used for the estimation. This is a sliding value that represents the most recent historical bars.
_startAtBar : Bar index on which to start regression. The first bars of a chart are often highly volatile, and omitting these initial bars often leads to a better overall fit.
Returns: yhat The estimated values according to the Gaussian Kernel.
periodic(_src, _lookback, _period, _startAtBar)
Periodic Kernel - The periodic kernel (derived by David Mackay) allows one to model functions that repeat themselves exactly.
Parameters:
_src : The source series.
_lookback : The number of bars used for the estimation. This is a sliding value that represents the most recent historical bars.
_period : The distance between repititions of the function.
_startAtBar : Bar index on which to start regression. The first bars of a chart are often highly volatile, and omitting these initial bars often leads to a better overall fit.
Returns: yhat The estimated values according to the Periodic Kernel.
locallyPeriodic(_src, _lookback, _period, _startAtBar)
Locally Periodic Kernel - The locally periodic kernel is a periodic function that slowly varies with time. It is the product of the Periodic Kernel and the Gaussian Kernel.
Parameters:
_src : The source series.
_lookback : The number of bars used for the estimation. This is a sliding value that represents the most recent historical bars.
_period : The distance between repititions of the function.
_startAtBar : Bar index on which to start regression. The first bars of a chart are often highly volatile, and omitting these initial bars often leads to a better overall fit.
Returns: yhat The estimated values according to the Locally Periodic Kernel.
ahpuhelperLibrary "ahpuhelper"
Helper Library for Auto Harmonic Patterns UltimateX. It is not meaningful for others. This is supposed to be private library. But, publishing it to make sure that I don't delete accidentally. Some functions may be useful for coders.
insert_open_trades_table_column(showOpenTrades, table_id, column, colors, values, intStatus, harmonicTrailingStartState, lblSizeOpenTrades)
add data to open trades table column
Parameters:
showOpenTrades : flag to show open trades table
table_id : Table Id
column : refers to pattern data
colors : backgroud and text color array
values : cell values
intStatus : status as integer
harmonicTrailingStartState : trailing Start state as per configs
lblSizeOpenTrades : text size
Returns: nextColumn
populate_closed_stats(ClosedStatsPosition, bullishCounts, bearishCounts, bullishRetouchCounts, bearishRetouchCounts, bullishSizeMatrix, bearishSizeMatrix, bullishRR, bearishRR, allPatternLabels, flags, rowMain, rowHeaders)
populate closed stats for harmonic patterns
Parameters:
ClosedStatsPosition : Table position for closed stats
bullishCounts : Matrix containing bullish trade stats
bearishCounts : Matrix containing bearish trade stats
bullishRetouchCounts : Matrix containing bullish trade stats for those which retouched entry
bearishRetouchCounts : Matrix containing bearish trade stats for those which retouched entry
bullishSizeMatrix : Matrix containing data about size of bullish patterns
bearishSizeMatrix : Matrix containing data about size of bearish patterns
bullishRR : Matrix containing Risk Reward data of bullish patterns
bearishRR : Matrix containing Risk Reward data of bearish patterns
allPatternLabels : array containing pattern labels
flags : display flags
rowMain : Pattern header data
rowHeaders : header grouping data
Returns: void
get_rr_details(patternTradeDetails, harmonicTrailingStartState, disableTrail, breakEvenTrail)
calculate and return risk reward based on targets and stops
Parameters:
patternTradeDetails : array containing stop, entry and targets
harmonicTrailingStartState : trailing point
disableTrail : If set, ignores trailing point
breakEvenTrail : If set, trailing does not go beyond breakeven.
Returns: nextColumn

fastlog2Library "fastlog2"
Description:
Returns the approximation of Log2 with the maximal error of: 0.000061011436
Reference:
www.anycodings.com
fastlog2(x)
Returns the approximation of Log2 with the maximal error of: 0.000061011436
Parameters:
x : float
Returns: float, log2 of x

combinLibrary "combin"
Description:
The combin function is a the combination function
as it calculates the number of possible combinations for two given numbers.
This function takes two arguments: the number and the number_chosen.
For example, if the number is 5 and the number chosen is 1,
there are 5 combinations, giving 5 as a result.
Reference:
ideone.com
support.microsoft.com
combin(n, kin)
Returns the number of combinations for a given number of items. Use to determine the total possible number of groups for a given number of items.
Parameters:
n : int, The number of items.
kin : int, The number of items in each combination.
Returns: int.

FibonacciLibrary "Fibonacci"
General Fibonacci functions. Get fib numbers, ratios, etc.
fib_precise(f, precision)
Get the precise Fibonacci ratio, to the specified number of decimal places
Parameters:
f : Fibonacci ratio (string, in form #.###)
precision : Number of decimal places (optional int, dft = 16, max = 32)
Returns: Precise Fibonacci ratio (float)
fib_n(n)
Calculate the Nth number in the Fibonacci sequence
Parameters:
n : Index/number in sequence (int)
Returns: Fibonacci number (int)
TrigLibrary "Trig"
Trigonometric functions
rt_get_angleAlpha(a, b, c, deg)
Get angle α of a right triangle, given the lengths of its sides
Parameters:
a : length of leg a (float)
b : length of leg b (float)
c : length of hypotenuse (float)
deg : flag to return angle in degrees (bool - default = false)
Returns: angle α in radians (or degrees if deg == true)
rt_get_angleAlphaFromLine(x1, y1, x2, y2, l, deg)
Get angle α of a right triangle formed by the given line
Parameters:
x1 : x coordinate 1 (int - optional, required if argument l is not specified)
y1 : y coordinate 1 (float - optional, required if argument l is not specified)
x2 : x coordinate 2 (int - optional, required if argument l is not specified)
y2 : y coordinate 2 (float - optional, required if argument l is not specified)
l : line object (line - optional, required if x1, y1, x2, and y2 agruments are not specified)
deg : flag to return angle in degrees (bool - default = false)
Returns: angle α in radians (or degrees if deg == true)
rt_get_angleBeta(a, b, c, deg)
Get angle β of a right triangle, given the lengths of its sides
Parameters:
a : length of leg a (float)
b : length of leg b (float)
c : length of hypotenuse (float)
deg : flag to return angle in degrees (bool - default = false)
Returns: angle β in radians (or degrees if deg == true)
rt_get_angleBetaFromLine(x1, y1, x2, y2, l, deg)
Get angle β of a right triangle formed by the given line
Parameters:
x1 : x coordinate 1 (int - optional, required if argument l is not specified)
y1 : y coordinate 1 (float - optional, required if argument l is not specified)
x2 : x coordinate 2 (int - optional, required if argument l is not specified)
y2 : y coordinate 2 (float - optional, required if argument l is not specified)
l : line object (line - optional, required if x1, y1, x2, and y2 agruments are not specified)
deg : flag to return angle in degrees (bool - default = false)
Returns: angle β in radians (or degrees if deg == true)