Measure Volume, Momentum, Trend, VolatilityThis script displays the following indicators in one pane to quickly determine several important factors regarding price action. It allows the user to quickly see all of most important factors surrounding price action in one pane with one quick glance. This should be incredibly helpful and allow things like double divergence and trend confirmation to be spotted much more quickly. I personally use the data in this indicator to replace four separate indicators and it has brought my win rate and profit factor significantly higher. I hadn't seen any place where all of the best J. Welles Wilder indicators such as RSI, Parabolic SAR, and DMI/ADX were brought into one easy to use interface. This is my attempt at fixing that gap. For a much deeper understanding of how to use these indicators, I recommend reading New Concepts in Technical Trading Systems written by J. Welles Wilder.
Momentum via RSI (Relative Strength Index)
Volume via MFI (Money Flow Index)
Volatility via DMI/ADX (Direction Movement Index/Average Directional Index)
Trend via Parabolic SAR (Parabolic Stop and Reverse)
It is worth noting that DMI/ADX and Parabolic SAR can both help determine trend strength and volatility.
The Volatility mechanism is measured by DMI and ADX and displayed at the top of the pane using circles. The top, tiny circles reflect if show if positive DI or negative DI has a higher value. The small circles directly underneath indicate whether or not the ADX is above 20 (configurable, some may choose to increase this to 25 or even 30).
The Momentum mechanism is shown as standard RSI with the default being a white line and default period of 14, which is all configurable.
The Volume mechanism is shown as standard MFI with the default being a fuchsia line and default period of 14, which is also configurable.
The momentum and volume oscillators should be used in conjunction to help spot whether the trend is strong or weak using divergences and the middle, overbought, and oversold levels. These levels are also configurable.
The Trend mechanism is measured by Parabolic SAR and displayed at the bottom of the pane using diamonds. The default is red diamonds when in a bear trend, green when in an uptrend which is configurable. When price is above the Parabolic SAR, it is considered to be an uptrend. When price is below the Parabolic SAR, it is considered to be a downtrend. The way price is measured is also configurable (i.e. open, close, ohlc4, hlc3, etc.). When price crossed above or below the Parabolic SAR, the diamonds will change colors.
All the indicators displayed should be used in a well rounded strategy. For instance, I only trade when ADX is above 20 and rarely trade against the trend shown via PSAR. When trend shifts and divergences helped indicate a trend shift would occur using the RSI and MFI, it can be a great spot to take an entry. RSI/MFI can also confirm the trend is strong when they are not showing divergences and inline with price action. All of this data should be used in conjunction with good fundamental data and technical levels. Divergences with RSI and MFI on double tops or bottoms can also be incredibly powerful. There is no right or wrong way to use all the data displayed in this indicator, however using all four pillars of trading (Momentum, Volume, Trend, Volatility) will help ensure only the best trades are taken.
MFI

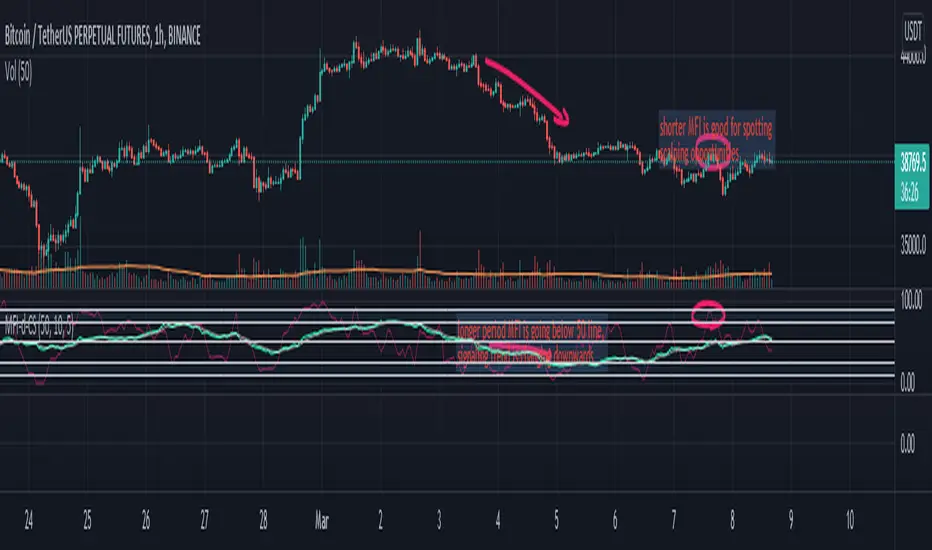
Money Flow Index (double) by CoinStaghey Piners community,
this is an iteration of inbuilt MFI script, with two MFIs of different lengths and one Moving Average which is dependent on MFI 1.
I find it useful to see the trend of longer MFI period, which tells me what direction to trade. On shorter period MFI I'm looking at Oversold or Overbought zones - while quicker MFI index is there, I'm looking to Buy/Sell, depending on trend.
Alternatively, you can use also MFI1 and MA crossovers to spot potential entries.
It seems like a good tool for crypto markets on any timeframes - from 5min, to 4h.
Compound IndicatorThis is an indicator finds end points of short term market trends. this is a combination of many indicators such as
1. Volume change oscillator
2. Money flow index (MFI)
3. Momentum Oscillator (MOM)
4. Stochastic Indicator
6. Relative Strength Indicator (RSI)
7. Relative volatility index (RVI)
8. Balance of power (BOP)
9. Small moving average (SMA)
10. Exponential moving average (EMA)
11. Parabolic SAR
12. Super trend indicator
this script forms a compound indicator after analysing movements of those indicators through different time frames and measure its co-relation and variance with the price action. buy doing that, indicator in a position to identify short term market reversals and presented.

Buy / Sell alert indicator [Crypto_BCT]Hello everyone!
I bring to your attention a indicator to determine the point of buy and sell purchase.
It is based on oscillators and a moving average.
It can be used to work with bots, for example 3COMMAS DCA bot.
Signal Condition Settings:
ATR
The current candle is larger than the ATR for this period
EMA
The signal is necessarily below (for buy) and above (for sell) the EMA of the specified period
(Buy) RSI low
The RSI index is below this value
(Sell) RSI High
The RSI index is higher than this value
(Buy) MFI low
The MFI index is below this value
(Sell) MFI High
The MFI index is higher than this value
(Buy) CCI low
CCI index is below this value
(Sell) CCI High
The CCI index is higher than this value
(Buy) Lowest bar from
The closing of the current bar is lower than the closing of the bars back in this range
(Sell) Highest bar from
The closing of the current bar is higher than the closing of bars in this range
(Buy) Lowest EMA bar ago
During a given distance back, the EMA value only decreased
(Sell) Highest EMA bar ago
At a given distance back, the EMA value only increased
I hope it will be useful!

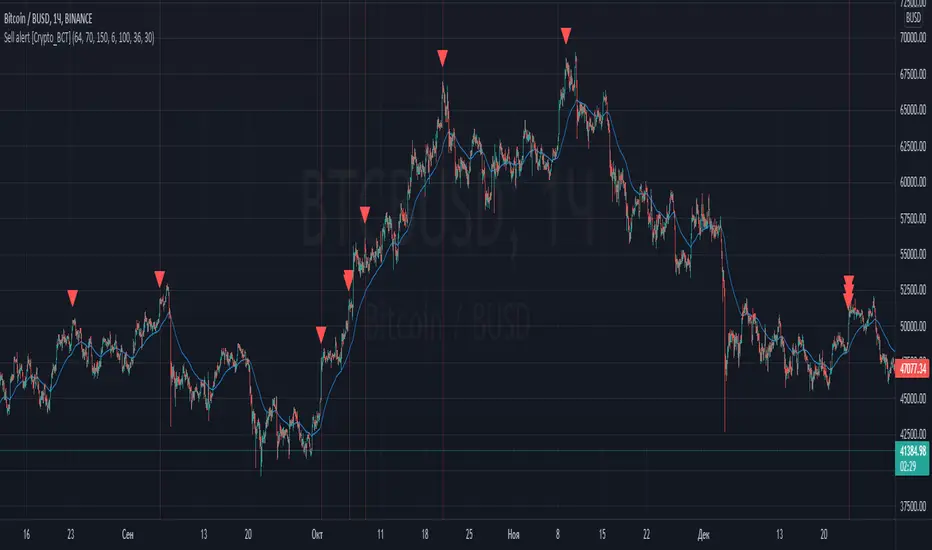
Sell alert [Crypto_BCT]Hello everybody!
I bring to your attention an indicator for determining the point of sell.
It is based on oscillators and a moving average.
Signal Condition Settings:
ATR
The current candle is larger than the ATR for this period
EMA
The signal must be above the EMA of the specified period
MFI High
The MFI index is higher than this value
CCI High
The CCI index is higher than this value
RSI High
The RSI index is higher than this value
Highest bar from
The closing of the current bar is higher than the closing of bars in this range
Highest EMA bar ago
At a given distance back, the EMA value only increased
I hope it will be useful!
Buy alert [Crypto_BCT]Hello everyone!
I bring to your attention a simple indicator to determine the point of purchase.
It is based on oscillators and a moving average.
It can be used to work with bots, for example 3COMMAS DCA bot.
Signal Condition Settings:
ATR
The current candle is larger than the ATR for this period
EMA
The signal is necessarily below the EMA of the specified period
MFI low
The MFI index is below this value
CCI low
CCI index is below this value
RSI low
The RSI index is below this value
Lowest bar from
The closing of the current bar is lower than the closing of the bars back in this range
Lowest EMA bar ago
During a given distance back, the EMA value only decreased
I hope it will be useful!

Williams %R & RSI with Multiple PeriodsDESCRIPTION
1. Calculates %R and RSI with multiple period lengths.
1 period length value is defined by User.
8 period length values follow User's selection of classic number sequences, e.g. Fibonacci, Leonardo, Lucas, Narayana, etc.
2. User selects which indicator and periods to display or hide.
DEFAULTS
%R default custom period: 10.
RSI default custom period: 14.
%R & RSI default number sequence periods: Lucas numbers 11, 18, 29, 47, 76, 123, 199, 322.
CALCULATIONS
%R = (period high - most recent period's close price)/(period high - period low)
RSI = 100 - 1 / (100 + RS), where RS = SMMA(up, period) / SMMA(down, period)
PURPOSE
1. Identify price trends.
CREDITS
1. Williams %R technical analysis momentum oscillator by Larry Williams.
2. Wilder's Relative Strength Index technical analysis momentum oscillator by J. Welles Wilder.
3. "Solarized" color scheme by Ethan Schoonover.
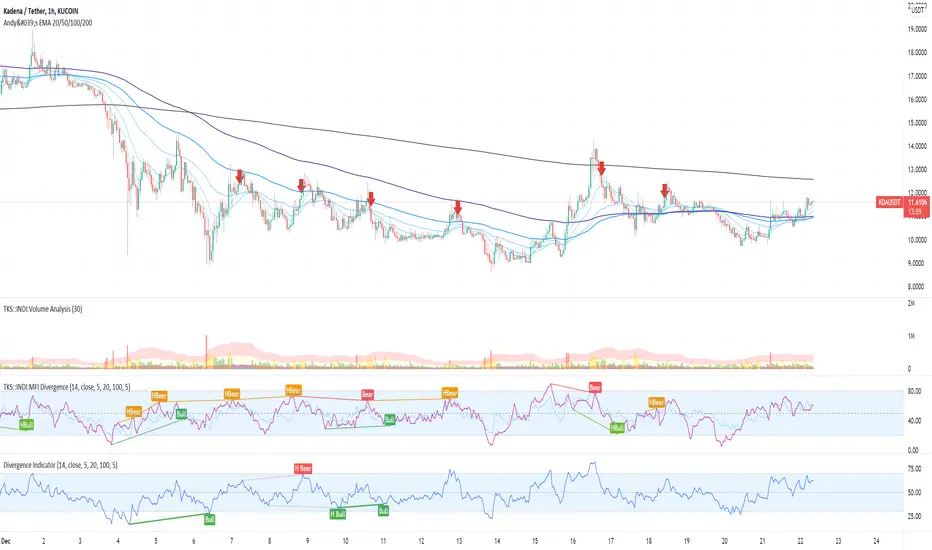
MFI Divergence Indicator Our Developer Malin converted the built-in RSI divergence indicator to MFI (Money Flow Index).
How to apply?
Notice 1: MFI, unlike the RSI, incorporates volume. It thus is an indicator of a higher precision when it comes to finding the the moment to sell - or - the moment to enter.
Notice 2: In Ranging Markets MFI (and RSI) is a solid momentum indicator to buy or sell. The asset displayed shows a slight markdown. Thus, we are looking primarily for short positions. Once can tell by us omitting the first 2 hidden bearish divergence signals and then entering the market.
Notice 3: Divergences depend on pivot points. The drawback with pivot points is that it is a lagging indication of a potential reversal. The more time (bars) one takes to confirm a reversal the less profitable is the trade - but less risky. In the charts one can tell that we enter the market 5 bars later. Usually that is not the tip of the reversal.
Notice 4: One must adapt the left and right periods of the indicator to risk/reward ratio, length of swing / frequency modulation and volatility of the price action.
Credits: Credits go to the Tradingview Team for delivering the original code. And Malin for the conversion. Please keep the copy right as a courtesy.
Oversold / OverboughtMy first script. Based on RSI , CCI , RVI, and MFI . You can customize overbought or oversold thresholds for any indicator.
If you have any ideas - welcome.
Disclaimer
This is not financial advice. Trade on your own risk.

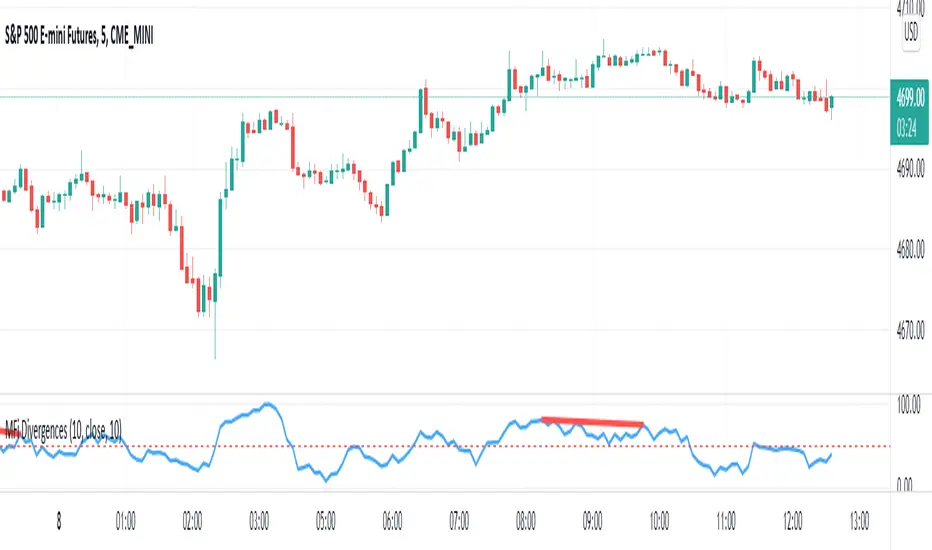
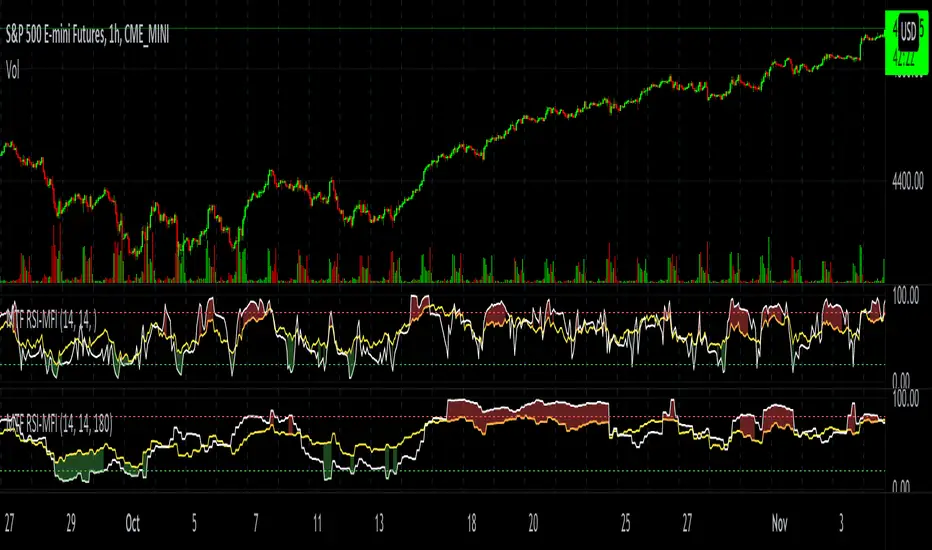
MTF RSI-MFIThe script plots both RSI and MFI of security, automatically highlights oversold and overbought conditions and allows for calculating indicators on timeframes other than the chart.
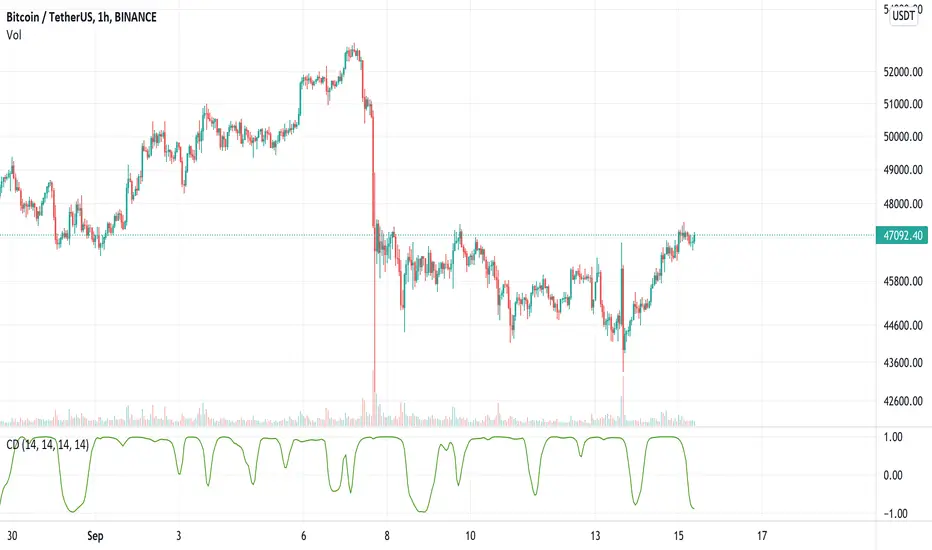
Continuous DivergenceDivergence is generally measured on the RSI and limited to finding either:
1. higher highs on the price and lower highs on the RSI (bearish divergence)
2. lower lows on the price and higher lows on the RSI (bullish divergence)
Continuous Divergence (CD) does two things differently. Firstly, it uses the MFI as its primary source of data, due to its volume component giving it higher accuracy. Secondly, it doesn't measure discrete divergence - i.e. between peaks and troughs - but rather a continuous divergence measurement.
Essentially it is measuring at any given time, the correlation between the price and the MFI. This is smoothed with a moving average (configurable) to get cleaner lines.
CD is used to detect both a slowing down of momentum on the current trend, and a reversal of trend due to changing momentum.
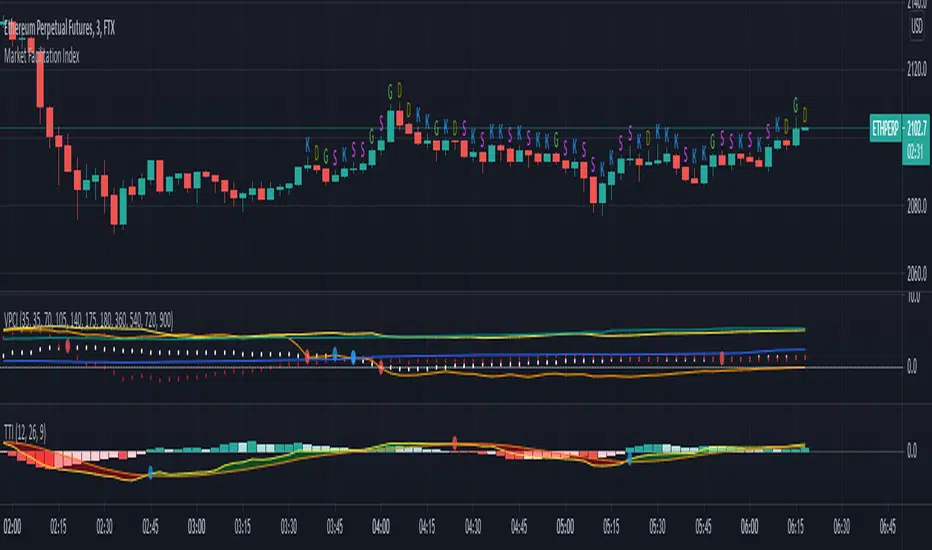
[MFI] Market Facilitation Index Written by Bruce-JSH
Implemented MFI(Market Facilitation Index) of Buff Dormeier
no license, no copyright.
There are no obligations or restrictions on you no matter how you do this script.
version 2021.07.11.a
1. First public release
2. G => Green(++), D => faDe bar(--), K => faKe bar(-+), S => Squat bar(+-)
Dynamic SMAThis script uses dynamic length to create a different sma type.
The length of the "Dynamic SMA" - "dSMA" can be:
'RSI', 'Stoch', 'ATR', 'MFI' or '%R'
For example 'RSI' -> the length of the sSMA will be the RSI itself
The biggest challenge was:
'Pine cannot determine the referencing length of a series. Try using max_bars_back' error
The writer of 'referencing length of a series' issue gave following solution:
bar_index == 0 ? 4999 : len
or in case of values which don't go above 100:
bar_index == 0 ? 100 : len
This assigns the necessary buffer to the function.
I'm most grateful for the given solution!
These dSMA's can give Support/Resistance levels, also crossovers of different dSMA's can give extra information
Examples:
RSI
ATR (close / atr(len)
Stoch
MFI
%R
"show regular SMA" will show the "SMA" with the same length (with default lighter color)

Chart OscillatorI present you the chart oscillator where an oscillator (Stoch or RSI) is plotted
on the chart itself (instead of below the chart)
It is inspired on an idea of @Kablamicus
Instead of having the lines between 0 and 100, here the '0-100' are
- lowest(low, len)
- highest(high, len)
An overbought/oversold and a middle line is derived from these lines
and the oscillator goes in between.
It resembles very much the 'normal' oscillator, with a few extra's:
- you can see the movement of the candles against the oscillator
- S/R levels of oscillator, 50 line, overbought/oversold line, 0-100 line
Stoch:
RSI:
Also a table is included with the Stoch/RSI values
Cheers!

CCI/MFI/VZO/RSI - HEATMAPHeatmap I made/reverse engineered.
Currently tracks the 4 following oscillators:
- CCI (Channel Commodity Index)
- MFI (Money Flow Index)
- VZO (Volume Zone Oscillator)
- RSI (Relative Strength Index)
Any feedback or suggestions highly appreciated.
/* Inspiration taken from @ByzantineGeneral (TradingView profile: /u/ByzantineGeneral, indicator: /script/keAGdnWO-Byzantium-Oscillator-Heatmap) */

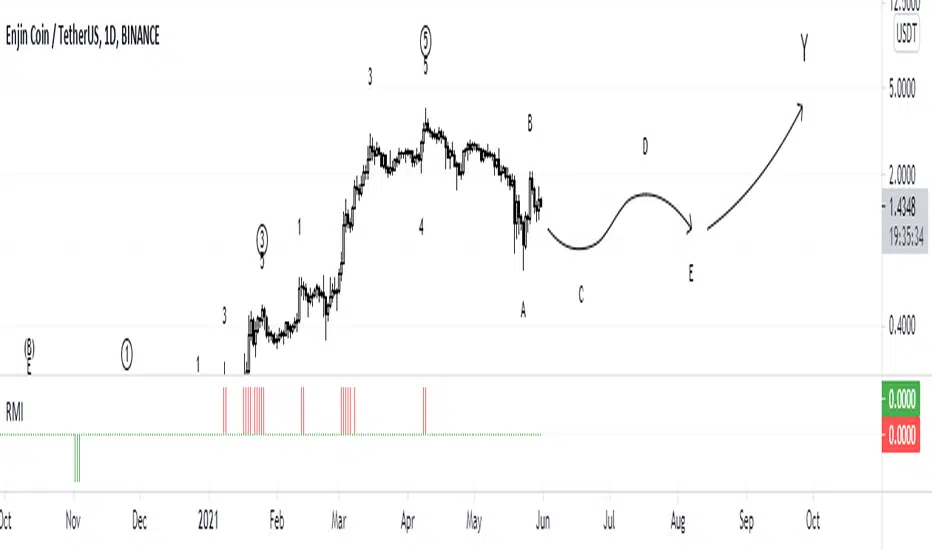
RMIRMI is a combination of RSI and MFI oscillators which considers money flow and strength of supply or demand together.
It estimates that the money of which side is being ran out.
So the power of trends can be predictable approximately.
Where the green columns appear, it means demand is very high and it can fall because buyers may withdraw and sell their assets.
And when red columns appear, it means supply is very high and sellers or new buyers may enter into new deals which may increase the price of a asset.
I would be glad if I hear your feedbacks.

Dziwne MFI Overlay (with highlight)It is simply your traditional MFI , except that your 50 line became the actual price.
Why and how could it be useful? This indicator helps to spot more easily and efficiently divergences .
You could also use it for trend reversals as you usually do with your 50 line, but I would suggest to set a higher length for the MFI, like 155 or something like that.

GSO + RSI + MACD + MFI + Bollinger BandsThis script uses a Gann Swing Oscillator , RSI , MACD , MFI and Bollinger Bands to generate long and short signals for cryptocurrencies on the 5 minute chart.
The Gann Swing Oscillator was inspired by HPotter's GSO.
This script is for educational purposes only. This script is NOT to be used as financial advice. I will not accept liability for any losses which may occur as a result of using this script.

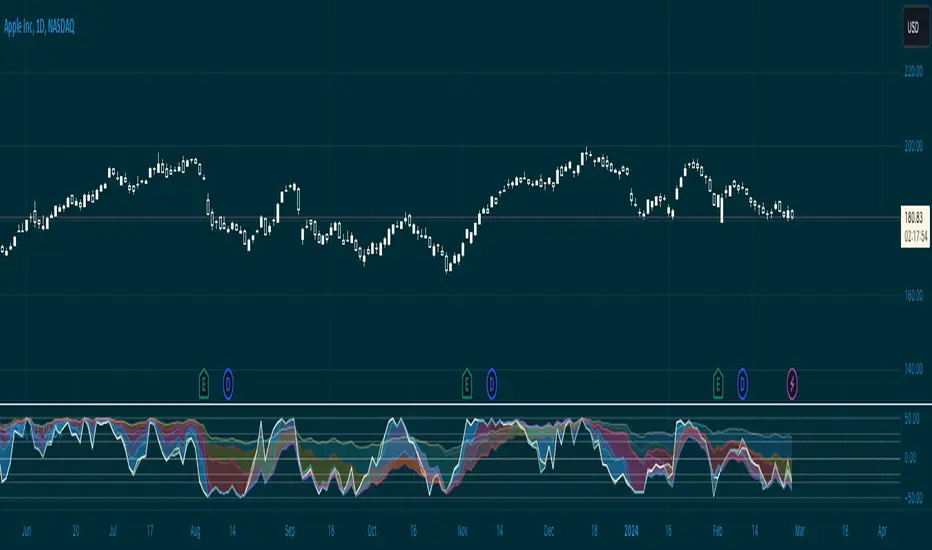
All in one [Liubam]Hey tradingviewers!
This is an All in one Indicator for those who can't add too many indicators on your charts. Inspired by ©LonesomeTheBlue "Indicators all in one" script. I found a lot of very interesting scripts on the public library and I decided to make a tool with some of the greatest IMO, adding some modifications to improve the indicators. With this tool you can plot 1 of 6 different indicators by selecting it from a drop-down list (on the indicator settings).
All the credit goes to it's respective owners (taggeds).
THIS INDICATOR INCLUDES:
1. Classic RSI with some OB/OS tools:
The relative strength index (RSI) is a popular momentum indicator displayed as an oscillator (a line graph that moves between two extremes) that measures the magnitude of recent price changes to evaluate overbought or oversold conditions, in other words it shows signals about bullish and bearish price momentum. I added some visual improvements to help you finding the OB/OS zones.
2. Classic CCI with some OB/OS tools.
The Commodity Channel Index (CCI) is a momentum-based oscillator used as market indicator to help determine market movements that may indicate buying or selling. Added some vistual improvements to the chart.
3. ADX and DMI oscillator with the keylevel coded by @console:
The Average Directional Index (ADX) is non-directional indicator used by some traders to determine the strength of a trend. When the ADX line is rising (Above the keylevel) trend strength is increasing, and the price moves in the direction of the trend whether up or down. Otherwise, low ADX (Below the keylevel) is usually a sign of accumulation or distribution (Range). Non-trending doesn't mean the price isn't moving. It may not be, but the price could also be making a trend change or is too volatile for a clear direction to be present.
Suggested settings of the keylevel is 23-25.... REMEMBER: The trend may be your friend.
4. MFI
The Money Flow Index (MFI) is a technical oscillator for identifying overbought or oversold signals in an asset. Unlike conventional oscillators such as the RSI, the Money Flow Index incorporates both price and volume data, as opposed to just price. It can also be used to spot divergences which warn of a trend change in price.
5. Stochastic:
A stochastic oscillator is range-bound, meaning it is always between 0 and 100. This makes it a useful indicator of overbought and oversold conditions. Traditionally, readings over 80 are considered in the overbought range, and readings under 20 are considered oversold. However, these are not always indicative of impending reversal; very strong trends can maintain overbought or oversold conditions for an extended period. Instead, traders should look to changes in the stochastic oscillator for clues about future trend shifts. I added some features for this popular indicator to show the stochastic crosses.
6. The famous Squeeze momentum Indicator made by @Lazybear:
This is derivate of John Carter's "TTM Squeeze" volatility indicator and its very strong when using with trending indicator such a ADX. Black line (or no-line) on the midline show that the market just entered a squeeze ( Bollinger Bands are with in Keltner Channel). This signifies low volatility , market preparing itself for an explosive move (up or down). Gray line signify "Squeeze release". Mr.Carter suggests waiting till the gray line after a blackline, and taking a position in the direction of the momentum (for ex., if momentum value is above zero, go long). Exit the position when the momentum changes.
------------------------------------------------------------------------------------------------------------------------------------------------------------------------------------------------------------------------------------------------
This script is source code protected, but you can add to your favorite list to use it. Also you can add twice to use 2 different indicators at the same time (E.g. Squeeze Momentum Indicator + ADX)
An additional indicator I made (MA Hunterz + InfoPanel) is needed to not miss good entry points.
Your valuable comment and feedback is much appreciated...
And remember indicators can be really helpfull but always use Price Action.

ArtY Money Flow IndexThis is modification of built-in Money Flow Index with painting of oversold and overbought areas.

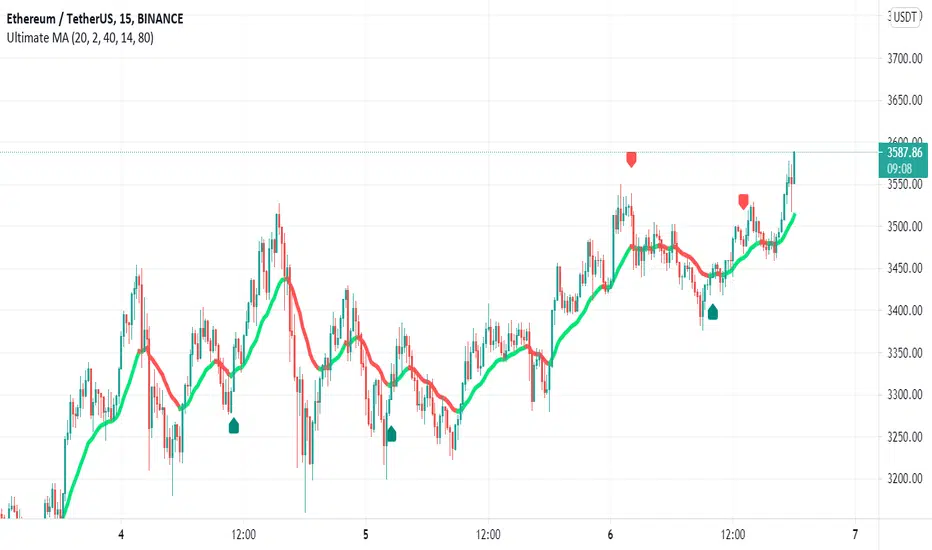
Ultimate MA + MFIHey Folks, this is in indicator that generates buy and sell alerts using Ultimate Moving Average and Money Flow Index.
Buy Alerts
Multi Time Frame Moving Average trend reversal AND MFI < threshold
Sell Alerts
MFI crossing under overbought threshold
Recommended settings for 3commas
- Create Alert with Buy Alert and link it to "Message for deal start signal"
- Create Alert with Sell Alert and link it to "Message to close all deals at Market Price"
- Set Take Profit to 1.0% with trailing between 0.2% and 0.6%
- DO NOT USE STOP LOSS