Outback RSI & Hull [TTF]This indicator was originally made to help users following along with one of our strategies that we call The Outback (hence the name).
One of the component indicators of that strategy is an RSI with a Hull Moving Average added on top of the RSI as an additional reference for the momentum of the RSI. Many people either had difficulty setting this up correctly, or were having issues with the Indicator on Indicator component, so we built this indicator to assist in that regard.
As we continued to use it, we found it to be a pretty sound momentum indicator that had much to offer by enhancing the more normal RSI, and wanted to make this indicator generally available to the public.
The basic premise of this indicator is as follows:
The core is a traditional RSI with a "normal" (usually Simple) moving average
The "secret sauce" is adding a 2nd moving average (a Hull Moving Average, inspired by Insilico's awesome Hull Suite) based off the RSI
By leveraging the RSI's position relative to both the Simple and Hull moving averages, you can better gauge the relative strength of the current momentum, as well as better visualize longer-term momentum direction and strength based on the moving average slopes and direction.
Momentum Indicator (MOM)

Crypto-DX Crypto Directional Index [chhslai]Crypto-DX can be used to help measure the overall strength and direction of the crypto market trend.
Furthermore, it can be used as a screener to find out cryptocurrencies which are accumulating momentum and tends to potentially pump or dump.
How this indicator works :
If the Crypto-DX cross above the zero-level, it could be an indication that there is a trend reversal into upward. You should close your short position or place a long order right away.
If the Crypto-DX cross below the zero-level, it could be an indication that there is a trend reversal into downward. You should close your long position or place a short order right away.
If the Crypto-DX is consolidated around the zero-level, it could be an indication that the trend may be ended and followed by a sideway market. You are suggested not to place any order and wait for the market moves.
Divergence based trading strategy is fully applicable, just like the MACD.
Screener features :
Plot "Crypto Index" and "5 Custom Crypto"
Plot "Crypto Index" and "Top 30 Crypto"

Point Of ControlStrategy and indicators are explained on the Chart.
Here's how i read the chart.
Entry:
1. Let the price close above the Ichimoku cloud
2. Price is above Volume Support zone
2. Make sure that momentum indicated with Green Triangles for Long Position
Exit:
1. Orange cross at the bottom of the candle indicates price is about to weaken
2. Best time to exit is Volume Resistance + Bearish(Hammer or Engulf )
PS: Use it along with R-Smart for better results

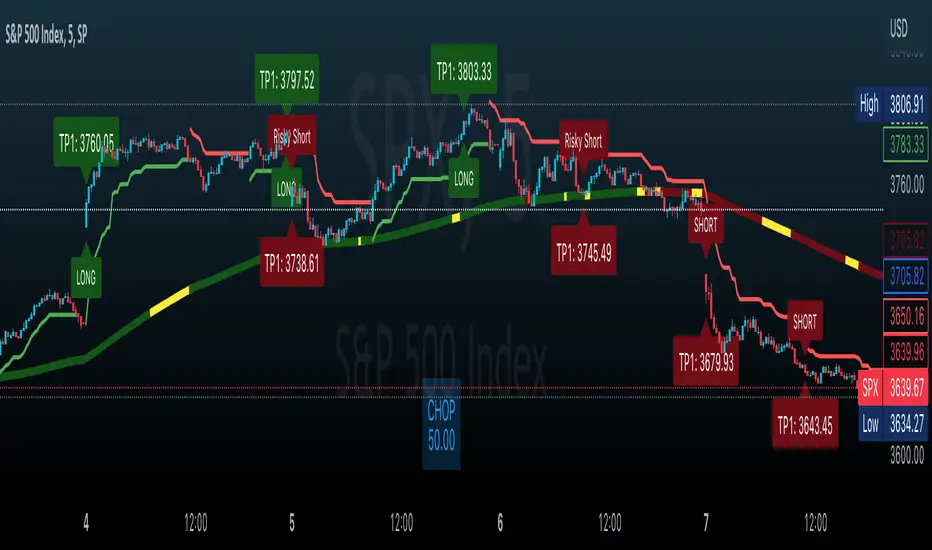
Effortless ScalpingEffortless Scalping is an indicator that primarily is used for stock options trading.
Effortless Scalping is based off of momentum. Our script takes into account the price action, volume, and historical data points of a stock to give potential "buy" and "sell" areas.
Effortless Scalping is a protected script because its Buy and Sell signals are based off of custom coded confirmations. This is what makes our script unique. We also have custom coded CHOP Filters in the indicator.
Effortless Scalping has a custom EMA line that flows with the trend of the market. It also changes colors to indicate a bullish or bearish trend . It also will change into a yellow color if the CHOP of the market exceeds your allowance. This EMA line is the only "classic" element of our custom coded script.
You can easily use Effortless Scalping by applying it straight to your chart. You can customize several visual effects in the settings menu.
Effortless Scalping also has two types of signals--RISKY signals and normal signals. Risky signals have a higher risk, but also a higher reward.
Effortless Scalping also features take profit levels based off of ATR levels.
Effortless Scalping also has custom support and resistance lines to better help you analyze the movement of a stock. These levels are based off of pivot levels.
Effortless Scalping can not predict the future move of a stock. Our script uses historical data points to alert POTENTIAL entries. These historical data points by NO MEANS predict the future movement of the market.
Effortless Scalping was created to help me understand the movement of a stock and why it may be moving in that direction. I personally found success using this script. I am sharing it because I am hoping that others find success in this script as well. I also like to trade quite frequently, and several times a day, so I made an indicator that is both accurate and alerts frequently.
This indicator does NOT provide financial advice. It is intended for general use only.
Cutlers RSICutlers' RSI is a variation of the original RSI Developed by Welles Wilder.
This variation uses a simple moving average instead of an exponetial.
Since a simple moving average is used by this variation, a longer length tends to give better results compared to a shorter length.
CALCULATION
Step1: Calculating the Gains and Losses within the chosen period.
Step2: Calculating the simple moving averages of gains and losses.
Step3: Calculating Cutler’s Relative Strength (RS). Calculated using the following:
-> Cutler’s RS = SMA(gains,length) / SMA(losses,length)
Step 4: Calculating the Cutler’s Relative Strength Index (RSI). Calculated used the following:
-> RSI = 100 —
I have added some signals and filtering options with moving averages:
Trend OB/OS: Uptrend after above Overbought Level. Downtrend after below Oversold Level.
OB/OS: When above Overbought, or below oversold
50-Cross: Above 50 line is uptrend, below is downtrend
Direction: Moving up or down
RSI vs MA: RSI above MA is an uptrend, RSI below MA is a downtrend
The signals I added are just some potential ideas, always backtest your own strategies.

Harris RSIThis is a variation of Wilder's RSI that was altered by Michael Harris.
CALCULATION
The average change of each of the length's source value is compared to the more recent source value.
The average difference of both positive or negative changes is found.
The range of 100 is divided by the divided result of the average incremented and decremented ratio plus one.
This result of the above is subracted from the range value of 100
I have added some signals and filtering options with moving averages:
Trend OB/OS: Uptrend after above Overbought Level. Downtrend after below Oversold Level (For the traditional RSI OB=60 and OS=40 is used)
OB/OS: When above Overbought, or below oversold
50-Cross: Above 50 line is uptrend, below is downtrend
Direction: Moving up or down
RSI vs MA: RSI above MA is an uptrend, RSI below MA is a downtrend
The signals I added are just some potential ideas, always backtest your own strategies.

TMO ArrowsTMO - (T)rue (M)omentum (O)scillator) MTF Arrows
Do you want to use TMO but you lack space on the chart? This study is just for you. This is the more user-friendly version of the TMO Oscillator. In terms of the indicator there are no changes except the indicator is converted in to the simple arrows.
There are Four Types of Arrows:
1. TMO Arrow Up - Visualizes the TMO bullish crosses.
2. TMO Arrow Down - Visualizes the TMO bearish crosses.
3. TMO Arrow Up (Oversolds Only) - Visualizes only the bullish crosses that are at or below the oversold zone.
4. TMO Arrow Down (Overboughts Only) - Visualizes only the bearish crosses that are at or above the overbought zone.
In case you only want the arrows for extremes, turn off the Arrow Up / Arrow Down first. Arrows for extremes only are turned off by default.
Hope it helps.

MTF TMOTMO - (T)rue (M)omentum (O)scillator) MTF (Higher Aggregation) Version
TMO calculates momentum using the DELTA of price. Giving a much better picture of the trend, reversals & divergences than most momentum oscillators using price. Aside from the regular TMO, this study combines four different TMO aggregations into one indicator for an even better picture of the trend. Once you look deeper into this study you will realize how complex this tool is. This version also produce much more information like crosses, divergences, overbought / oversold signals, higher aggregation fades etc. It is probably not even possible to explain them all, there could easily be an entire e-book about this study.
I have been using this tool for a couple of years now, and this is what i have learned so far:
Favorite Time Frame Variations:
1. 1m / 5m / 30m - Great for intraday futures or options scalps. 30m TMO serves as the overall trend gauge for the day. 5min dictates the longer term intraday moves as well as direction of the 1min. 1min is for the scalps. When the 5min TMO is sloping higher focus should be on 1min buy signals (red to green cross) and vice versa for the 5min agg. sloping down.
2. 5m / 30m / 60m - Also an interesting variation for day trading the 3-5 min charts. Producing more cleaner & beginner-friendly signals that lasts couple of minutes instead of seconds.
3. 120m / Day / 2 Day - For the 30m to 1H or 2H timeframes. Daily & 2 Day dictates the overall trend. 120 min for the signals. Great for a multi-day swings.
4. Day / 2 Day / Week - Good for the daily charts, swing trading analysis as the weekly dictates the overall trend, daily dictates the signals and the 2 day cleans out the daily signals. If the daily & 2 day are not aligned togather, daily signal means nothing. Weekly dictates 2 day - 2 day dictates daily.
5. Week / Month / 3 Month - Same thing as the previous variation but for the weekly charts.
TMO Length:
The default vanilla settings are 14,5,3. Some traders prefer 21,5,3 as the TMO length is litle higher = TMO will potenially last little longer which could teoretically produce less false signals but slower crosses which means signals will lag more behind price. The lower the length, the faster the oscillator oscillates. It is the noice vs. the lag debate. The Length can be changed, but i would not personally touch the other two. Few points up or down on length will not drastically change much. But changes on Calc Length and Smooth Length can produce totally different signals from the original.
Tips & Tricks:
1. Observe
- This is the best tip & trick I can give you. The #1 best way to learn how any study operates is to just observe how it works in certain situations from the past. MTF TMO is not
an exception.
2. The Power of the Higher Aggregation
- The higher aggregation ALWAYS dictates the lower one. Best way to see this? Just 2x the current timeframe aggregation = so on daily chart, plot the daily & two day TMOs and you will notice how the higher agg. smooths out the current agg. The higher the aggregation is, the smoother (but slower) will the TMO turn. The real power kicks in when the 3 or 4 aggregations are aligned togather in one direction.
3. Position of the Higher Aggregation in Relation to the Extremes
- Overbought / oversold signals might not really work on the current aggregation. But pay attention to the higher aggregations in relation to the extremes. Ex: on the daily chart - daily TMO inside the OB / OS extremes might not mean much. But once the higher aggregations such as 3 day or Weekly TMO enters OB/OS zone togather with the daily, this can be a very powerful signal for a TMO reversion to the zeroline.
4. Crosses
- Yes, crosses do work. Personally, I never really focused on them. The thing about the crosses is that it is crucial to pick the right higher aggregation to the combination of the current one that would be reliable but also print enough signals. The closer the cross is to the OB / OS extremes, the more bigger move can occur. Crosses around the zero line can be considered as less quality crosses.
5. Divergences
- TMO can print awesome divergences. The best divergences are on the current aggregation (TMO agg. same as the chart) since the current agg. oscillates fast, it can usually produce lower lows & higher highs faster then any higher aggregations. Easy setup: wait for the higher aggregation to reach the OB / OS extremes and watch the current (chart) aggregation to print a divergence.
6. Three is Enough
- I personally find more than three aggregations messy and hard to read. But there is always the option to turn on the 4th one. Just switch the TMO 4 Main, TMO 4 Signal and TMO 4 Fill in the style settings.
Hope it helps.

Strategy Myth-Busting #6 - PSAR+MA+SQZMOM+HVI - [MYN]This is part of a new series we are calling "Strategy Myth-Busting" where we take open public manual trading strategies and automate them. The goal is to not only validate the authenticity of the claims but to provide an automated version for traders who wish to trade autonomously.
Our sixth one we are automating is " I Tested ''7% Profit Per Day" Scalping Strategy 100 Times ( Unexpected Results ) " from " TradeIQ " which claims to have made 175% profit on the 5 min chart of BTCUSD with a having a 61% win rate in just 32 days.
Originally, we mimicked verbatim the indicators and settings TradeIQ was using however weren't getting promising results anything close to the claim so we decided to try and improve on it. We changed the static Parabolic SAR to be adaptive based upon the timeframe. We did this by using an adjustable multiplier for the PSAR Max. Also, In TradeIQ's revised version he substituted Hawkeye's Volume Indicator in lieu of Squeeze Momentum. We found that including both indicators we were getting better results so included them both. Feel free to experiment more. Would love to see how this could be improved on.
This strategy uses a combination of 4 open-source public indicators:
Parabolic Sar (built in)
10 in 1 MA's by hiimannshu
Squeeze Momentum by lazybear
HawkEYE Volume Indicator by lazybear
Trading Rules
5m timeframe and above. We saw equally good results in the higher (3h - 4h) timeframes as well.
Long Entry:
Parabolic Sar shifts below price at last dot above and then previous bar needs to breach above that.
Price action has to be below both MA's and 50MA needs to be above 200MA
Squeeze Momentum needsd to be in green or close to going green
HawkEYE Volume Indicator needs to be show a green bar on the histagram
Short Entry:
Parabolic Sar shifts above price at last dot below and then previous bar needs to breach below that.
Price action needs to be above both MA's and 50MA needs to be below 200MA
Squeeze Momentum needsd to be in red or close to going red
HawkEYE Volume Indicator needs to be show a red bar on the histagram
If you know of or have a strategy you want to see myth-busted or just have an idea for one, please feel free to message me.

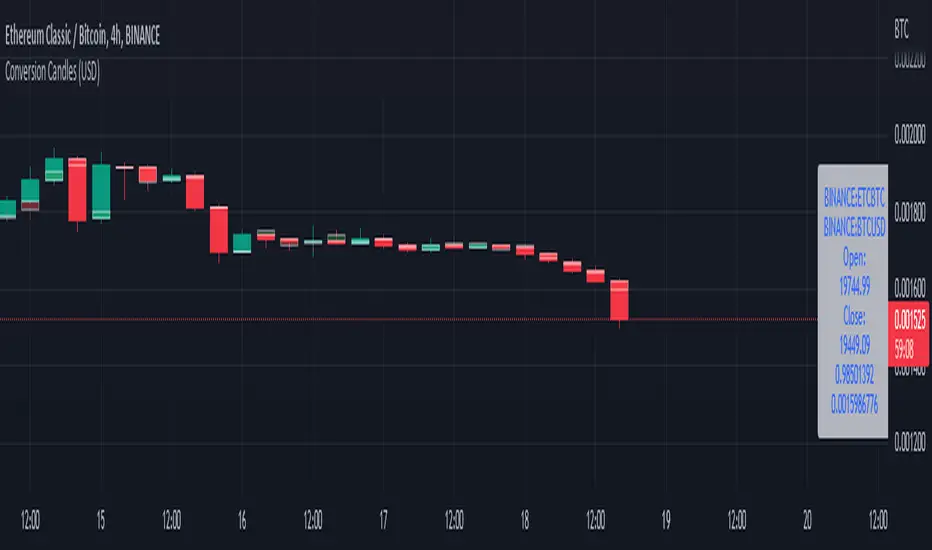
Conversion Range Candles// Conversion Range Candles
// Compares price action range with that of the value currency (e.g. ETHBTC compared to BTCUSD).
// Public Domain
// by JollyWizard
Normalized Velocity [Loxx]Velocity (which is often called a "smoother momentum" since it is much smoother than momentum without lagging at all) with an addition of ATR normalization
Since velocity is (even when normalization is applied) is not an indicator with fixed bounds, this indicator is uses floating levels for what is usually called overbought and oversold levels (+ a floating "zero" line is added). Something that would look like a "fixed levels" is easily achieved if you use long floating levels period in which case those levels are quite similar to fixed levels.
This indicator can be used like any momentum indicator (in that case recommended coloring mode is to use either slope coloring or "zero" middle level crossing coloring) or it can be used as a "trending" indicator in which case it is better to use coloring on outer level cross, and longer calculation periods are advised in that case.
Included:
Bar coloring
3 signal variations w/ alerts
Loxx's Expanded Source Types
Alerts
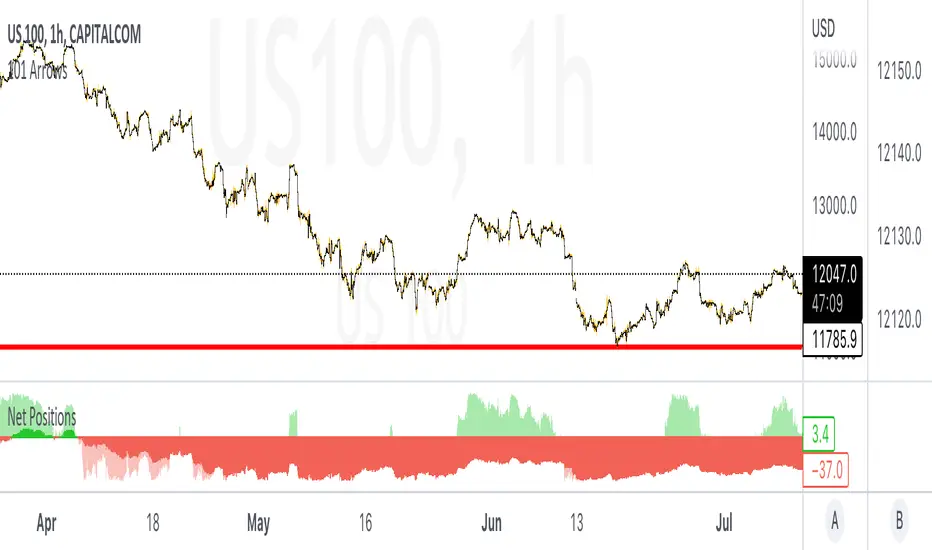
Retail & Banker Net PositionsIn any market there are two major sets of participants, Retail traders (like you & I) who command relatively small amounts of capital and typically enter and exits positions quickly, and then Institutional Traders (sometimes referred to as whales) who command large amounts of capital and dictate the overall trend of the market but enter and exit positions slowly.
In this indicator we look at the distinct volume of these two sets of traders and use the net positions of this volume to determine if they are net long (Buying) in the market or net short (Selling).
When each set of traders are on opposite sides of the market (Retail are selling & Institutions are buying for example) it usually results in a battle and choppy price action... the majority of these battles are won by the Institutions as their large sums of money dictate the overall direction markets move.
Some of the best opportunities are when both sets of traders are on the same side of the market & this is where we see real momentum enter the market with quick price moves.
Happy trading =)
Trend Surfers - Momentum + ADX + EMAThis script mixes the Lazybear Momentum indicator, ADX indicator, and EMA.
Histogram meaning:
Green = The momentum is growing and the ADX is growing or above your set value
Red = The momentum is growing on the downside and the ADX is growing or above your set value
Orange = The market doesn't have enough momentum or the ADX is not growing or above your value (no trend)
Background meaning:
Blue = The price is above the EMA
Purple = The price is under the EMA
Cross color on 0 line:
Dark = The market might be sideway still
Light = The market is in a bigger move

Scallop Pattern built for scalping NQ & MNQ
The Scallop Pattern identifies momentum reversal.
The pattern consists of two candles and the direction to trade is confirmed in the following candle.
An example trade is shown in the picture. s3.tradingview.com
A Stop Limit order is generally used to enter the long position.

OMA-Filtered Kase Permission Stochastic [Loxx]OMA-Filtered Kase Permission Stochastic is a special implementation of Kase Permission Stochastic by Kase StatWare.
What is Kase StatWare?
Kase StatWare has been around since 1992 and is a technical analysis trading indicator package developed by the acclaimed market technician and former energy trader Cynthia A. Kase. StatWare’s self-optimizing indicators help professional and individual traders to form a precise and systematic approach to discretionary trading and trade risk management.
Kase StatWare creates subscription-based technical analysis tools mainly for Stocks and Futures trading which can be subscribed to at a monthly cost.
What is Kase Permission Stochastic?
The Kase Permission Stochastic is a momentum indicator that examines a synthetic longer bar length, that by default, is three (5x by default for this implementation here) times higher than the bar length it is plotted against.
Included
Alerts
Signals
Bar coloring

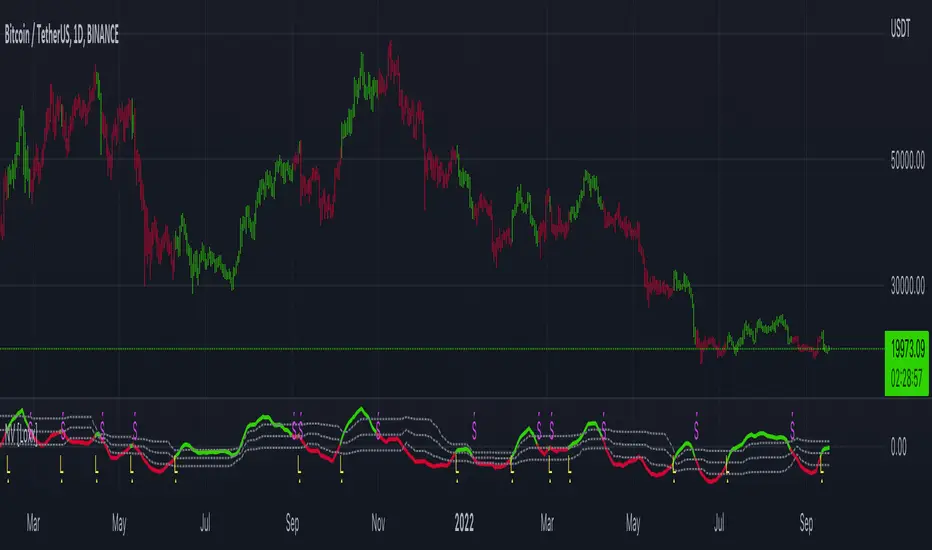
Market momentum catcherIs a tool used to catch market momentum. If the color is green it means the bulls are in momentum or the prices will continue to increase, if the color is red it means the bears are in momentum or the prices will continue to decrease and gray color means the market is consolidating.
This tool is made from moving averages and RSI.
You can place a buy order when the color is green, you can place a sell order when the color is red and if the color is gray do not trade.

T3 Velocity Candles [Loxx]T3 Velocity Candles is a candle coloring overlay that calculates its gradient coloring using T3 velocity.
What is the T3 moving average?
Better Moving Averages Tim Tillson
November 1, 1998
Tim Tillson is a software project manager at Hewlett-Packard, with degrees in Mathematics and Computer Science. He has privately traded options and equities for 15 years.
Introduction
"Digital filtering includes the process of smoothing, predicting, differentiating, integrating, separation of signals, and removal of noise from a signal. Thus many people who do such things are actually using digital filters without realizing that they are; being unacquainted with the theory, they neither understand what they have done nor the possibilities of what they might have done."
This quote from R. W. Hamming applies to the vast majority of indicators in technical analysis . Moving averages, be they simple, weighted, or exponential, are lowpass filters; low frequency components in the signal pass through with little attenuation, while high frequencies are severely reduced.
"Oscillator" type indicators (such as MACD , Momentum, Relative Strength Index ) are another type of digital filter called a differentiator.
Tushar Chande has observed that many popular oscillators are highly correlated, which is sensible because they are trying to measure the rate of change of the underlying time series, i.e., are trying to be the first and second derivatives we all learned about in Calculus.
We use moving averages (lowpass filters) in technical analysis to remove the random noise from a time series, to discern the underlying trend or to determine prices at which we will take action. A perfect moving average would have two attributes:
It would be smooth, not sensitive to random noise in the underlying time series. Another way of saying this is that its derivative would not spuriously alternate between positive and negative values.
It would not lag behind the time series it is computed from. Lag, of course, produces late buy or sell signals that kill profits.
The only way one can compute a perfect moving average is to have knowledge of the future, and if we had that, we would buy one lottery ticket a week rather than trade!
Having said this, we can still improve on the conventional simple, weighted, or exponential moving averages. Here's how:
Two Interesting Moving Averages
We will examine two benchmark moving averages based on Linear Regression analysis.
In both cases, a Linear Regression line of length n is fitted to price data.
I call the first moving average ILRS, which stands for Integral of Linear Regression Slope. One simply integrates the slope of a linear regression line as it is successively fitted in a moving window of length n across the data, with the constant of integration being a simple moving average of the first n points. Put another way, the derivative of ILRS is the linear regression slope. Note that ILRS is not the same as a SMA ( simple moving average ) of length n, which is actually the midpoint of the linear regression line as it moves across the data.
We can measure the lag of moving averages with respect to a linear trend by computing how they behave when the input is a line with unit slope. Both SMA (n) and ILRS(n) have lag of n/2, but ILRS is much smoother than SMA .
Our second benchmark moving average is well known, called EPMA or End Point Moving Average. It is the endpoint of the linear regression line of length n as it is fitted across the data. EPMA hugs the data more closely than a simple or exponential moving average of the same length. The price we pay for this is that it is much noisier (less smooth) than ILRS, and it also has the annoying property that it overshoots the data when linear trends are present.
However, EPMA has a lag of 0 with respect to linear input! This makes sense because a linear regression line will fit linear input perfectly, and the endpoint of the LR line will be on the input line.
These two moving averages frame the tradeoffs that we are facing. On one extreme we have ILRS, which is very smooth and has considerable phase lag. EPMA has 0 phase lag, but is too noisy and overshoots. We would like to construct a better moving average which is as smooth as ILRS, but runs closer to where EPMA lies, without the overshoot.
A easy way to attempt this is to split the difference, i.e. use (ILRS(n)+EPMA(n))/2. This will give us a moving average (call it IE /2) which runs in between the two, has phase lag of n/4 but still inherits considerable noise from EPMA. IE /2 is inspirational, however. Can we build something that is comparable, but smoother? Figure 1 shows ILRS, EPMA, and IE /2.
Filter Techniques
Any thoughtful student of filter theory (or resolute experimenter) will have noticed that you can improve the smoothness of a filter by running it through itself multiple times, at the cost of increasing phase lag.
There is a complementary technique (called twicing by J.W. Tukey) which can be used to improve phase lag. If L stands for the operation of running data through a low pass filter, then twicing can be described by:
L' = L(time series) + L(time series - L(time series))
That is, we add a moving average of the difference between the input and the moving average to the moving average. This is algebraically equivalent to:
2L-L(L)
This is the Double Exponential Moving Average or DEMA , popularized by Patrick Mulloy in TASAC (January/February 1994).
In our taxonomy, DEMA has some phase lag (although it exponentially approaches 0) and is somewhat noisy, comparable to IE /2 indicator.
We will use these two techniques to construct our better moving average, after we explore the first one a little more closely.
Fixing Overshoot
An n-day EMA has smoothing constant alpha=2/(n+1) and a lag of (n-1)/2.
Thus EMA (3) has lag 1, and EMA (11) has lag 5. Figure 2 shows that, if I am willing to incur 5 days of lag, I get a smoother moving average if I run EMA (3) through itself 5 times than if I just take EMA (11) once.
This suggests that if EPMA and DEMA have 0 or low lag, why not run fast versions (eg DEMA (3)) through themselves many times to achieve a smooth result? The problem is that multiple runs though these filters increase their tendency to overshoot the data, giving an unusable result. This is because the amplitude response of DEMA and EPMA is greater than 1 at certain frequencies, giving a gain of much greater than 1 at these frequencies when run though themselves multiple times. Figure 3 shows DEMA (7) and EPMA(7) run through themselves 3 times. DEMA^3 has serious overshoot, and EPMA^3 is terrible.
The solution to the overshoot problem is to recall what we are doing with twicing:
DEMA (n) = EMA (n) + EMA (time series - EMA (n))
The second term is adding, in effect, a smooth version of the derivative to the EMA to achieve DEMA . The derivative term determines how hot the moving average's response to linear trends will be. We need to simply turn down the volume to achieve our basic building block:
EMA (n) + EMA (time series - EMA (n))*.7;
This is algebraically the same as:
EMA (n)*1.7-EMA( EMA (n))*.7;
I have chosen .7 as my volume factor, but the general formula (which I call "Generalized Dema") is:
GD (n,v) = EMA (n)*(1+v)-EMA( EMA (n))*v,
Where v ranges between 0 and 1. When v=0, GD is just an EMA , and when v=1, GD is DEMA . In between, GD is a cooler DEMA . By using a value for v less than 1 (I like .7), we cure the multiple DEMA overshoot problem, at the cost of accepting some additional phase delay. Now we can run GD through itself multiple times to define a new, smoother moving average T3 that does not overshoot the data:
T3(n) = GD ( GD ( GD (n)))
In filter theory parlance, T3 is a six-pole non-linear Kalman filter. Kalman filters are ones which use the error (in this case (time series - EMA (n)) to correct themselves. In Technical Analysis , these are called Adaptive Moving Averages; they track the time series more aggressively when it is making large moves.

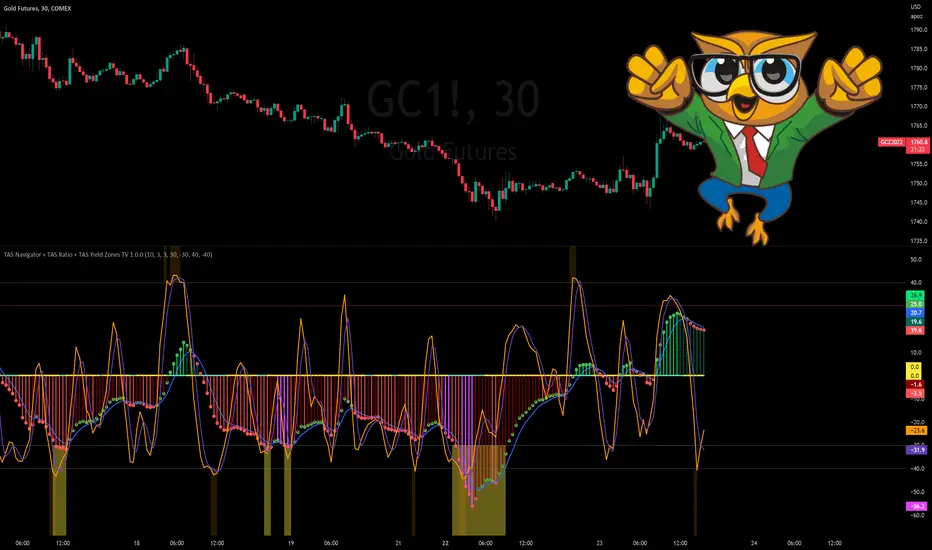
TAS Navigator + TAS Ratio + TAS Yield Zones [TASMarketProfile]This bundle of 3 TAS Market Profile indicators reveal when markets are gaining momentum, exhausted and reaching critical overbought/oversold conditions. The indicators display on a space-saving bottom pane and provide multi-perspective analysis that yield confidence in what direction to trade and when. The TAS Navigator, TAS Ratio, and TAS Yield Zones can be applied to any financial market such as stocks, ETFs, futures, Forex and digital currencies.
∟ ABOUT TAS NAVIGATOR:
TAS Navigator is a versatile indicator that combines several signals to help you manage your trades and avoid unfavorable situations. At a glance, the Navigator can provide the trader with useful information about underlying trading conditions for any time frame chart. The Navigator is comprised of three primary components – the histogram, the moving average and the zero line.
The histogram consists of the vertical bars plotted above and below the horizontal “zero line.” The bars are color-coded to provide the following information:
NEON GREEN / RED – The directional move continues to gain momentum.
DARK GREEN / RED – The buying or selling momentum is falling off.
MAGENTA – Exhaustion warning and the move has reached “peaking” conditions that may be difficult to maintain. Markets are likely to run sideways for a period of time or a direction change may be near.
The moving average (MA) is the blue line that travels horizontally across the Navigator and provides a relative measure of the overall levels of buying or selling. You will notice that the dots capping the histogram bars change from green to red as they move above or below the MA. The color of these dots tells us the following:
GREEN DOTS – The buyers are currently in control.
RED DOTS – The sellers are currently in control.
The zero line is the horizontal line around which the histogram plots. It provides a reference point for the larger momentum shifts. It is color-coded in the following manner:
CYAN – The current market phase is trending / unbalanced.
YELLOW – The current market phase is sideways / balanced.
INTERPRETATION AND RULES:
The TAS Navigator’s inherent ability to visualize the overall pulse of the market can inform your trading decisions in several ways:
>>> If the histogram is neon green or red, the trader should look for trading opportunities in the appropriate direction (green = long; red = short) and hold for increased profits as long as the bars remain neon green or red.
>>> If magenta bars appear, the trader knows to tighten stops and look for profit-taking opportunities because the trend has reached peaking conditions.
>>> When the histogram switches to dark green or red – indicating momentum is slowing – the trader can look to tighten stops and consider technical areas for reentry.
>>> Once the histogram crosses the MA and the capping dot changes to the opposite color of the histogram bar, a trader knows that they can begin looking for countertrend trade opportunities.
>>> Most importantly, until that dot changes color, the trader knows that the odds do not favor looking for trading opportunities against the current trend.
>>> The relative peaks of the histogram bars can also provide valuable information. As consecutive histogram peaks move further away from the zero line, price should extend the trending move. When consecutive histogram peaks become closer to the zero line, the price should create a lower high or higher low soon.
>>> A trend line connecting histogram peaks can be used to identify trading levels based upon momentum reaching the necessary level to touch the projected trend line.
>>> Trading opportunities can also be found when divergence occurs between the histogram and price. For example, consecutive histogram peaks move further away from zero line, but price cannot extend the trend.
∟ ABOUT TAS RATIO:
TAS Ratio is a leading indicator which helps forecast short-term price movements. It is best used for gauging targeted areas for entry and exit points. It was designed to identify when price movement is confirmed by volume and volatility as well as when market moves lack momentum, conviction and follow through. TAS Ratio levels are determined by a defined time within a 24-hour period and applicable for intraday charts only. The analysis can be applied to any liquid financial instrument and provides target trading zones in either direction.
INPUT SETTINGS FOR TAS RATIO:
There are 3 inputs for TAS Ratio and below you’ll find the default settings:
Ratio RangeBars: 10
Ratio AverageBars: 3
Ratio MABars: 3
>>> Ratio RangeBars – Sets the desired lookback period. Default = 10.
>>> Ratio AverageBars – Sets the smoothing factor and should be the same as MABars setting. Default = 3.
>>> Ratio MABars – Sets the smoothing factor and should be the same as AverageBars setting. Default = 3.
CONFIGURATION NOTES:
As a rule, the RangeBars period should be twice (or more) than the AverageBars and MABars setting. Remember that the AverageBars and MABars settings should be equal. For example, 6/3/3 or 8/4/4 would be minimum separation.
Faster time charts may prefer slower indicator settings for smoother readings. For example, on 30-minute charts or lower the settings for RangeBars period and AverageBars and MABars could be 10/5/5 or even 16/8/8 respectively.
TAS RATIO DISPLAY:
TAS Ratio – Displays more volatile orange-colored line
Moving Average – Displays smoothed moving average purple-colored line
Note that the default colors can be adjusted in the Style settings.
INTERPRETATION AND RULES:
TAS Ratio is displayed on the same pane and scale as TAS Navigator in which readings of +40 is considered overbought and -40 is oversold.
TAS Ratio is especially effective when traders are aiming to time entry points into emerging intraday trends which can be observed when the price is making new “higher lows” or alternatively when price is making new “lower highs.”
TAS Ratio is a sensitive indicator by nature and should be viewed as a tool for fine-tuning a more granular entry or exit within the scope of other TAS Indicators.
TAS Ratio is useful in confirming when price may be at an area of divergence to locate and target higher probability entries and exits.
In general, price should move freely in the same direction of the indicator and in a proportionate range of movement.
When price fails to move proportionately, as much as TAS Ratio moves or stalls, this divergence alerts you to focus on immediate areas of support and resistance.
When price stalls and TAS Ratio does not stall, this is an indication to seek confirmation for a valid counter-trend trading opportunity.
Pay attention to TAS Ratio (orange line) crossovers above and below the Moving Average line (purple line), but also observe the trajectory and whether the Ratio line is pulling away and creating greater distance from the Moving Average line. Increasing distance is a sign of strength of move in that direction.
∟ ABOUT TAS YIELD ZONES:
TAS Yield Zones provides a valuable visual warning via a yellow background color when TAS Navigator and/or TAS Ratio indicators are exceeding specific overbought or oversold threshold lines dictated by the user. The indicator is visible in the same bottom pane as these two indicators. The user controls how extreme of the overbought or oversold condition they mandate in order to trigger the “Yield Zone” warning for each indicator based on the inputs for the TAS Yield Zones threshold lines.
INPUT SETTINGS FOR TAS YIELD ZONES:
Within the Input settings, you can activate or deactivate the visibility of TAS Yield Zones for TAS Navigator or TAS Ratio. By default, both will be visible. There are 4 inputs for TAS Yield Zones and below you’ll find the default settings:
Yield Zones Nav Overbought Line: 40 (red line by default)
Yield Zones Nav Oversold Line: -40 (green line by default)
Yield Zones Ratio Overbought Line: 40 (gray line by default)
Yield Zones Ratio Oversold Line: -40 (gray line by default)
The farther away the Inputs are from the 0 line, the stronger the move must be bullish or bearish in order to get to the threshold lines. For instance, Inputs of 50/-50 would require a more substantial move than 30/-30 settings. Additionally, the user can adjust the coloring of the TAS Yield Zones inside the Style settings.
TAS Yield Zones are best used in conjunction with TAS Navigator and TAS Ratio so the user can visually see when the threshold lines are near being approached and exceeded. When all three indicators are visible on the pane, you can see when there is a confluence of overbought or oversold conditions simultaneously on both TAS Navigator and TAS Ratio indicators and when exhaustion warning conditions are present. When these three conditions occur, there is a likelihood that a move in the opposite direction (or at a minimum a sideways condition) may be near.
Trade Well My Friends,
[HA] Heikin-Ashi Shadow Candles// For overlaying Heikin Ashi candles over basic charts, or for use in it's own panel as an oscillator.
// Enjoy the visual cues of HA candles, without giving up price action awareness.
// Good for learning and comparison.
// Aug 11 2022
Release Notes: * Bugfix: Candle color was based on classic direction not HA direction (did not update cover photo).
// Aug 12 2022
Release Notes: * Implemented true oscillator mode.
Provided as separate plot (styles tab) or mode switch option (Inputs tab). TV gets spazzy with "styles tab" "default hidden" plots, and will reset them if any variables are modified that affect them (i.e. wick color override). Mode switch should be sufficient for both users.
// Aug 21 2022
Republished because of typo in indicator name prevented search.

Munich's Momentum Wave V2MUNICH'S MOMENTUM WAVE VERSION 2 IS LIVE!!!
There are a few big things to note with this one.
I decided to upload this as an entirely new script due to the number of changes differing from the first version, but as the last one, this will still work on ANY TIMEFRAME, ANY ASSET CLASS, ANY PRICE! .
This momentum wave indicator now will give you data for when trend could turn, and two momentum indicators to help you decide when to take an entry.
First off,
*I have added an alma ma (alma) that will track momentum alongside price action and further lead the indicator consisting of the Munich waves.
* The background feature will track the price using a method derived from the Bollinger bands, after calculations, it will color the background based on the average of the momentum's ema's, the alma ma, and also the alma in comparison to the alma's value pre offset ( the offset is 3, following the basis).
*There are now 5 basis values given from the increase in ema samples.
If anyone has any questions feel free to pm me or comment below. Thank you guys for the support! :)
INDEX:BTCUSD TVC:NDQ AMEX:SPY BITSTAMP:ETHUSD BINANCE:BTCUSDT FX:USDJPY NASDAQ:AAPL

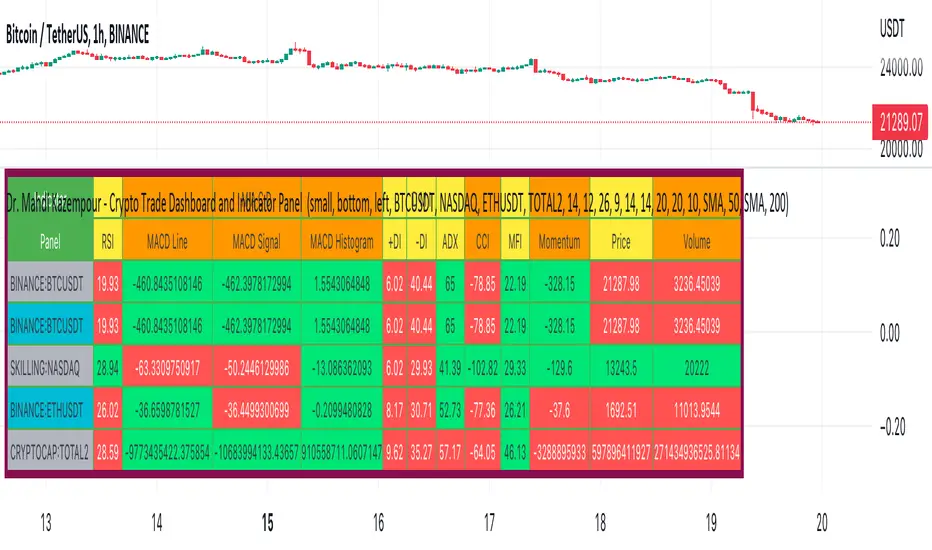
Dr. Mahdi Kazempour - Crypto Trade Dashboard and Indicator PanelA great panel for crypto traders all in one table:
Price, Volume, RSI, MACD, ADI, MOM
1) current symbol
2) BTCUSDT
3) NASDAQ
4) ETHUSDT
5) TOTAL2
München's Momentum WaveMUNICH'S MOMENTUM WAVE:
This momentum tracker has features sampled from Madrid's moving average ribbon but has differentiated many values, parameters, and usage of integers. It is derived using momentum and then creates moving averages and mean lengths to help support the strength of a move in price action, and also has the key mean length that helps determine HL/LH or rejections into trend continuation. This indicator works on ALL TIME FRAMES, ALL ASSET CLASSES ON ALL SETTINGS!!
HOW DO I USE IT?
*First off, I have arranged the input settings into groups based on the parts of the indicator it affects.
*You want to use the aqua/white/yellow (Munich's line) as your leading indicator, this is a combined average of the MoM indicator.
* When using Munich's line you want to look at the relation to the mean line (the flat line that adjusts based on price action. You will often see rejections of this line into trend continuation. I personally have caught perfect LH/HL bounce trades off of this indicator.
* Use the Background and other colored moving averages to help pre-determine moves based on the -3 offset value of Munich's line. This was by design not to create 'accurate' results, but to help predict momentum swings based on sharper moves in price action better than if all values lined up to the current bar.
Cheat Code's Notes:
I hope you guys find this indicator to be useful, this is most likely the best indicator that I have written. Simply for the fact it is useful on any chart, any timeframe with any setting. If you guys have any issues with it, shoot me a pm or drop a comment. Thanks!
-CheatCode1
BINANCE:BTCUSDT BITSTAMP:ETHUSD BITSTAMP:BTCUSD PEPPERSTONE:JPYX TVC:DXY TVC:NDQ AMEX:SPY

Trend Friendly RSITrend Friendly RSI
Unlike the standard RSI, "Trend Friendly RSI" adapts to the trend. RSI and other momentum-based oscillators cannot give a buy signal in uptrends and a sell signal in downtrends because they do not take into account the momentum of the trend and behave as if the price is in a constant sideways trend. "Trend Friendly RSI", on the other hand, takes into account the momentum of the trend of your chosen length and subtracts it from the current momentum, thus giving more realistic buy and sell signals.
use it to identify your long-term investments and trading entry points for hodl. It would be wise to use this indicator for assets that you have done fundamental analysis and are sure of the trend direction. it doesn't know what the price will do, it just shows the points that are suitable for you.
remember this indicator will fail in horizontal trends.
