First Candle High Low LevelsDescription
The "First Candle High Low Levels" Pine Script indicator is designed to highlight the high and low levels of the first candle of the day on your TradingView chart. It works across different timeframes and specifically handles the Indian stock market trading hours (9:15 AM to 3:30 PM IST). The script draws a box from the start to the end of the trading session, visually marking the price range defined by the first candle of the day. Traders can customize the box's border color, fill color, and line width.
Features
Customizable Timeframe: Users can select the desired timeframe for the first candle (e.g., 5-minute, 15-minute, etc.).
Custom Box Appearance: Options to adjust the border color, fill color, and line width of the drawn box.
Auto Reset for Each New Day: The high and low of the first candle are reset daily to mark the start of the next trading day.
Accurate Market Session Handling: The box is drawn from the start of the first candle to the end of the trading session (3:30 PM IST).
Usage
Adding to Chart: Apply the script by copying it into the Pine Script editor in TradingView. Once added, the script will automatically draw a box representing the high and low of the first candle of the day.
Select Timeframe: You can adjust the First Candle Timeframe input to define which timeframe candle will be used for marking the high and low. For example, if you choose a 5-minute timeframe, the high and low of the first 5-minute candle will be used.
Customization:
Adjust the Border Color and Box Fill Color through the input settings to match your chart's style.
Modify the Box Line Width to make the box lines more or less prominent.
Moving_average

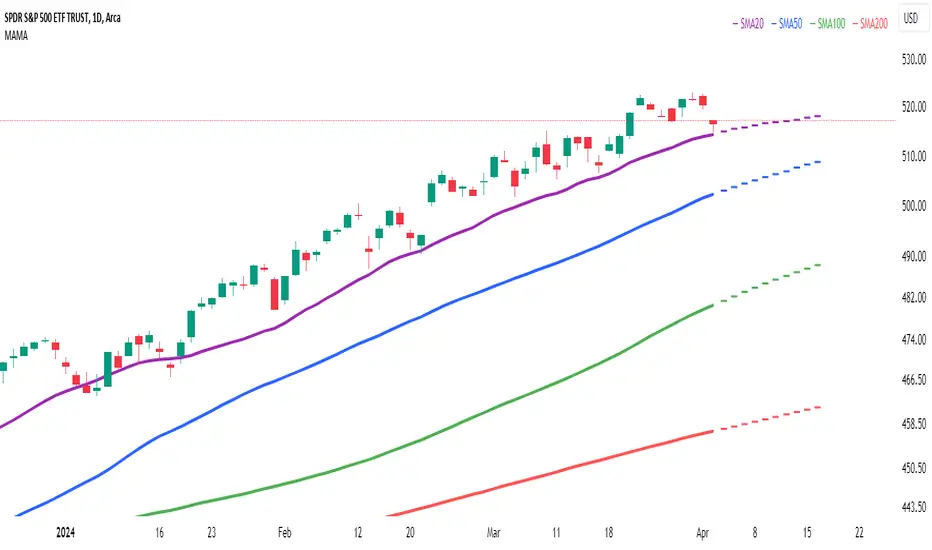
Multi Adaptive Moving Average (MAMA)The Multi Adaptive Moving Average (MAMA) indicator is an advanced tool for technical analysis, designed to provide traders with a detailed understanding of market trends and potential future price movements. This indicator utilizes multiple Simple Moving Averages (SMAs) and forecasting techniques to enhance decision-making processes.
Simple Moving Averages (SMAs):
Short MA (20-period): This moving average is highly responsive to price changes, making it ideal for capturing short-term trends. It helps traders identify quick market shifts and potential entry or exit points.
Mid MA (50-period): This average strikes a balance between short- and long-term trends, offering insights into the market's intermediate direction. It aids in confirming the sustainability of short-term trends.
Long MA (100-period): By smoothing out price data over a longer period, this moving average is useful for identifying long-term trends and filtering out short-term volatility.
Very Long MA (200-period): Often considered a critical indicator for determining the overall market trend, this average helps confirm the direction and strength of long-term movements.
Forecasting:
Flat Forecast: This approach assumes that prices will remain constant in the near future, which is particularly useful in markets trading sideways without a clear trend direction.
Linear Regression Forecast: This method uses historical data to project future price movements, offering a dynamic forecast based on existing trends. It helps traders anticipate potential price changes and plan their strategies accordingly.
Advantages:
Comprehensive Trend Analysis: By incorporating four different SMAs, the indicator provides a layered view of market trends across various timeframes. This enables traders to identify potential trend reversals and continuations with greater accuracy.
Predictive Insights: The forecasting feature offers traders a forward-looking perspective, enabling them to anticipate market movements and adjust their trading strategies proactively. This can be especially advantageous in volatile markets.
Customization: The MAMA indicator is highly customizable, allowing traders to adjust parameters such as the source of price data and the inclusion of the current unclosed candle. This flexibility ensures that the indicator can be tailored to fit different trading styles and market conditions.
Visual Clarity: The use of distinct colors for each SMA and their forecasts enhances visual interpretation, making it easier for traders to quickly assess market conditions and make informed decisions. The inclusion of a legend further aids in distinguishing between the different moving averages and their respective forecasts.
How to Use:
Trend Confirmation: Use the alignment of the SMAs to confirm market trends. For example, when the Short MA crosses above the Mid and Long MAs, it may indicate a bullish trend, while the opposite could suggest a bearish trend.
Entry and Exit Points: Look for crossovers between the SMAs as potential signals for entering or exiting trades. The forecasts can help in timing these decisions by providing an expectation of future price movements.
Risk Management: Utilize the Very Long MA to set stop-loss and take-profit levels, as it reflects the long-term trend and can help in avoiding trades against the prevailing market direction.
The MAMA indicator is intended to support technical analysis and should not be used as the sole basis for making trading decisions. Financial markets are inherently uncertain, and past performance does not guarantee future results. Traders should use this tool in conjunction with other analytical methods and consider their risk tolerance and investment objectives. It is advisable to conduct thorough research and consult with a financial advisor before making significant trading decisions. Always be aware of the risks involved in trading and invest only what you can afford to lose.
lib_no_delayLibrary "lib_no_delay"
This library contains modifications to standard functions that return na before reaching the bar of their 'length' parameter.
That is because they do not compromise speed at current time for correct results in the past. This is good for live trading in short timeframes but killing applications on Monthly / Weekly timeframes if instruments, like in crypto, do not have extensive history (why would you even trade the monthly on a meme coin ... not my decision).
Also, some functions rely on source (value at previous bar), which is not available on bar 1 and therefore cascading to a na value up to the last bar ... which in turn leads to a non displaying indicator and waste of time debugging this)
Anyway ... there you go, let me know if I should add more functions.
sma(source, length)
Parameters:
source (float) : Series of values to process.
length (simple int) : Number of bars (length).
Returns: Simple moving average of source for length bars back.
ema(source, length)
Parameters:
source (float) : Series of values to process.
length (simple int) : Number of bars (length).
Returns: (float) The exponentially weighted moving average of the source.
rma(source, length)
Parameters:
source (float) : Series of values to process.
length (simple int) : Number of bars (length).
Returns: Exponential moving average of source with alpha = 1 / length.
atr(length)
Function atr (average true range) returns the RMA of true range. True range is max(high - low, abs(high - close ), abs(low - close )). This adapted version extends ta.atr to start without delay at first bar and deliver usable data instead of na by averaging ta.tr(true) via manual SMA.
Parameters:
length (simple int) : Number of bars back (length).
Returns: Average true range.
rsi(source, length)
Relative strength index. It is calculated using the ta.rma() of upward and downward changes of source over the last length bars. This adapted version extends ta.rsi to start without delay at first bar and deliver usable data instead of na.
Parameters:
source (float) : Series of values to process.
length (simple int) : Number of bars back (length).
Returns: Relative Strength Index.

Kenji 2.0KenJi 2.0
Class : average analysis/trend following
Trading type : any
Time frame : any
Purpose : work in trend
Level of aggressiveness : any
About Kenji
The Kenji 2.0 indicator represents a fresh perspective on average analysis. Traditional trading strategies and indicators reliant on average analysis often generate a lot of false signals, particularly in flat market conditions characterized by frequent average crossovers and directional changes. Consequently, their efficacy and potency are compromised.
The "Kenji" Indicator overcomes these limitations through a unique algorithm (based on combination of correlation analysis and moving average analysis) designed to circumvent common pitfalls associated with average analysis. By accurately identifying the current market state—indicated by color (red for a downward trend, blue for an uptrend, and green for a flat market)—the Kenji indicator enhances signal quality, enabling traders to navigate local trends comfortably.
This indicator not only generates signals for entering positions at optimal times but also provides guidance on profit-taking. Additionally, it assists in assessing signal aggressiveness, making it a valuable tool for both novice and experienced traders.
Rules of Trading
The rules of trading with the indicator are very simple: when the price enters the buy/sell zone (depicted by a blue/red colored area between the fast and slow averages), a signal to enter a position is generated. This position remains valid until either the market state changes (e.g., a shift from a downtrend to a flat or an uptrend) or a signal to close it appears (indicated by a blue/red cross, signaling a significant divergence between the price and average values).
Structure of the Indicator
The indicator comprises colored zones and level lines:
- Colored zones (marked blue, red, or green) are utilized for identifying trading opportunities and detecting entry points.
- Level lines (marked red and blue depending on the current price direction) are employed to identify whether the current price direction is upward or downward.
To streamline the trading process, the indicator displays "buy" and "sell" signals on the chart.
These signals are categorized into two groups: standard (trading with the basic lot size) and aggressive (trading with double the basic lot size). Additionally, take-profit zones are visualized on the chart using blue/red x-crosses. Red x-crosses indicate zones where profits on "sell" positions should be taken, while blue x-crosses indicate zones where profits on "buy" positions should be taken.
Input Parameters of the Indicator
The indicator utilizes several input parameters for configuration:
Slow Average Period: This parameter determines the period of the slow average. A larger period results in a more conservative response of the average to price changes.
Fast Average Period: This parameter determines the period of the fast average. Similar to the slow average period, a larger period leads to a more conservative response of the average to price changes.
Correlation Period: This parameter is utilized in correlation analysis to calculate the level of interconnection between the averages.
Stop Sensitivity: This parameter determines the take-profit zones displayed on the chart in the form of red/blue x-crosses. A higher parameter value corresponds to a larger take-profit value.
Version 2.0 updates:
Alerts and Notifications are added ("sell" and "buy" signals are sent as Alerts and Notifications).
Improved vizualisation
Improved algorithm (mechanics of stop-loss marks in modified)
Access to the indicator
Please address all questions about this indicator (including access to it) in private messages.

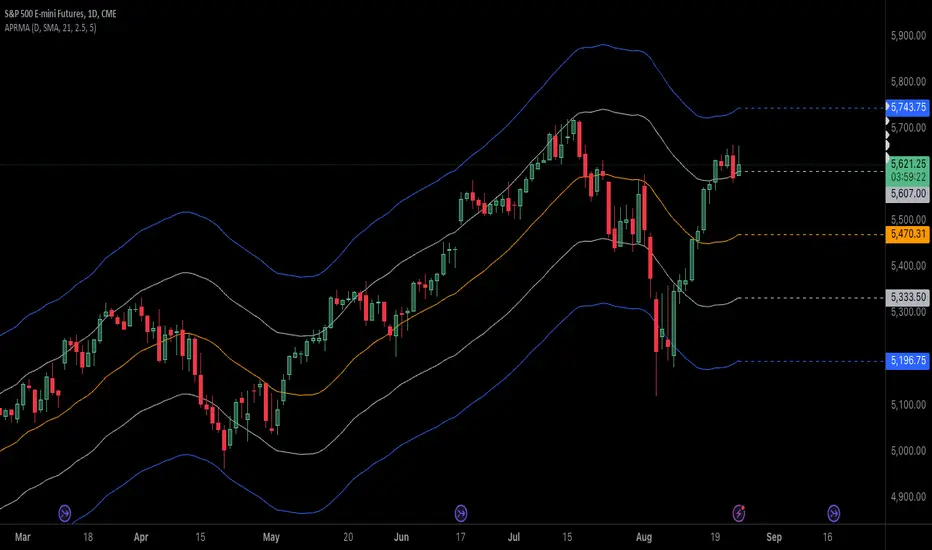
Adjustable Percentage Range Moving AverageAdjustable Percentage Range Moving Average (APRMA)
The Adjustable Percentage Range Moving Average (APRMA) is a technical analysis tool designed for traders and market analysts who seek a dynamic approach to understanding market volatility and trend identification. Unlike traditional moving averages, the APRMA incorporates user-adjustable percentage bands around a central moving average line, offering a customizable view of price action relative to its recent history.
Key Features:
Central Moving Average: At its core, APRMA calculates a moving average (type of your choice) of the price over a specified number of periods, serving as the baseline for the indicator.
Percentage Bands: Surrounding the moving average are four bands, two above and two below, set at user-defined percentages away from the central line. These bands expand and contract based on the percentage input, not on standard deviation like Bollinger Bands, which allows for a consistent visual interpretation of how far the price has moved from its average.
Customizability: Users can adjust:
The length of the moving average period to suit short-term, medium-term, or long-term analysis.
The percentage offset for the bands, enabling traders to set the sensitivity of the indicator according to the asset's volatility or their trading strategy.
Visual Interpretation:
When the price moves towards or beyond the upper band, it might indicate that the asset is potentially overbought or that a strong upward trend is in place.
Conversely, price action near or below the lower band could suggest an oversold condition or a strong downward trend.
The space between the bands can be used to gauge volatility; narrower bands suggest lower current volatility relative to the average, while wider bands indicate higher volatility.
Usage in Trading:
Trend Confirmation: A price staying above the moving average and pushing the upper band might confirm an uptrend, while staying below and testing the lower band could confirm a downtrend.
Reversion Strategies: Traders might look for price to revert to the mean (moving average) when it touches or crosses the bands, setting up potential entry or exit points.
Breakout Signals: A price moving decisively through a band after a period of consolidation within the bands might signal a breakout.
The APRMA provides a clear, adaptable framework for traders to visualize where the price stands in relation to its recent average, offering insights into potential overbought/oversold conditions, trend strength, and volatility, all tailored by the trader's strategic preferences.
Gaussian Kernel Smoothing EMAGaussian Kernel Smoothing EMA
The Gaussian Kernel Smoothing EMA integrates the exponential moving average with kernel smoothing techniques to refine the trend tool. Kernel smoothing is a non-parametric technique used to estimate a smooth curve from a set of data points. It is particularly useful in reducing noise and capturing the underlying structure of data. The smoothed value at each point is calculated as a weighted average of neighboring points, with the weights determined by a kernel function.
The Gaussian kernel is a popular choice in kernel smoothing due to its properties of being smooth, symmetric, and having infinite support. This function gives higher weights to data points closer to the target point and lower weights to those further away, resulting in a smooth and continuous estimate. Since price isn't normally distributed a logarithmic transformation is performed to remove most of its skewness to be able to fit the Gaussian kernel.
This indicator also has a bandwidth, which in kernel smoothing controls the width of the window over which the smoothing is performed. It determines how much influence nearby data points have on the smoothed value. In this indicator, the bandwidth is dynamically adjusted based on the standard deviation of the log-transformed prices so that the smoothing adapts to the underlying variability and potential volatility.
Bandwidth Factor: The bandwidth factor in this indicator is used to adjust the degree of the smoothing applied to the MA. In kernel smoothing, Bandwidth controls the width of the window over which the smoothing is applied. It determines how many data points around a central point are considered when calculating a smooth value. A smaller bandwidth results in less smoothing, while a larger bandwidth smooths out more noise, leading to a broader, more general trend.

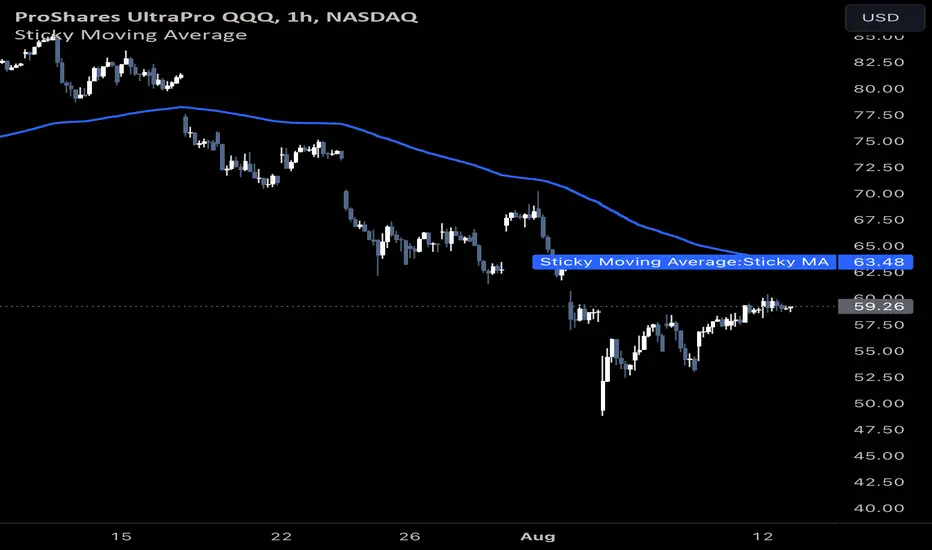
Sticky Moving AverageThe Sticky Moving Average is a custom indicator designed to provide a unique smoothing effect by combining different moving averages derived from a single base period. This indicator creates a single line on the chart, representing the average of the following three moving averages:
1. X-period Simple Moving Average (SMA): A traditional moving average that smooths the price data over the full period.
2. X/2-period Simple Moving Average (SMA): A faster-moving average that smooths the price data over half of the base period.
3. X/4-period Exponential Moving Average (EMA): An exponential moving average that gives more weight to recent prices, calculated over one-fourth of the base period.
The result is a moving average that "sticks" to price action by considering both short-term and long-term trends, offering a balanced view of market momentum.
This indicator is ideal for traders looking to gain a nuanced understanding of price movements by incorporating multiple smoothing periods into a single, easy-to-use line. Adjust the `X` value to suit your trading strategy and enjoy the clarity this composite moving average can bring to your charts.
Market Breadth - AsymmetrikMarket Breadth - Asymmetrik User Manual
Overview
The Market Breadth - Asymmetrik is a script designed to provide insights into the overall market condition by plotting three key indicators based on stocks within the S&P 500 index. It helps traders assess market momentum and strength through visual cues and is especially useful for understanding the proportion of stocks trading above their respective moving averages.
Features
1. Market Breadth Indicators:
- Breadth 20D (green line): Represents the percentage of stocks in the S&P 500 that are above their 20-day moving average.
- Breadth 50D (yellow line): Represents the percentage of stocks in the S&P 500 that are above their 50-day moving average.
- Breadth 100D (red line): Represents the percentage of stocks in the S&P 500 that are above their 100-day moving average.
2. Horizontal Lines for Context:
- Green line at 10%
- Lighter green line at 20%
- Grey line at 50%
- Light red line at 80%
- Dark red line at 90%
3. Background Color Alerts:
- Green background when all three indicators are under 20%, indicating a potential oversold market condition.
- Red background when all three indicators are over 80%, indicating a potential overbought market condition.
Interpreting the Indicator
- Market Breadth Lines: Observe the plotted lines to assess the percentage of stocks above their moving averages.
- Horizontal Lines: Use the horizontal lines to quickly identify important threshold levels.
- Background Colors: Pay attention to background colors for quick insights:
- Green: All indicators suggest a potentially oversold market condition (below 20).
- Red: All indicators suggest a potentially overbought market condition (above 80).
Troubleshooting
- If the indicator does not appear as expected, please contact me.
- This indicator works only on daily and weekly timeframes.
Conclusion
This Market Breadth Indicator offers a visual representation of market momentum and strength through three key indicators, helping you identify potential buying and selling zones.

TradeBuilderOverview
TradeBuilder is an ever-growing toolbox that lets you combine and compound any number of bundled indicators and algorithms to create a compound strategy. At launch, we're including two Moving Averages (SMA, EMA), RSI, and Stochastic Oscillator, with many more to come. You can use any combination of indicators, be it just one, two, or all.
Key Concepts
Indicator Integration: Tradebuilder allows the use of Moving Averages, RSI, and Stochastic Oscillators, with customizable parameters for each. More indicators to come.
Mode Selection : Choose between Confirm Trend Mode (using indicators to confirm trends) and Momentum Mode (using indicators to spot reversals).
Trade Flexibility : Offers options for both long and short trades, enabling diverse trading strategies.
Customizable Inputs : Easily toggle indicators on or off and adjust specific settings like periods and thresholds.
Signal Generation : Combines multiple conditions to generate entry and exit signals.
Input Parameters:
Moving Average (MA):
use_ma : Enable this to include the Moving Average in your strategy.
ma_cross_type : Choose between "Close/MA" (price crossing the MA) or "MA/MA" (one MA crossing another).
ma_length : Set the period for the primary MA.
ma_type : Choose between "SMA" (Simple Moving Average) or "EMA" (Exponential Moving Average).
ma_length2 : Set the period for the secondary MA if using the "MA/MA" cross type.
ma_type2 : Set the type for the secondary MA.
Relative Strength Index (RSI):
use_rsi : Enable this to include RSI in your strategy.
rsi_length : Set the period for RSI calculation.
rsi_overbought : Define the overbought level.
rsi_oversold : Define the oversold level.
Stochastic Oscillator:
use_stoch : Enable this to include the Stochastic Oscillator in your strategy.
stoch_k : Set the %K period.
stoch_d : Set the %D period.
stoch_smooth : Define the smoothing factor.
stoch_overbought : Set the overbought level.
stoch_oversold : Set the oversold level.
Confirmation or Momentum Mode:
confirm_trend : Set this to true to use RSI and Stochastic Oscillator to confirm trends (long when above overbought, short when below oversold). Set to false to trade on momentum (short when above overbought, long when below oversold).
Tip: When set to false and used with just momentum oscillators like Stochastic or RSI, it's geared toward scalping as it essentially becomes momentum trading.
Trade Directions:
trade_long : Enable to allow long trades.
trade_short : Enable to allow short trades.
Example Strategy on E-mini S&P 500 Index Futures ( CME_MINI:ES1! ), 1-minute Chart
Let’s say you want to create a strategy to go long when:
A 5-period SMA crosses above a 100-period EMA.
RSI is above 20.
The Stochastic Oscillator is above 95.
Trend Confirmation Mode is on.
For short:
A 5-period SMA crosses below a 100-period EMA.
RSI is below 45.
The Stochastic Oscillator is below 5.
Trend Confirmation Mode is on.
Here’s how you would set it up in Tradebuilder:
use_ma = true
ma_cross_type = "MA/MA"
ma_length = 5
ma_type = "SMA"
ma_length2 = 100
ma_type2 = "EMA"
use_rsi = true
rsi_length = 14
rsi_overbought = 20
rsi_oversold = 45
use_stoch = true
stoch_k = 8
stoch_d = 1
stoch_smooth = 1
stoch_overbought = 95
stoch_oversold = 5
confirm_trend = true
trade_long = true
trade_short = false
Alerts
Here is how to set TradeBuilder alerts: open a TradingView chart, attach TradeBuilder, right-click on chart -> Add Alert. Condition: Symbol (e.g. NQ) >> TradeBuilder >> Open-Ended Alert >> Once Per Bar Close.
Development Roadmap
We plan to add many more compoundable indicators to TradeBuilder over the coming months from all walks of technical analysis, including Volume, Volatility, Trend Detection/Validation, Momentum, Divergences, Chart Patterns, Support/Resistance Analysis. etc.

SOL & BTC EMA with BTC/SOL Price Difference % and BTC Dom EMAThis script is designed to provide traders with a comprehensive analysis of Solana (SOL) and Bitcoin (BTC) by incorporating Exponential Moving Averages (EMAs) and price difference percentages. It also includes the BTC Dominance EMA to offer insights into the overall market dominance of Bitcoin.
Features:
SOL EMA: Plots the Exponential Moving Average (EMA) for Solana (SOL) based on a customizable period length.
BTC EMA: Plots the Exponential Moving Average (EMA) for Bitcoin (BTC) based on a customizable period length.
BTC Dominance EMA: Plots the Exponential Moving Average (EMA) for BTC Dominance, which helps in understanding Bitcoin's market share relative to other cryptocurrencies.
BTC/SOL Price Difference %: Calculates and plots the percentage difference between BTC and SOL prices, adjusted for their respective EMAs. This helps in identifying relative strength or weakness between the two assets.
Background Highlight: Colors the background to visually indicate whether the BTC/SOL price difference percentage is positive (green) or negative (red), aiding in quick decision-making.
Inputs:
SOL Ticker: Symbol for Solana (default: BINANCE
).
BTC Ticker: Symbol for Bitcoin (default: BINANCE
).
BTC Dominance Ticker: Symbol for Bitcoin Dominance (default: CRYPTOCAP
.D).
EMA Length: The length of the EMA (default: 20 periods).
Usage:
This script is intended for traders looking to analyze the relationship between SOL and BTC, using EMAs to smooth out price data and highlight trends. The BTC/SOL price difference percentage can help traders identify potential trading opportunities based on the relative movements of SOL and BTC.
Note: Leverage trading involves significant risk and may not be suitable for all investors. Ensure you have a good understanding of the market conditions and employ proper risk management techniques.

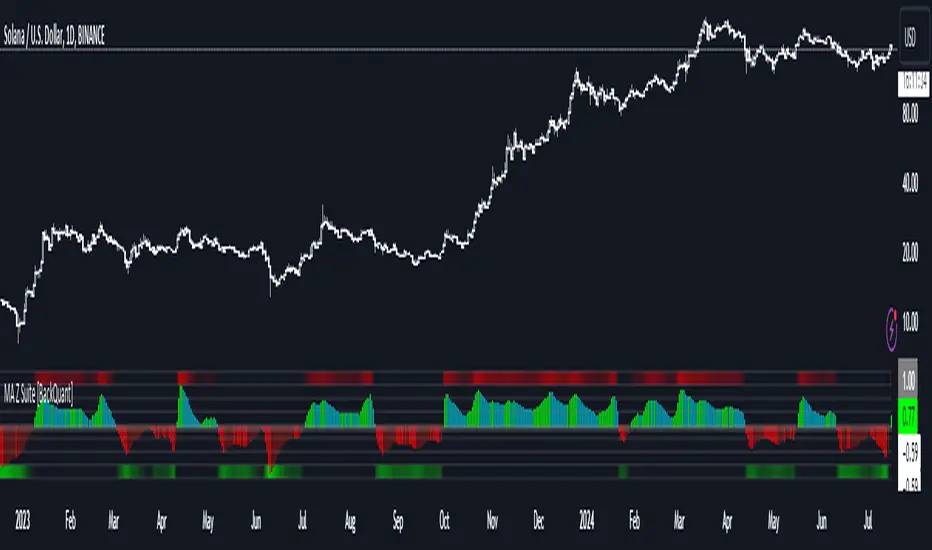
Moving Average Z-Score Suite [BackQuant]Moving Average Z-Score Suite
1. What is this indicator
The Moving Average Z-Score Suite is a versatile indicator designed to help traders identify and capitalize on market trends by utilizing a variety of moving averages. This indicator transforms selected moving averages into a Z-Score oscillator, providing clear signals for potential buy and sell opportunities. The indicator includes options to choose from eleven different moving average types, each offering unique benefits and characteristics. It also provides additional features such as standard deviation levels, extreme levels, and divergence detection, enhancing its utility in various market conditions.
2. What is a Z-Score
A Z-Score is a statistical measurement that describes a value's relationship to the mean of a group of values. It is measured in terms of standard deviations from the mean. For instance, a Z-Score of 1.0 means the value is one standard deviation above the mean, while a Z-Score of -1.0 indicates it is one standard deviation below the mean. In the context of financial markets, Z-Scores can be used to identify overbought or oversold conditions by determining how far a particular value (such as a moving average) deviates from its historical mean.
3. What moving averages can be used
The Moving Average Z-Score Suite allows users to select from the following eleven moving averages:
Simple Moving Average (SMA)
Hull Moving Average (HMA)
Exponential Moving Average (EMA)
Weighted Moving Average (WMA)
Double Exponential Moving Average (DEMA)
Running Moving Average (RMA)
Linear Regression Curve (LINREG) (This script can be found standalone )
Triple Exponential Moving Average (TEMA)
Arnaud Legoux Moving Average (ALMA)
Kalman Hull Moving Average (KHMA)
T3 Moving Average
Each of these moving averages has distinct properties and reacts differently to price changes, allowing traders to select the one that best fits their trading style and market conditions.
4. Why Turning a Moving Average into a Z-Score is Innovative and Its Benefits
Transforming a moving average into a Z-Score is an innovative approach because it normalizes the moving average values, making them more comparable across different periods and instruments. This normalization process helps in identifying extreme price movements and mean-reversion opportunities more effectively. By converting the moving average into a Z-Score, traders can better gauge the relative strength or weakness of a trend and detect potential reversals. This method enhances the traditional moving average analysis by adding a statistical perspective, providing clearer and more objective trading signals.
5. How It Can Be Used in the Context of a Trading System
In a trading system, it can be used to generate buy and sell signals based on the Z-Score values. When the Z-Score crosses above zero, it indicates a potential buying opportunity, suggesting that the price is above its mean and possibly trending upward. Conversely, a Z-Score crossing below zero signals a potential selling opportunity, indicating that the price is below its mean and might be trending downward. Additionally, the indicator's ability to show standard deviation levels and extreme levels helps traders set profit targets and stop-loss levels, improving risk management and trade planning.
6. How It Can Be Used for Trend Following
For trend-following strategies, it can be particularly useful. The Z-Score oscillator helps traders identify the strength and direction of a trend. By monitoring the Z-Score and its rate of change, traders can confirm the persistence of a trend and make informed decisions to enter or exit trades. The indicator's divergence detection feature further enhances trend-following by identifying potential reversals before they occur, allowing traders to capitalize on trend shifts. By providing a clear and quantifiable measure of trend strength, this indicator supports disciplined and systematic trend-following strategies.
No backtests for this indicator due to the many options and ways it can be used,
Enjoy
Stochastic Biquad Band Pass FilterThis indicator combines the power of a biquad band pass filter with the popular stochastic oscillator to provide a unique tool for analyzing price movements.
The Filter Length parameter determines the center frequency of the biquad band pass filter, affecting which frequency band is isolated. Adjusting this parameter allows you to focus on different parts of the price movement spectrum.
The Bandwidth (BW) controls the width of the frequency band in octaves. It represents the bandwidth between -3 dB frequencies for the band pass filter. A narrower bandwidth results in a more focused filtering effect, isolating a tighter range of frequencies.
The %K Length parameter sets the period for the stochastic calculation, determining the range over which the stochastic values are calculated.
The %K Smoothing parameter applies a simple moving average to the %K values to smooth out the oscillator line.
The %D Length parameter sets the period for the %D line, which is a simple moving average of the %K line, providing a signal line for the oscillator.
Key Features of the Stochastic Biquad Band Pass Filter
Biquad filters are known for their smooth response and minimal phase distortion, making them ideal for technical analysis. In this implementation, the biquad filter is configured as a band pass filter, which allows frequencies within a specified band to pass while attenuating frequencies outside this band. This is particularly useful in trading to isolate specific price movements, making it easier to detect patterns and trends within a targeted frequency range.
The stochastic oscillator is a popular momentum indicator that shows the location of the close relative to the high-low range over a set number of periods. Combining it with a biquad band pass filter enhances its effectiveness by focusing on specific frequency bands of price movements.
By incorporating this stochastic biquad band pass filter into your trading toolkit, you can enhance your chart analysis with clearer insights into specific frequency bands of price movements, leading to more informed trading decisions.

Biquad High Pass FilterThis indicator utilizes a biquad high pass filter to filter out low-frequency components from price data, helping traders focus on high-frequency movements and detect rapid changes in trends.
The Length parameter determines the cutoff frequency of the filter, affecting how quickly the filter responds to changes in price. A shorter length allows the filter to react more quickly to high-frequency movements.
The Q Factor controls the sharpness of the filter. A higher Q value results in a more precise filtering effect by narrowing the frequency band. However, be cautious when setting the Q factor too high, as it can induce resonance, amplifying certain frequencies and potentially making the filter less effective by introducing unwanted noise.
Key Features of Biquad Filters
Biquad filters are a type of digital filter that provides a combination of low-pass, high-pass, band-pass, and notch filtering capabilities. In this implementation, the biquad filter is configured as a high pass filter, which allows high-frequency signals to pass while attenuating lower-frequency components. This is particularly useful in trading to highlight rapid price movements, making it easier to spot short-term trends and patterns.
Biquad filters are known for their smooth response and minimal phase distortion, making them ideal for technical analysis. The customizable length and Q factor allow for flexible adaptation to different trading strategies and market conditions. Designed for real-time charting, the biquad filter operates efficiently without significant lag, ensuring timely analysis.
By incorporating this biquad high pass filter into your trading toolkit, you can enhance your chart analysis with clearer insights into rapid price movements, leading to more informed trading decisions.

Biquad Low Pass FilterThis indicator utilizes a biquad low pass filter to smooth out price data, helping traders identify trends and reduce noise in their analysis.
The Length parameter acts as the length of the moving average, determining the smoothness and responsiveness of the filter. Adjusting this parameter changes how quickly the filter reacts to price changes.
The Q Factor controls the sharpness of the filter. A higher Q value results in a narrower frequency band, enhancing the precision of the filter. However, be cautious when setting the Q factor too high, as it can induce resonance, amplifying certain frequencies and potentially making the filter less effective by introducing noise.
Key Features of Biquad Filters
Biquad filters are a type of digital filter that provides a combination of low-pass, high-pass, band-pass, and notch filtering capabilities. In this implementation, the biquad filter is configured as a low pass filter, which allows low-frequency signals to pass while attenuating higher-frequency noise. This is particularly useful in trading to smooth out price data, making it easier to spot underlying trends and patterns.
Biquad filters are known for their smooth response and minimal phase distortion, making them ideal for technical analysis. The customizable length and Q factor allow for flexible adaptation to different trading strategies and market conditions. Designed for real-time charting, the biquad filter operates efficiently without significant lag, ensuring timely analysis.
By incorporating this biquad low pass filter into your trading toolkit, you can enhance your chart analysis with clearer insights into price movements, leading to more informed trading decisions.

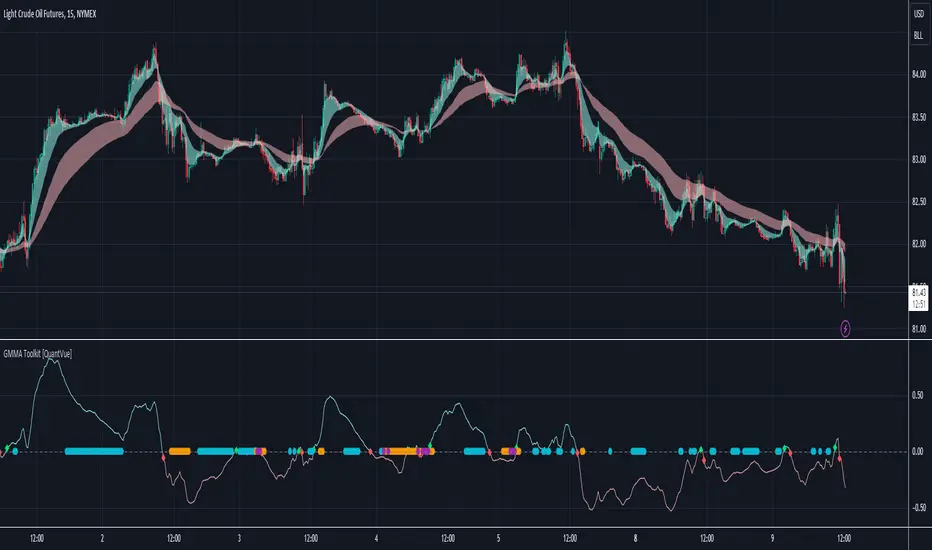
GMMA Toolkit [QuantVue]The GMMA Toolkit is designed to leverage the principles of the Guppy Multiple Moving Average (GMMA). This indicator is equipped with multiple features to help traders identify trends, reversals, and periods of market compression.
The Guppy Multiple Moving Average (GMMA) is a technical analysis tool developed by Australian trader and author Daryl Guppy in the late 1990s.
It utilizes two sets of Exponential Moving Averages (EMAs) to capture both short-term and long-term market trends. The short-term EMAs represent the activity of traders, while the long-term EMAs reflect the behavior of investors.
By analyzing the interaction between these two groups of EMAs, traders can identify the strength and direction of trends, as well as potential reversals.
Due to the nature of GMMA, charts can become cluttered with numerous lines, making analysis challenging.
However, this indicator simplifies visualization by using clouds to represent the short-term and long-term EMA groups, determined by filling the area between the maximum and minimum EMAs in each group.
The GMMA Toolkit goes a step further and includes an oscillator that measures the difference between the average short-term and long-term EMAs, providing a clear visual representation of trend strength and direction.
The farther the oscillator is from the 0 level, the stronger the trend. It is plotted on a separate panel with values above zero indicating bullish conditions and values below zero indicating bearish conditions.
The inclusion of the oscillator in the GMMA Toolkit allows traders to identify earlier buy and sell signals based on the GMMA oscillator crossing the zero line compared to traditional crossover methods.
Lastly, the GMMA Toolkit features compression dots that indicate periods of market consolidation.
By measuring the spread between the maximum and minimum EMAs within both short-term and long-term groups, the indicator identifies when these spreads are significantly narrower than average by comparing the current spread to the average spread over a lookback period.
This visual cue helps traders anticipate potential breakout or breakdown scenarios, enhancing their ability to react to imminent trend changes.
By simplifying the visualization of the Guppy Multiple Moving Averages with clouds, providing earlier buy and sell signals through the oscillator, and highlighting periods of market consolidation with compression dots, this toolkit offers traders insightful tools for navigating market trends and potential reversals.
Give this indicator a BOOST and COMMENT your thoughts below!
We hope you enjoy.
Cheers!
NEXT Volatility-Momentum Moving Average (VolMo MA)Overview
Volatility-Momentum Moving Average (VolMo MA) incorporates two key market dynamics into its price averaging formula: volatility and momentum. Traditional MAs, like EMA, often lag in volatile markets or during strong price moves. By integrating volatility (price range variability) and momentum (rate of price change), we developed a more adaptive and responsive MA.
Key Concepts
Volatility Calculation: Average True Range (ATR) used to quantify market volatility. ATR measures the average price range over a specified period.
Momentum Calculation: Relative Strength Index (RSI) applied to assess market momentum. RSI evaluates the speed and magnitude of price movements.
Moving Average Adjustment: Dynamically weight EMA based on volatility and momentum metrics. When volatility is high, the MA's responsiveness increases. Similarly, strong momentum accelerates the MA adjustment.
Input Parameters:
Length - length of Volatility-Momentum Moving Average (VolMo MA). This input also affects how far back momentum and volatility are considered. Experimentation is highly encouraged.
Sensitivity - controls the Volatility-Momentum adjustment rate applied to the MA. Default is 50, but experimentation is highly encouraged.
Source - data used for calculating the MA, typically Close, but can be used with other price formats and data sources as well. A lot of potential here.
Note: The VolMo MA Indicator plots, both, the Volatility-Momentum Moving Average and EMA for base comparison. You can disable EMA by unticking it under Style tab.
NASDAQ 100 Futures ( CME_MINI:NQ1! ) 1-minute
The following example compares VolMo MA (blue) to EMA (green). Length set to 34, Sensitivity to 40. Notice the difference in responsiveness as price action consolidates and breaks out. The VolMo MA can be used for scalping at lower Length values and 40-60 Sensitivity or as a dynamic support/resistance line at higher Length values.
Alerts
Here is how to set price crossing VolMo MA alerts: open a TradingView chart, attach NEXT NEXT Volatility-Momentum Moving Average (VolMo MA), right-click on chart -> Add Alert. Condition: Symbol (e.g. NQ) >> Crossing >> NEXT Volatility-Momentum Moving Average (VolMo MA) >> VolMo MA >> Once Per Bar Close.
Development Roadmap
Our initial research shows plenty of edge potential for the VolMo MA when used, both, by itself, or interacting with other indicators. To that end, we'll be adding the following features over the next few months:
Visual signal generation via interaction with EMA, price action, and other MAs and indicators - you can already do alerts with TradingView's built-in Alert functionality
Addition of a second, fully configurable VolMo MA for a Double VolMo MA cross strategy
VolMo MA MACD
Automation and Backtesting via Strategy

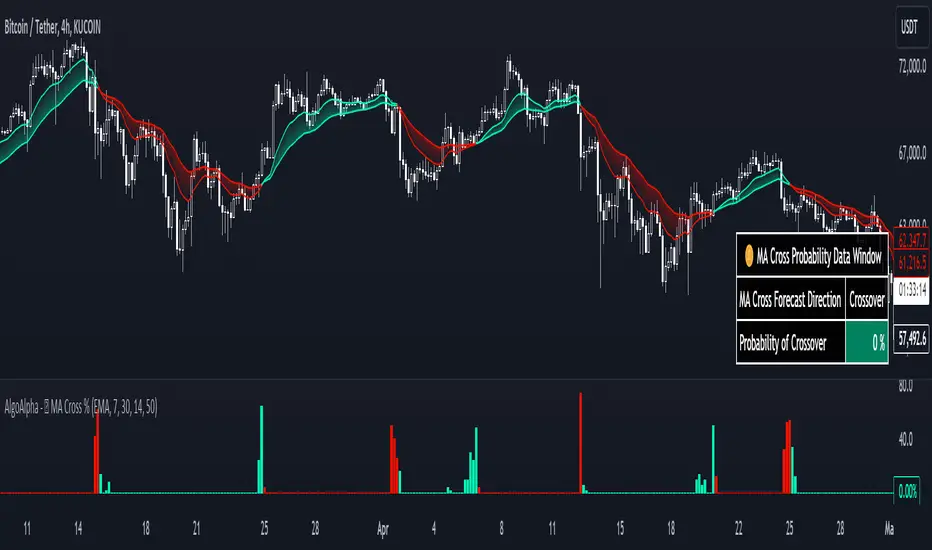
Moving Average Cross Probability [AlgoAlpha]Moving Average Cross Probability 📈✨
The Moving Average Cross Probability by AlgoAlpha calculates the probability of a cross-over or cross-under between the fast and slow values of a user defined Moving Average type before it happens, allowing users to benefit by front running the market.
✨ Key Features:
📊 Probability Histogram: Displays the Probability of MA cross in the form of a histogram.
🔄 Data Table: Displays forecast information for quick analysis.
🎨 Customizable MAs: Choose from various moving averages and customize their length.
🚀 How to Use:
🛠 Add Indicator: Add the indicator to favorites, and customize the settings to suite your trading style.
📊 Analyze Market: Watch the indicator to look for trend shifts early or for trend continuations.
🔔 Set Alerts: Get notified of bullish/bearish points.
✨ How It Works:
The Moving Average Cross Probability Indicator by AlgoAlpha determines the probability by looking at a probable range of values that the price can take in the next bar and finds out what percentage of those possibilities result in the user defined moving average crossing each other. This is done by first using the HMA to predict what the next price value will be, a standard deviation based range is then calculated. The range is divided by the user defined resolution and is split into multiple levels, each of these levels represent a possible value for price in the next bar. These possible predicted values are used to calculate the possible MA values for both the fast and slow MAs that may occur in the next bar and are then compared to see how many of those possible MA results end up crossing each other.
Stay ahead of the market with the Moving Average Cross Probability Indicator AlgoAlpha! 📈💡
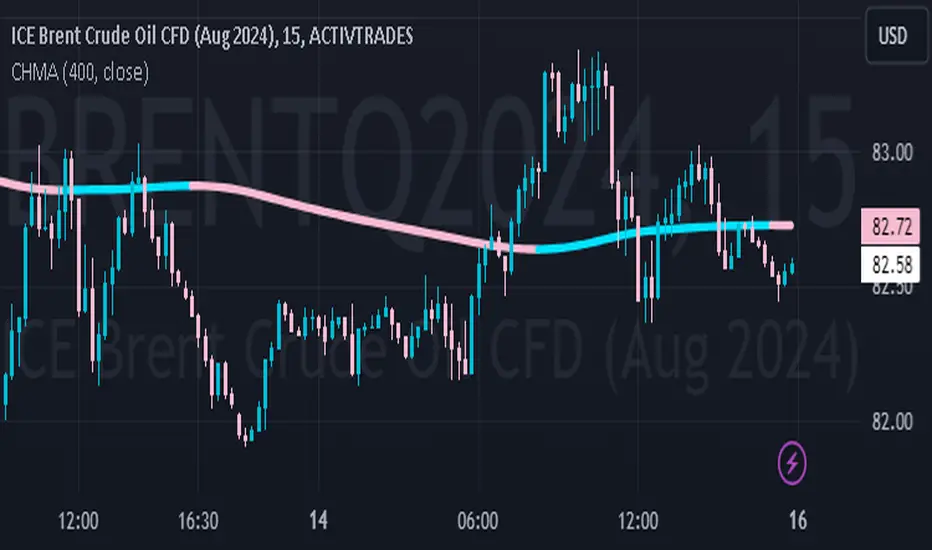
Color Hull Moving AverageDescription:
The Color Hull Moving Average (CHMA) is a technical indicator designed to smooth and remove lag from traditional moving averages, making it more responsive to price movements. This indicator automatically adjusts the color of the moving average to green when it is rising and red when it is falling, helping to identify trends in a more visual and sophisticated way.
Characteristics:
Period: User configurable (default: 20)
Data Source: Can be applied to any price series, such as closing, opening, high, low, etc.
Dynamic Colors: The HMA line changes color based on its direction, making it easy to see trends.
Green: Uptrend
Red: Downtrend
How to use:
Period Configuration: Adjust the period to improve improvements and reactivity according to the asset and timeframe analyzed.
Color Interpretation: Use color changes to identify inflection points in the market.
Combination with Other Indicators: The HMA can be combined with other technical indicators to validate entry and exit signals.
Warning: Although HMA is a powerful tool, we recommend using it in conjunction with other forms of analysis for best results.
Dickey-Fuller Test for Mean Reversion and Stationarity **IF YOU NEED EXTRA SPECIAL HELP UNDERSTANDING THIS INDICATOR, GO TO THE BOTTOM OF THE DESCRIPTION FOR AN EVEN SIMPLER DESCRIPTION**
Dickey Fuller Test:
The Dickey-Fuller test is a statistical test used to determine whether a time series is stationary or has a unit root (a characteristic of a time series that makes it non-stationary), indicating that it is non-stationary. Stationarity means that the statistical properties of a time series, such as mean and variance, are constant over time. The test checks to see if the time series is mean-reverting or not. Many traders falsely assume that raw stock prices are mean-reverting when they are not, as evidenced by many different types of statistical models that show how stock prices are almost always positively autocorrelated or statistical tests like this one, which show that stock prices are not stationary.
Note: This indicator uses past results, and the results will always be changing as new data comes in. Just because it's stationary during a rare occurrence doesn't mean it will always be stationary. Especially in price, where this would be a rare occurrence on this test. (The Test Statistic is below the critical value.)
The indicator also shows the option to either choose Raw Price, Simple Returns, or Log Returns for the test.
Raw Prices:
Stock prices are usually non-stationary because they follow some type of random walk, exhibiting positive autocorrelation and trends in the long term.
The Dickey-Fuller test on raw prices will indicate non-stationary most of the time since prices are expected to have a unit root. (If the test statistic is higher than the critical value, it suggests the presence of a unit root, confirming non-stationarity.)
Simple Returns and Log Returns:
Simple and log returns are more stationary than prices, if not completely stationary, because they measure relative changes rather than absolute levels.
This test on simple and log returns may indicate stationary behavior, especially over longer periods. (The test statistic being below the critical value suggests the absence of a unit root, indicating stationarity.)
Null Hypothesis (H0): The time series has a unit root (it is non-stationary).
Alternative Hypothesis (H1): The time series does not have a unit root (it is stationary)
Interpretation: If the test statistic is less than the critical value, we reject the null hypothesis and conclude that the time series is stationary.
Types of Dickey-Fuller Tests:
1. (What this indicator uses) Standard Dickey-Fuller Test:
Tests the null hypothesis that a unit root is present in a simple autoregressive model.
This test is used for simple cases where we just want to check if the series has a consistent statistical property over time without considering any trends or additional complexities.
It examines the relationship between the current value of the series and its previous value to see if the series tends to drift over time or revert to the mean.
2. Augmented Dickey-Fuller (ADF) Test:
Tests for a unit root while accounting for more complex structures like trends and higher-order correlations in the data.
This test is more robust and is used when the time series has trends or other patterns that need to be considered.
It extends the regular test by including additional terms to account for the complexities, and this test may be more reliable than the regular Dickey-Fuller Test.
For things like stock prices, the ADF would be more appropriate because stock prices are almost always trending and positively autocorrelated, while the Dickey-Fuller Test is more appropriate for more simple time series.
Critical Values
This indicator uses the following critical values that are essential for interpreting the Dickey-Fuller test results. The critical values depend on the chosen significance levels:
1% Significance Level: Critical value of -3.43.
5% Significance Level: Critical value of -2.86.
10% Significance Level: Critical value of -2.57.
These critical values are thresholds that help determine whether to reject the null hypothesis of a unit root (non-stationarity). If the test statistic is less than (or more negative than) the critical value, it indicates that the time series is stationary. Conversely, if the test statistic is greater than the critical value, the series is considered non-stationary.
This indicator uses a dotted blue line by default to show the critical value. If the test-static, which is the gray column, goes below the critical value, then the test-static will become yellow, and the test will indicate that the time series is stationary or mean reverting for the current period of time.
What does this mean?
This is the weekly chart of BTCUSD with the Dickey-Fuller Test, with a length of 100 and a critical value of 1%.
So basically, in the long term, mean-reversion strategies that involve raw prices are not a good idea. You don't really need a statistical test either for this; just from seeing the chart itself, you can see that prices in the long term are trending and no mean reversion is present.
For the people who can't understand that the gray column being above the blue dotted line means price doesn't mean revert, here is a more simple description (you know you are):
Average (I have to include the meaning because they may not know what average is): The middle number is when you add up all the numbers and then divide by how many numbers there are. EX: If you have the numbers 2, 4, and 6, you add them up to get 12, and then divide by 3 (because there are 3 numbers), so the average is 4. It tells you what a typical number is in a group of numbers.
This indicator checks if a time series (like stock prices) tends to return to its average value or time.
Raw prices, which is just the regular price chart, are usually not mean-reverting (It's "always" positively autocorrelating but this group of people doesn't like that word). Price follows trends.
Simple returns and log returns are more likely to have periods of mean reversion.
How to use it:
Gray Column (the gray bars) Above the Blue Dotted Line: The price does not mean revert (non-stationary).
Gray Column Below Blue Line: The time series mean reverts (stationary)
So, if the test statistic (gray column) is below the critical value, which is the blue dotted line, then the series is stationary and mean reverting, but if it is above the blue dotted line, then the time series is not stationary or mean reverting, and strategies involving mean reversion will most likely result in a loss given enough occurrences.

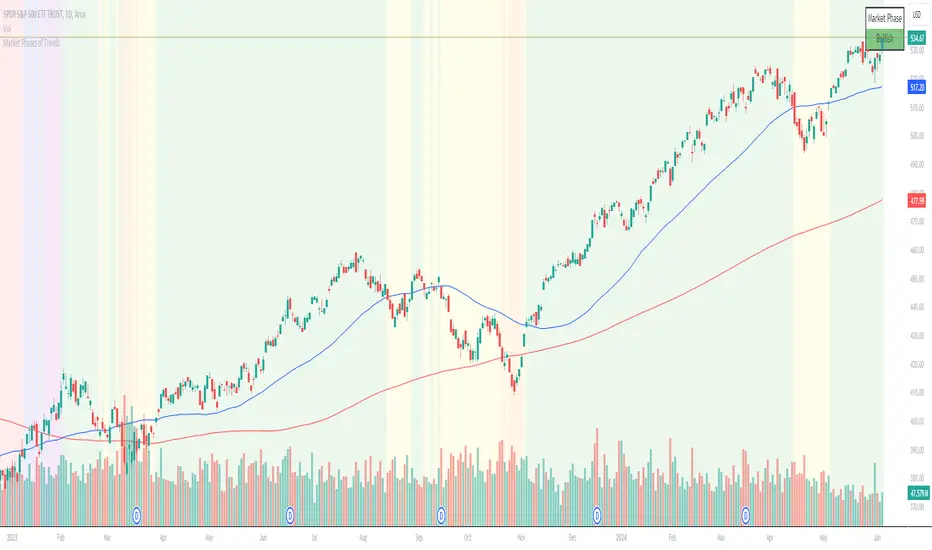
Chuck Dukas Market Phases of Trends (based on 2 Moving Averages)This script is based on the article “Defining The Bull And The Bear” by Chuck Duckas, published in Stocks & Commodities V. 25:13 (14-22); (S&C Bonus Issue, 2007).
The article “Defining The Bull And The Bear” discusses the concepts of “bullish” and “bearish” in relation to the price behavior of financial instruments. Chuck Dukas explains the importance of analyzing price trends and provides a framework for categorizing price activity into six phases. These phases, including recovery, accumulation, bullish, warning, distribution, and bearish, help to assess the quality of the price structure and guide decision-making in trading. Moving averages are used as tools for determining the context preceding the current price action, and the slope of a moving average is seen as an indicator of trend and price phase analysis.
The six phases of trends
// Definitions of Market Phases
recovery_phase = src > ma050 and src < ma200 and ma050 < ma200 // color: blue
accumulation_phase = src > ma050 and src > ma200 and ma050 < ma200 // color: purple
bullish_phase = src > ma050 and src > ma200 and ma050 > ma200 // color: green
warning_phase = src < ma050 and src > ma200 and ma050 > ma200 // color: yellow
distribution_phase = src < ma050 and src < ma200 and ma050 > ma200 // color: orange
bearish_phase = src < ma050 and src < ma200 and ma050 < ma200 // color red
Recovery Phase : This phase marks the beginning of a new trend after a period of consolidation or downtrend. It is characterized by the gradual increase in prices as the market starts to recover from previous losses.
Accumulation Phase : In this phase, the market continues to build a base as prices stabilize before making a significant move. It is a period of consolidation where buying and selling are balanced.
Bullish Phase : The bullish phase indicates a strong upward trend in prices with higher highs and higher lows. It is a period of optimism and positive sentiment in the market.
Warning Phase : This phase occurs when the bullish trend starts to show signs of weakness or exhaustion. It serves as a cautionary signal to traders and investors that a potential reversal or correction may be imminent.
Distribution Phase : The distribution phase is characterized by the market topping out as selling pressure increases. It is a period where supply exceeds demand, leading to a potential shift in trend direction.
Bearish Phase : The bearish phase signifies a strong downward trend in prices with lower lows and lower highs. It is a period of pessimism and negative sentiment in the market.
These rules of the six phases outline the cyclical nature of market trends and provide traders with a framework for understanding and analyzing price behavior to make informed trading decisions based on the current market phase.
60-period channel
The 60-period channel should be applied differently in each phase of the market cycle.
Recovery Phase : In this phase, the 60-period channel can help identify the beginning of a potential uptrend as price stabilizes or improves. Traders can look for new highs frequently in the 60-period channel to confirm the trend initiation or continuation.
Accumulation Phase : During the accumulation phase, the 60-period channel can highlight that the current price is sufficiently strong to be above recent price and longer-term price. Traders may observe new highs frequently in the 60-period channel as the slope of the 50-period moving average (SMA) trends upwards while the 200-period moving average (SMA) slope is losing its downward slope.
Bullish Phase : In the bullish phase, the 60-period channel showing a series of higher highs is crucial for confirming the uptrend. Additionally, traders should observe an upward-sloping 50-period SMA above an upward-sloping 200-period SMA for further validation of the bullish phase.
Warning Phase : When in the warning phase, the 60-period channel can provide insights into whether the current price is weaker than recent prices. Traders should pay attention to the relationship between the price close, the 50-period SMA, and the 200-period SMA to gauge the strength of the phase.
Distribution Phase : In the distribution phase, traders should look for new lows frequently in the 60-period channel, hinting at a weakening trend. It is crucial to observe that the 50-period SMA is still above the 200-period SMA in this phase.
Bearish Phase : Lastly, in the bearish phase, the 60-period channel reflecting a series of lower lows confirms the downtrend. Traders should also note that the price close is below both the 50-period SMA and the 200-period SMA, with the relationship of the 50-period SMA being less than the 200-period SMA.
By carefully analyzing the 60-period channel in each phase, traders can better understand market trends and make informed decisions regarding their investments.
Volume-Enhanced Momentum Moving Average (VEMMA)Volume-Enhanced Momentum Moving Average (VEMMA)
Overview:
The Volume-Enhanced Momentum Moving Average (VEMMA) helps you spot market trends by combining momentum and volume as a moving average. This unique moving average adjusts itself based on the strength and activity of the market, giving you a clearer picture of what’s happening.
How It Works:
1. Key Settings (all of these are adjustable in the settings panel of the indicator):
◦ Base Length: Looks back over the last 50 days by default.
◦ Momentum Length: Uses the past 14 days to measure market strength.
◦ Volume Length: Uses the past 30 days to average trading volume.
◦ High/Low Thresholds: Considers RSI values above 70 as high momentum and below 30 as low momentum.
2. Momentum and Volume:
◦ Momentum: Calculated using the Relative Strength Index (RSI) to see if the market is gaining or losing strength.
◦ Volume: Average trading volume is calculated over the last 30 days to gauge trading activity.
3. VEMMA Calculation:
◦ For each of the past 50 days:
▪ Check Momentum: If RSI > 70, it’s high momentum; if RSI < 30, it’s low.
▪ Weight by Volume: High momentum days with high volume get more weight; low momentum days get less.
▪ Combine: Multiply the closing price by this weight and sum it up.
◦ Average: Divide the total by 50 to get the VEMMA value.
4. Visuals:
◦ Lines: Two lines, VEMMA1 (blue) and VEMMA2 (orange), show the adjusted moving averages.
◦ Colours: Background colors help you quickly spot high (green) and low (red) momentum periods.
How to Use:
• Spot Trends: Rising VEMMA lines suggest an uptrend; falling lines suggest a downtrend.
• Confirm Signals: When both VEMMA1 and VEMMA2 move together, it indicates a strong trend.
• Identify Reversals: Watch for background color changes from green to red or vice versa to catch potential trend reversals.
If the market has been strong and active, the VEMMA line will rise more sharply. If the market is weak and quiet, the line will be smoother.
Benefits:
• Integrated View: Combines market strength and trading activity for a fuller picture.
• Responsive: Adapts to significant market changes, highlighting key movements.
• Easy to Read: Clear visuals with color-coded backgrounds make interpretation simple.
Remember, just like any other indicator, this is not supposed to be used alone. Use it as part of your greater trading strategy. I do however believe it works exceptionally well for finding longer term trends early. The default VEMMA settings work very well as replacement for the EMA 200. Try it and see how it goes. Play around with the settings. Feedback appreciated.

Wall Street Cheat Sheet IndicatorThe Wall Street Cheat Sheet Indicator is a unique tool designed to help traders identify the psychological stages of the market cycle based on the well-known Wall Street Cheat Sheet. This indicator integrates moving averages and RSI to dynamically label market stages, providing clear visual cues on the chart.
Key Features:
Dynamic Stage Identification: The indicator automatically detects and labels market stages such as Disbelief, Hope, Optimism, Belief, Thrill, Euphoria, Complacency, Anxiety, Denial, Panic, Capitulation, Anger, and Depression. These stages are derived from the emotional phases of market participants, helping traders anticipate market movements.
Technical Indicators: The script uses two key technical indicators:
200-day Simple Moving Average (SMA): Helps identify long-term market trends.
50-day Simple Moving Average (SMA): Aids in recognizing medium-term trends.
Relative Strength Index (RSI): Assesses the momentum and potential reversal points based on overbought and oversold conditions.
Clear Visual Labels: The current market stage is displayed directly on the chart, making it easy to spot trends and potential turning points.
Usefulness:
This indicator is not just a simple mashup of existing tools. It uniquely combines the concept of market psychology with practical technical analysis tools (moving averages and RSI). By labeling the psychological stages of the market cycle, it provides traders with a deeper understanding of market sentiment and potential future movements.
How It Works:
Disbelief: Detected when the price is below the 200-day SMA and RSI is in the oversold territory, indicating a potential bottom.
Hope: Triggered when the price crosses above the 50-day SMA, with RSI starting to rise but still below 50, suggesting an early uptrend.
Optimism: Occurs when the price is above the 50-day SMA and RSI is between 50 and 70, indicating a strengthening trend.
Belief: When the price is well above the 50-day SMA and RSI is between 70 and 80, showing strong bullish momentum.
Thrill and Euphoria: Identified when RSI exceeds 80, indicating overbought conditions and potential for a peak.
Complacency to Depression: These stages are identified based on price corrections and drops relative to moving averages and declining RSI values.
Best Practices:
High-Time Frame Focus: This indicator works best on high-time frame charts, specifically the 1-week Bitcoin (BTCUSDT) chart. The longer time frame provides a clearer picture of the overall market cycle and reduces noise.
Trend Confirmation: Use in conjunction with other technical analysis tools such as trendlines, Fibonacci retracement levels, and support/resistance zones for more robust trading strategies.
How to Use:
Add the Indicator: Apply the Wall Street Cheat Sheet Indicator to your TradingView chart.
Analyze Market Stages: Observe the dynamic labels indicating the current stage of the market cycle.
Make Informed Decisions: Use the insights from the indicator to time your entries and exits, aligning your trades with the market sentiment.
This indicator is a valuable tool for traders looking to understand market psychology and make informed trading decisions based on the stages of the market cycle.

Global Financial IndexIntroducing the "Global Financial Index" indicator on TradingView, a meticulously crafted tool derived from extensive research aimed at providing the most comprehensive assessment of a company's financial health, profitability, and valuation. Developed with the discerning trader and investor in mind, this indicator amalgamates a diverse array of financial metrics, meticulously weighted and balanced to yield optimal results.
Financial Strength:
Financial strength is a cornerstone of a company's stability and resilience in the face of economic challenges. It encompasses various metrics that gauge the company's ability to meet its financial obligations, manage its debt, and generate sustainable profits. In our Global Financial Index indicator, the evaluation of financial strength is meticulously crafted to provide investors with a comprehensive understanding of a company's fiscal robustness. Let's delve into the key components and the rationale behind their inclusion:
1. Current Ratio:
The Current Ratio serves as a vital indicator of a company's liquidity position by comparing its current assets to its current liabilities.
A ratio greater than 1 indicates that the company possesses more short-term assets than liabilities, suggesting a healthy liquidity position and the ability to meet short-term obligations promptly.
By including the Current Ratio in our evaluation, we emphasize the importance of liquidity management in sustaining business operations and weathering financial storms.
2. Debt to Equity Ratio:
The Debt to Equity Ratio measures the proportion of a company's debt relative to its equity, reflecting its reliance on debt financing versus equity financing.
A higher ratio signifies higher financial risk due to increased debt burden, potentially leading to liquidity constraints and solvency issues.
Incorporating the Debt to Equity Ratio underscores the significance of balancing debt levels to maintain financial stability and mitigate risk exposure.
3. Interest Coverage Ratio:
The Interest Coverage Ratio assesses a company's ability to service its interest payments with its operating income.
A higher ratio indicates a healthier financial position, as it implies that the company generates sufficient earnings to cover its interest expenses comfortably.
By evaluating the Interest Coverage Ratio, we gauge the company's capacity to manage its debt obligations without compromising its profitability or sustainability.
4. Altman Z-Score:
The Altman Z-Score, developed by Edward Altman, is a composite metric that predicts the likelihood of a company facing financial distress or bankruptcy within a specific timeframe.
It considers multiple financial ratios, including liquidity, profitability, leverage, and solvency, to provide a comprehensive assessment of a company's financial health.
The Altman Z-Score categorizes companies into distinct risk groups, allowing investors to identify potential warning signs and make informed decisions regarding investment or credit exposure.
By integrating the Altman Z-Score, we offer a nuanced perspective on a company's financial viability and resilience in turbulent market conditions.
Profitability Rank:
Profitability rank is a crucial aspect of investment analysis that evaluates a company's ability to generate profits relative to its peers and industry benchmarks. It involves assessing various profitability metrics to gauge the efficiency and effectiveness of a company's operations and management. In our Global Financial Index indicator, the profitability rank segment is meticulously designed to provide investors with a comprehensive understanding of a company's profitability dynamics. Let's delve into the key components and rationale behind their inclusion:
1. Return on Equity (ROE):
Return on Equity measures a company's net income generated relative to its shareholders' equity.
A higher ROE indicates that a company is generating more profits with its shareholders' investment, reflecting efficient capital utilization and strong profitability.
By incorporating ROE, we assess management's ability to generate returns for shareholders and evaluate the overall profitability of the company's operations.
2. Gross Profit Margin:
Gross Profit Margin represents the percentage of revenue retained by a company after accounting for the cost of goods sold (COGS).
A higher gross profit margin indicates that a company is effectively managing its production costs and pricing strategies, leading to greater profitability.
By analyzing gross profit margin, we evaluate a company's pricing power, cost efficiency, and competitive positioning within its industry.
3. Operating Profit Margin:
Operating Profit Margin measures the percentage of revenue that remains after deducting operating expenses, such as salaries, rent, and utilities.
A higher operating profit margin signifies that a company is efficiently managing its operating costs and generating more profit from its core business activities.
By considering operating profit margin, we assess the underlying profitability of a company's operations and its ability to generate sustainable earnings.
4. Net Profit Margin:
Net Profit Margin measures the percentage of revenue that remains as net income after deducting all expenses, including taxes and interest.
A higher net profit margin indicates that a company is effectively managing its expenses and generating greater bottom-line profitability.
By analyzing net profit margin, we evaluate the overall profitability and financial health of a company, taking into account all expenses and income streams.
Valuation Rank:
Valuation rank is a fundamental aspect of investment analysis that assesses the attractiveness of a company's stock price relative to its intrinsic value. It involves evaluating various valuation metrics to determine whether a stock is undervalued, overvalued, or fairly valued compared to its peers and the broader market. In our Global Financial Index indicator, the valuation rank segment is meticulously designed to provide investors with a comprehensive perspective on a company's valuation dynamics. Let's explore the key components and rationale behind their inclusion:
1. Price-to-Earnings (P/E) Ratio:
The Price-to-Earnings ratio is a widely used valuation metric that compares a company's current stock price to its earnings per share (EPS).
A lower P/E ratio may indicate that the stock is undervalued relative to its earnings potential, while a higher ratio may suggest overvaluation.
By incorporating the P/E ratio, we offer insight into market sentiment and investor expectations regarding a company's future earnings growth prospects.
2. Price-to-Book (P/B) Ratio:
The Price-to-Book ratio evaluates a company's market value relative to its book value, which represents its net asset value per share.
A P/B ratio below 1 may indicate that the stock is trading at a discount to its book value, potentially signaling an undervalued opportunity.
Conversely, a P/B ratio above 1 may suggest overvaluation, as investors are paying a premium for the company's assets.
By considering the P/B ratio, we assess the market's perception of a company's tangible asset value and its implications for investment attractiveness.
3. Dividend Yield:
Dividend Yield measures the annual dividend income received from owning a stock relative to its current market price.
A higher dividend yield may indicate that the stock is undervalued or that the company is returning a significant portion of its profits to shareholders.
Conversely, a lower dividend yield may signal overvaluation or a company's focus on reinvesting profits for growth rather than distributing them as dividends.
By analyzing dividend yield, we offer insights into a company's capital allocation strategy and its implications for shareholder returns and valuation.
4. Discounted Cash Flow (DCF) Analysis:
Discounted Cash Flow analysis estimates the present value of a company's future cash flows, taking into account the time value of money.
By discounting projected cash flows back to their present value using an appropriate discount rate, DCF analysis provides a fair value estimate for the company's stock.
Comparing the calculated fair value to the current market price allows investors to assess whether the stock is undervalued, overvalued, or fairly valued.
By integrating DCF analysis, we offer a rigorous framework for valuing stocks based on their underlying cash flow generation potential.
Earnings Transparency:
Mitigating the risk of fraudulent financial reporting is crucial for investors. The indicator incorporates the Beneish M-Score, a robust model designed to detect earnings manipulation or financial irregularities. By evaluating various financial ratios and metrics, this component provides valuable insights into the integrity and transparency of a company's financial statements, aiding investors in mitigating potential risks.
Overall Score:
The pinnacle of the "Global Financial Index" is the Overall Score, a comprehensive amalgamation of financial strength, profitability, valuation, and manipulation risk, further enhanced by the inclusion of the Piotroski F-Score. This holistic score offers investors a succinct assessment of a company's overall health and investment potential, facilitating informed decision-making.
The weighting and balancing of each metric within the indicator have been meticulously calibrated to ensure accuracy and reliability. By amalgamating these diverse metrics, the "Global Financial Index" empowers traders and investors with a powerful tool for evaluating investment opportunities with confidence and precision.
This indicator is provided for informational purposes only and does not constitute financial advice, investment advice, or any other type of advice. The information provided by this indicator should not be relied upon for making investment decisions. Trading and investing in financial markets involves risk, and you should carefully consider your financial situation and consult with a qualified financial advisor before making any investment decisions. Past performance is not necessarily indicative of future results. The creator of this indicator makes no representations or warranties of any kind, express or implied, about the completeness, accuracy, reliability, suitability, or availability with respect to the indicator or the information contained herein. Any reliance you place on such information is therefore strictly at your own risk. By using this indicator, you agree to assume full responsibility for any and all gains and losses, financial, emotional, or otherwise, experienced, suffered, or incurred by you.
