Pivot Point+ Supertrend + EMA + Support/Resistance- LAXMANTAK98
Pivot Point Supertrend with EMA and Support/Resistance Indicator
This custom trading indicator combines the following key components to assist in market analysis and trade decision-making:
Pivot Points:
Pivot points are calculated based on a chosen price source (High, Low, Open, or Close). These levels are used to determine potential support and resistance zones.
Pivot Highs (Resistance) and Pivot Lows (Support) are plotted as labels on the chart for easy identification.
Supertrend Indicator:
The Supertrend is a trend-following indicator that helps to identify bullish or bearish trends.
It uses the Average True Range (ATR) to calculate dynamic support/resistance levels, with adjustable settings for ATR length and multiplier factor.
The trend direction is visually represented by green (bullish) and red (bearish) lines on the chart.
Exponential Moving Averages (EMA):
The indicator plots up to four EMAs with user-defined periods (e.g., 9, 21, 50, 200).
EMAs are commonly used to smooth out price data and identify trends over various timeframes.
Support and Resistance Levels:
Based on Pivot Points, support and resistance levels are plotted using crosses on the chart.
These levels indicate possible price reversal points, helping traders spot key zones for entry and exit.
Visual Alerts:
The indicator includes built-in alerts for trend changes and potential buy/sell signals based on the transition between uptrend and downtrend states.
This combined indicator allows traders to analyze trends, identify key levels for trading, and make more informed decisions by integrating Pivot Points, Supertrend, EMAs, and Support/Resistance in one cohesive system.
Movingavarage

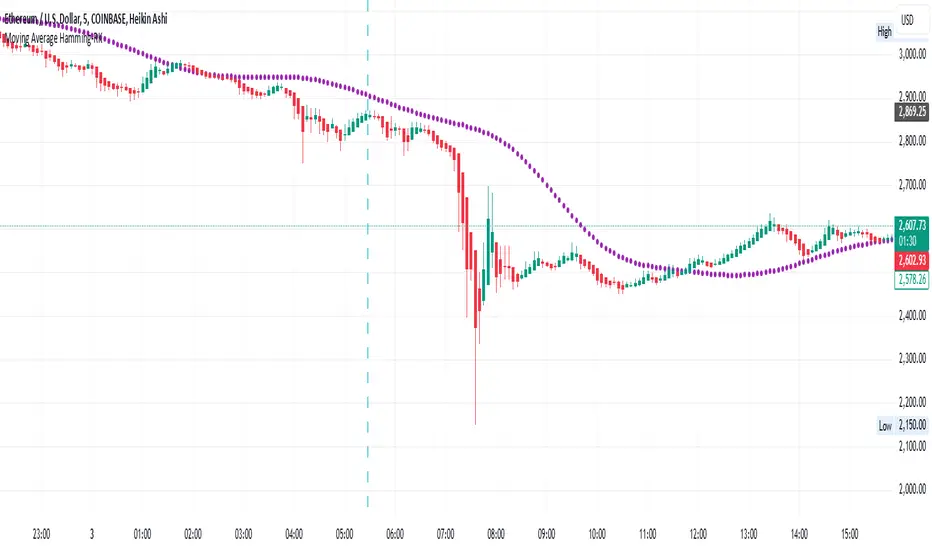
Moving Average Hamming-RKMoving Average Hamming
Description:
A Moving Average using a Hamming window is a technique used in technical analysis to smooth price data. The Hamming window applies weighted smoothing, reducing sharp variations and edge effects in the data. This helps in identifying trends more effectively while minimizing noise.
It can be used in combination with other technical indicators for better market analysis.
Technical Use:
The Hamming Moving Average reduces high-frequency noise, making trends clearer.
It applies different weights to data points, giving more importance to the center of the window while reducing the impact of abrupt changes.
This method is particularly useful in trend-following strategies as it minimizes false breakouts.
It can also be integrated into algorithmic trading systems for improved price fluctuation filtering.
When to Take a Position:
Buy Signal: When the price crosses above the Hamming Moving Average, indicating a potential uptrend.
Sell Signal: When the price crosses below the Hamming Moving Average, signaling a possible downtrend.
Confirmation: Combine with other indicators like RSI or MACD to confirm the trend before entering a trade.
Avoid Choppy Markets: The indicator works best in trending markets; avoid using it in sideways or ranging conditions.
This approach helps traders refine their analysis, making informed decisions while reducing market noise.
Johnny's Machine Learning Moving Average (MLMA) w/ Trend Alerts📖 Overview
Johnny's Machine Learning Moving Average (MLMA) w/ Trend Alerts is a powerful adaptive moving average indicator designed to capture market trends dynamically. Unlike traditional moving averages (e.g., SMA, EMA, WMA), this indicator incorporates volatility-based trend detection, Bollinger Bands, ADX, and RSI, offering a comprehensive view of market conditions.
The MLMA is "machine learning-inspired" because it adapts dynamically to market conditions using ATR-based windowing and integrates multiple trend strength indicators (ADX, RSI, and volatility bands) to provide an intelligent moving average calculation that learns from recent price action rather than being static.
🛠 How It Works
1️⃣ Adaptive Moving Average Selection
The MLMA automatically selects one of four different moving averages:
📊 EMA (Exponential Moving Average) – Reacts quickly to price changes.
🔵 HMA (Hull Moving Average) – Smooth and fast, reducing lag.
🟡 WMA (Weighted Moving Average) – Gives recent prices more importance.
🔴 VWAP (Volume Weighted Average Price) – Accounts for volume impact.
The user can select which moving average type to use, making the indicator customizable based on their strategy.
2️⃣ Dynamic Trend Detection
ATR-Based Adaptive Window 📏
The Average True Range (ATR) determines the window size dynamically.
When volatility is high, the moving average window expands, making the MLMA more stable.
When volatility is low, the window shrinks, making the MLMA more responsive.
Trend Strength Filters 📊
ADX (Average Directional Index) > 25 → Indicates a strong trend.
RSI (Relative Strength Index) > 70 or < 30 → Identifies overbought/oversold conditions.
Price Position Relative to Upper/Lower Bands → Determines bullish vs. bearish momentum.
3️⃣ Volatility Bands & Dynamic Support/Resistance
Bollinger Bands (BB) 📉
Uses standard deviation-based bands around the MLMA to detect overbought and oversold zones.
Upper Band = Resistance, Lower Band = Support.
Helps traders identify breakout potential.
Adaptive Trend Bands 🔵🔴
The MLMA has built-in trend envelopes.
When price breaks the upper band, bullish momentum is confirmed.
When price breaks the lower band, bearish momentum is confirmed.
4️⃣ Visual Enhancements
Dynamic Gradient Fills 🌈
The trend strength (ADX-based) determines the gradient intensity.
Stronger trends = More vivid colors.
Weaker trends = Lighter colors.
Trend Reversal Arrows 🔄
🔼 Green Up Arrow: Bullish reversal signal.
🔽 Red Down Arrow: Bearish reversal signal.
Trend Table Overlay 🖥
Displays ADX, RSI, and Trend State dynamically on the chart.
📢 Trading Signals & How to Use It
1️⃣ Bullish Signals 📈
✅ Conditions for a Long (Buy) Trade:
The MLMA crosses above the lower band.
The ADX is above 25 (confirming trend strength).
RSI is above 55, indicating positive momentum.
Green trend reversal arrow appears (confirmation of a bullish reversal).
🔹 How to Trade It:
Enter a long trade when the MLMA turns bullish.
Set stop-loss below the lower Bollinger Band.
Target previous resistance levels or use the upper band as take-profit.
2️⃣ Bearish Signals 📉
✅ Conditions for a Short (Sell) Trade:
The MLMA crosses below the upper band.
The ADX is above 25 (confirming trend strength).
RSI is below 45, indicating bearish pressure.
Red trend reversal arrow appears (confirmation of a bearish reversal).
🔹 How to Trade It:
Enter a short trade when the MLMA turns bearish.
Set stop-loss above the upper Bollinger Band.
Target the lower band as take-profit.
💡 What Makes This a Machine Learning Moving Average?
📍 1️⃣ Adaptive & Self-Tuning
Unlike static moving averages that rely on fixed parameters, this MLMA automatically adjusts its sensitivity to market conditions using:
ATR-based dynamic windowing 📏 (Expands/contracts based on volatility).
Adaptive smoothing using EMA, HMA, WMA, or VWAP 📊.
Multi-indicator confirmation (ADX, RSI, Volatility Bands) 🏆.
📍 2️⃣ Intelligent Trend Confirmation
The MLMA "learns" from recent price movements instead of blindly following a fixed-length average.
It incorporates ADX & RSI trend filtering to reduce noise & false signals.
📍 3️⃣ Dynamic Color-Coding for Trend Strength
Strong trends trigger more vivid colors, mimicking confidence levels in machine learning models.
Weaker trends appear faded, suggesting uncertainty.
🎯 Why Use the MLMA?
✅ Pros
✔ Combines multiple trend indicators (MA, ADX, RSI, BB).
✔ Automatically adjusts to market conditions.
✔ Filters out weak trends, making it more reliable.
✔ Visually intuitive (gradient colors & reversal arrows).
✔ Works across all timeframes and assets.
⚠️ Cons
❌ Not a standalone strategy → Best used with volume confirmation or candlestick analysis.
❌ Can lag slightly in fast-moving markets (due to smoothing).

Power Trend [MacAlgo]Description:
The Power Trend Indicator is a sophisticated technical analysis tool that overlays on your trading charts to identify prevailing market trends. It utilizes a combination of ATR-based trend calculations, moving averages, volume analysis, and momentum indicators to generate reliable buy and sell signals. Additionally, it offers customizable settings to adapt to various trading styles and timeframes.
Key Features:
Adaptive ATR Calculation: Automatically adjusts the ATR (Average True Range) period and multiplier based on the selected timeframe for more accurate trend detection.
Dynamic Trend Lines: Plots continuous trend lines with color-coded bars to visually represent bullish and bearish trends.
Buy/Sell Signals: Generates standard and power buy/sell signals to help you make informed trading decisions.
Volume Analysis: Incorporates average buy and sell volumes to identify strong market movements.
Multiple Timeframe Support: Automatically adjusts the indicator's timeframe or allows for manual selection to suit your trading preferences.
Highlighting: Highlights trending bars for easy visualization of market conditions.
Alerts: Customizable alert conditions to notify you of potential trading opportunities in real-time.
How it Works:
1. ATR-Based Trend Calculation:
ATR Period & Multiplier: Calculates ATR based on user-defined periods and multipliers, dynamically adjusting according to the chart's timeframe.
Trend Determination: Identifies trends as bullish (1) or bearish (-1) based on price movements relative to ATR-based upper (up) and lower (dn) trend lines.
2. Moving Averages:
EMA & SMA: Calculates exponential and simple moving averages to smooth price data and identify underlying trends.
AlphaTrend Line: Combines a 50-period EMA and a 30-period SMA on a 4-hour timeframe to create the AlphaTrend line, providing a robust trend reference.
3. Volume Analysis:
Buy/Sell Volume: Differentiates between buy and sell volumes to gauge market strength.
Average Volume: Compares current volume against average buy/sell volumes to detect significant market movements.
4. Momentum Indicators:
RSI, MACD, OBV: Incorporates Relative Strength Index (RSI), Moving Average Convergence Divergence (MACD), and On-Balance Volume (OBV) to assess momentum and confirm trend strength.
5. Signal Generation:
Standard Signals: Basic buy and sell signals based on trend crossovers.
Power Signals: Enhanced signals requiring multiple conditions (e.g., increased volume, momentum confirmation) for higher confidence trades.
Customization Options:
Tailor the Power Trend Indicator to your specific trading needs with the following settings:
ATR Period: Set the period for ATR calculation (default: 8).
ATR Multiplier: Adjust the ATR multiplier to fine-tune trend sensitivity (default: 3.0).
Source: Choose the price source (e.g., HL2, Close) for calculations.
Change ATR Calculation Method: Toggle between different ATR calculation methods.
Show Buy/Sell Signals: Enable or disable the display of buy and sell signals on the chart.
Highlighting: Turn on or off the bar highlighting feature.
Timeframe Adjustment: Choose between automatic timeframe adjustment or manually set
the indicator's timeframe.
Manual Indicator Timeframe: If manual adjustment is selected, specify the desired timeframe (default: 60 minutes).
Visual Components:
Trend Lines: Continuous lines representing the current trend, color-coded for easy identification (green for bullish, red for bearish, orange for neutral).
Bar Coloring: Bars are colored based on the current trend and its relationship to the AlphaTrend line.
Buy/Sell Triangles: Triangular markers appear on the chart to indicate buy and sell signals.
Power Signals: Larger triangles highlight strong buy and sell opportunities based on multiple confirming factors.
Highlighting: Transparent overlays highlight trending areas to enhance visual clarity.
Alerts:
Stay informed with customizable alerts that notify you of important market movements:
SuperTrend Buy/Sell: Alerts when standard buy or sell signals are generated.
Power Buy/Sell Alerts: Notifications for strong buy or sell signals based on comprehensive conditions.
Trend Direction Change: Alerts when the trend changes from bullish to bearish or vice versa.
How to Use:
Add to Chart: Apply the Power Trend Indicator to your preferred trading chart on TradingView.
Configure Settings: Adjust the input parameters to match your trading style and the timeframe you are analyzing.
Analyze Trends: Observe the trend lines, bar colors, and AlphaTrend line to understand the current market trend.
Follow Signals: Look for buy and sell signals or power signals to identify potential entry and exit points.
Set Alerts: Enable alerts to receive real-time notifications of significant trading opportunities.
Adjust as Needed: Fine-tune the settings based on market conditions and your trading experience.
Important Notes:
Backtesting: While the Power Trend Indicator is built using robust technical analysis principles, it's essential to backtest and validate its performance within your trading strategy.
Market Conditions: The indicator performs best in trending markets. In sideways or highly volatile markets, signal reliability may vary.
Risk Management: Always employ proper risk management techniques when trading based on indicator signals to protect your capital.
Disclaimer:
This indicator is intended for educational purposes only and does not provide financial advice or guarantee future performance. Trading involves risk, and past results are not indicative of future outcomes. Always conduct your own analysis and risk management.

Liquidity Trap Detector (LTD)The Liquidity Trap Detector is an advanced trading tool designed to identify liquidity zones and potential traps set by institutional players. It provides traders with a comprehensive framework to align with smart money movements, helping them avoid common retail pitfalls such as bull and bear traps.
The indicator focuses on detecting liquidity sweeps, breaker blocks, and areas of institutional accumulation/distribution. It integrates multiple technical analysis methods to offer high-probability signals and insights into how liquidity dynamics unfold in the market.
Note : This indicator is not designed for beginners; it is intended for traders who already have a solid understanding of trading fundamentals. It is tailored for individuals who are familiar with concepts like liquidity, order blocks, and traps. Traders with at least 6 months to 1 year of trading experience will fully appreciate the power and potential of this indicator, as they will have the necessary knowledge to leverage its features effectively. Beginners may find it challenging to grasp the advanced concepts embedded in this tool.
Why Combine These Elements?
The components of the Liquidity Trap Detector are carefully chosen to address the core challenges of identifying institutional activity and liquidity traps. Here’s why each element is included and how they work together:
1. Order Blocks:
• Purpose: Identify zones where large institutional players accumulate or distribute positions.
• Role in the Indicator: These zones act as primary liquidity areas, where price is likely to reverse or consolidate due to significant order flow.
2. Breaker Blocks:
• Purpose: Highlight areas where liquidity has been swept, leading to potential price reversals or continuations.
• Role in the Indicator: Confirms whether a liquidity trap has occurred and provides actionable levels for entry or exit.
3. ATR-Based Volatility Zones:
• Purpose: Filter signals based on market volatility to ensure trades align with statistically significant price movements.
• Role in the Indicator: Defines dynamic support and resistance zones, improving the accuracy of signal generation.
4. Volume Delta:
• Purpose: Measure the imbalance between aggressive buyers and sellers, often indicating institutional activity.
• Role in the Indicator: Validates whether a liquidity trap is backed by smart money absorption or retail-driven momentum.
5. Trend Confirmation (EMA):
• Purpose: Align liquidity trap signals with the broader market trend, reducing false positives.
• Role in the Indicator: Ensures trades are executed in the direction of the prevailing trend.
What Makes It Unique?
1. Gen 1 Liquidity Zones and Traps:
• The indicator identifies Gen 1 Liquidity Zones, which represent the first areas where liquidity is accumulated or swept. While these zones often lead to reversals, they can sometimes fail, resulting in continuation moves. The indicator highlights these scenarios, helping traders adapt.
• For example, a bull trap identified in a Gen 1 Zone may see price move higher after an initial red candle, completing a secondary liquidity sweep before reversing.
2. Multi-Layer Signal Validation:
• Signals are only generated when liquidity, volume, trend, and volatility align. This ensures high-probability setups and reduces noise in choppy markets.
3. Dynamic Adaptability:
• ATR-based zones and volume delta filtering allow the indicator to adapt to different market conditions, from trending to range-bound environments.
4. Institutional Insights:
• By focusing on liquidity sweeps, order blocks, and volume imbalances, the indicator helps traders align with institutional strategies rather than retail behavior.
How It Works
The Liquidity Trap Detector uses a step-by-step process to identify and validate liquidity traps:
1. Identifying Liquidity Zones:
• Order Blocks: Mark key zones of institutional activity where price is likely to reverse.
• Breaker Blocks: Highlight areas where liquidity sweeps have occurred, signaling potential traps.
2. Filtering with Volatility (ATR):
• ATR defines dynamic support and resistance zones, ensuring signals are only generated near significant price levels.
3. Validating Traps with Volume Delta:
• Volume delta shows whether liquidity sweeps are backed by aggressive buying/selling from institutions, confirming the trap’s validity.
4. Aligning with Market Trends:
• EMA ensures signals align with the broader trend to reduce false positives.
5. Monitoring Gen 1 Liquidity Zones:
• The indicator highlights Gen 1 Liquidity Zones where price may initially reverse or sweep further before a true reversal. Traders are alerted to potential continuation scenarios if volume or momentum suggests unmet liquidity above/below the zone.
How to Use It
Buy Signal:
• Triggered when:
• Price sweeps below an order block and forms a breaker block, indicating a liquidity trap.
• Volume delta confirms aggressive selling absorption.
• ATR volatility zone supports the reversal.
• EMA confirms a bullish trend.
• Action: Enter a Buy trade and set:
• Stop Loss (SL): Below the order block.
• Take Profit (TP): Near the next resistance or liquidity zone.
Sell Signal:
• Triggered when:
• Price sweeps above an order block and forms a breaker block, indicating a liquidity trap.
• Volume delta confirms aggressive buying absorption.
• ATR volatility zone supports the reversal.
• EMA confirms a bearish trend.
• Action: Enter a Sell trade and set:
• SL: Above the order block.
• TP: Near the next support or liquidity zone.
Timeframes:
• Best suited for scalping and intraday trading on lower timeframes (5m, 15m, 1H).
• Can also be applied to swing trading on higher timeframes.
Example Scenarios:
1. Bull Trap in a Gen 1 Zone:
• Price sweeps above a resistance order block, forms a breaker block, and reverses sharply. However, if momentum persists, price may continue higher after a minor pullback. The indicator helps traders anticipate this by monitoring volume and trend shifts.
2. Bear Trap with Secondary Sweep:
• Price sweeps below a support order block but fails to reverse immediately, instead forming a secondary liquidity sweep before turning bullish. The indicator highlights both scenarios, allowing for flexible trade management.
Why Use It?
The Liquidity Trap Detector offers:
1. Precision: Combines multiple filters to identify institutional liquidity traps with high accuracy.
2. Adaptability: Works across trending and range-bound markets.
3. Smart Money Alignment: Helps traders avoid retail traps by focusing on liquidity sweeps and institutional behavior.
Multi-Timeframe Confluence IndicatorThe Multi-Timeframe Confluence Indicator strategically combines multiple timeframes with technical tools like EMA and RSI to provide robust, high-probability trading signals. This combination is grounded in the principles of technical analysis and market behavior, tailored for traders across all styles—whether intraday, swing, or positional.
1. The Power of Multi-Timeframe Confluence
Markets are influenced by participants operating on different time horizons:
• Intraday traders act on short-term price fluctuations.
• Swing traders focus on intermediate trends lasting days or weeks.
• Position traders aim to capture multi-month or long-term trends.
By aligning signals from a higher timeframe (macro trend) with a lower timeframe (micro trend), the indicator ensures that short-term entries are in harmony with the broader market direction. This multi-timeframe approach significantly reduces false signals caused by temporary market noise or counter-trend moves.
Example: A bullish trend on the daily chart (higher timeframe) combined with a bullish RSI and EMA alignment on the 15-minute chart (lower timeframe) provides a stronger confirmation than relying on the 15-minute chart alone.
2. Why EMA and RSI Are Essential
Each element of the indicator serves a unique role in ensuring accuracy and reliability:
• EMA (Exponential Moving Average):
• A dynamic trend filter that adjusts quickly to price changes.
• On the higher timeframe, it establishes the overall trend direction (e.g., bullish or bearish).
• On the lower timeframe, it identifies precise entry/exit zones within the trend.
• RSI (Relative Strength Index):
• Adds a momentum-based perspective, confirming whether a trend is backed by strong buying or selling pressure.
• Ensures that signals occur in areas of strength (RSI > 55 for bullish signals, RSI < 45 for bearish signals), filtering out weak or uncertain price movements.
By combining EMA (trend) and RSI (momentum), the indicator delivers confluence-based validation, where both trend and momentum align, making signals more reliable.
3. Cooldown Period for Signal Optimization
Trading in choppy or sideways markets often leads to overtrading and false signals. The cooldown period ensures that once a signal is generated, subsequent signals are suppressed for a defined number of bars. This prevents traders from entering low-probability trades during indecisive market phases, improving overall signal quality.
Example: After a bullish confluence signal, the cooldown period prevents a bearish signal from being triggered prematurely if the market enters a temporary retracement.
4. Use Cases Across Trading Styles
This indicator caters to various trading styles, each benefiting from the confluence of timeframes and technical elements:
• Intraday Trading:
• Use a 1-hour chart as the higher timeframe and a 5-minute chart as the lower timeframe.
• Benefit: Align intraday entries with the hourly trend for higher win rates.
• Swing Trading:
• Use a daily chart as the higher timeframe and a 1-hour chart as the lower timeframe.
• Benefit: Capture multi-day moves while avoiding counter-trend entries.
• Scalping:
• Use a 30-minute chart as the higher timeframe and a 1-minute chart as the lower timeframe.
• Benefit: Enhance scalping efficiency by ensuring short-term trades align with broader intraday trends.
• Position Trading:
• Use a weekly chart as the higher timeframe and a daily chart as the lower timeframe.
• Benefit: Time long-term entries more precisely, maximizing profit potential.
5. Robustness Through Customization
The indicator allows traders to customize:
• Timeframes for higher and lower analysis.
• EMA lengths for trend filtering.
• RSI settings for momentum confirmation.
• Cooldown periods to adapt to market volatility.
This flexibility ensures that the indicator can be tailored to suit individual trading preferences, market conditions, and asset classes, making it a comprehensive tool for any trading strategy.
Why This Mashup Stands Out
The Multi-Timeframe Confluence Indicator is more than a sum of its parts. It leverages:
• EMA’s ability to identify trends, combined with RSI’s insight into momentum, ensuring each signal is well-supported.
• A multi-timeframe perspective that incorporates both macro and micro trends, filtering out noise and improving reliability.
• A cooldown mechanism that prevents overtrading, a common pitfall for traders in volatile markets.
This integration results in a powerful, adaptable indicator that provides actionable, high-confidence signals, reducing uncertainty and enhancing trading performance across all styles.

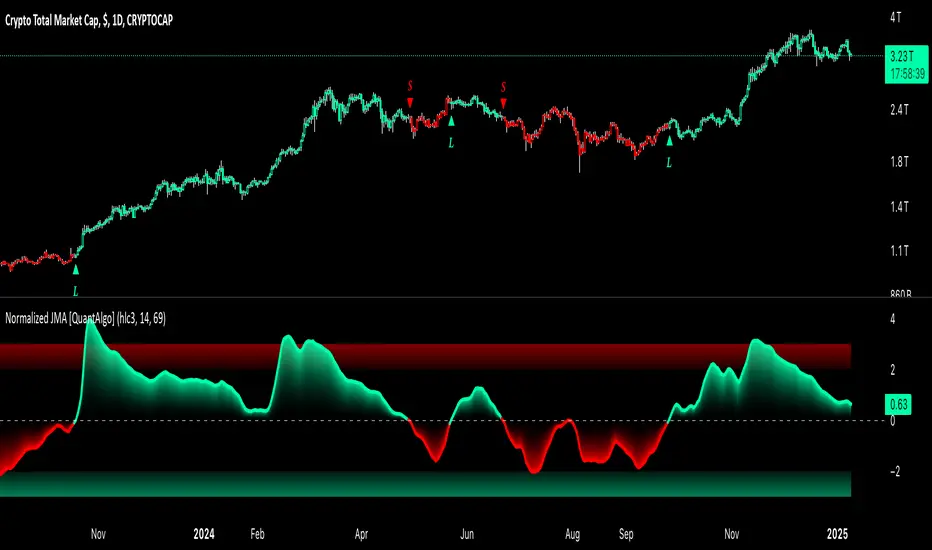
Normalized Jurik Moving Average [QuantAlgo]Upgrade your investing and trading strategy with the Normalized Jurik Moving Average (JMA) , a sophisticated oscillator that combines adaptive smoothing with statistical normalization to deliver high-quality signals! Whether you're a swing trader looking for momentum shifts or a medium- to long-term investor focusing on trend validation, this indicator's statistical approach offers valuable analytical advantages that can enhance your trading and investing decisions!
🟢 Core Architecture
The foundation of this indicator lies in its unique dual-layer calculation system. The first layer implements the Jurik Moving Average, known for its superior noise reduction and responsiveness, while the second layer applies statistical normalization (Z-Score) to create standardized readings. This sophisticated approach helps identify significant price movements while filtering out market noise across various timeframes and instruments.
🟢 Technical Foundation
Three key components power this indicator are:
Jurik Moving Average (JMA): An advanced moving average calculation that provides superior smoothing with minimal lag
Statistical Normalization: Z-Score based scaling that creates consistent, comparable readings across different market conditions
Dynamic Zone Detection: Automatically identifies overbought and oversold conditions based on statistical deviations
🟢 Key Features & Signals
The Normalized JMA delivers market insights through:
Color-adaptive oscillator line that reflects momentum strength and direction
Statistically significant overbought/oversold zones for trade validation
Smart gradient fills between signal line and zero level for enhanced visualization
Clear long (L) and short (S) markers for validated momentum shifts
Intelligent bar coloring that highlights the current market state
Customizable alert system for both bullish and bearish setups
🟢 Practical Usage Tips
Here's how to maximize your use of the Normalized JMA:
1/ Setup:
Add the indicator to your favorites, then apply it to your chart ⭐️
Begin with the default smoothing period for balanced analysis
Use the default normalization period for optimal signal generation
Start with standard visualization settings
Customize colors to match your chart preferences
Enable both bar coloring and signal markers for complete visual feedback
2/ Reading Signals:
Watch for L/S markers - they indicate validated momentum shifts
Monitor oscillator line color changes for direction confirmation
Use the built-in alert system to stay informed of potential trend changes
🟢 Pro Tips
Adjust Smoothing Period based on your trading style:
→ Lower values (8-12) for more responsive signals
→ Higher values (20-30) for more stable trend identification
Fine-tune Normalization Period based on market conditions:
→ Shorter periods (20-25) for more dynamic markets
→ Longer periods (40-50) for more stable markets
Optimize your analysis by:
→ Using +2/-2 zones for primary trade signals
→ Using +3/-3 zones for extreme market conditions
→ Combining with volume analysis for trade confirmation
→ Using multiple timeframe analysis for strategic context
Combine with:
→ Volume indicators for trade validation
→ Price action for entry timing
→ Support/resistance levels for profit targets
→ Trend-following indicators for directional bias
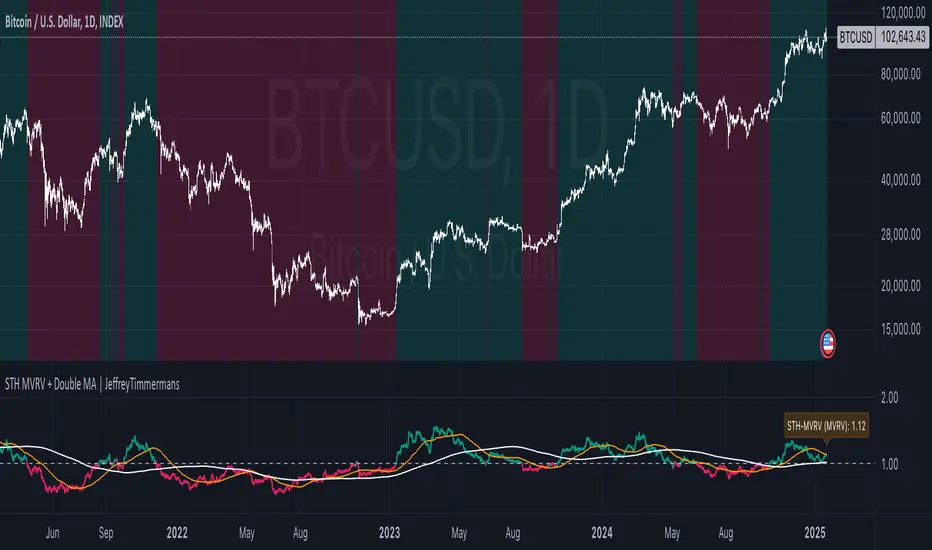
STH MVRV + Double MA | JeffreyTimmermansSTH MVRV + Double MA
This indicator combines blockchain analytics and technical analysis to provide traders with insights into market trends and cycles. At its core, it utilizes the Short-Term Holder (STH) Market Value to Realized Value (MVRV) ratio, a powerful metric in blockchain analysis, alongside Moving Averages (MA's) to offer a comprehensive view of market dynamics.
What Is the STH-MVRV Ratio?
The STH-MVRV ratio is a blockchain-based metric that compares the market value of Bitcoin held by short-term holders to its realized value.
Market Value: The current price of Bitcoin multiplied by the number of coins held by short-term holders.
Realized Value : The average price at which short-term holders acquired their Bitcoin, based on blockchain transaction data.
This ratio provides a unique perspective on market sentiment:
Above 1: Short-term holders, on average, are in profit. This often signals a bullish market.
Below 1: Short-term holders are, on average, at a loss, which can indicate bearish sentiment.
The STH-MVRV is particularly useful for identifying potential market tops or bottoms, as short-term holder behavior often reflects broader market trends.
How Does This Indicator Work?
The STH MVRV + Double MA indicator builds on the STH-MVRV ratio by integrating it with additional data and tools to enhance its practical use:
STH-MVRV Variations:
STH-MVRV (MVRV): The traditional ratio as described above.
Price-Based MVRV: A variation using Bitcoin price to measure similar dynamics.
Average MVRV: A hybrid metric combining the two for balanced insights.
Dynamic Moving Averages (MA's):
Primary SMA (STH-MVRV): Smooths out fluctuations in the STH-MVRV ratio over a default period of 155 days.
Extra MA: A faster-moving average for shorter-term trends (default: 50 days).
Second MA: A slower-moving average for longer-term trends (default: 200 days).
Visual and Alert Features:
Color-coded plots to highlight bullish or bearish conditions.
Alerts for key crossover events, such as when STH-MVRV crosses above/below critical levels or Moving Averages.
Key Features
STH-MVRV as a Sentiment Gauge:
Use the ratio to determine whether short-term holders are profiting (bullish) or losing (bearish).
Moving Average Integration:
Identify trends and reversals with customizable Moving Averages.
Crossovers between MA's and the STH-MVRV indicate actionable trading signals.
Customizable Parameters:
Tailor SMA and MA settings to align with your strategy.
Adjust colors and labels for clearer insights.
Real-Time Updates:
Dynamic labels display the current values of STH-MVRV, Price-based MVRV, or the Average, providing instant clarity.
How to Use This Indicator
Gauge Market Sentiment:
Use the STH-MVRV to understand whether the market is overvalued or undervalued based on short-term holder behavior.
Trend Identification with MA's:
Monitor crossovers between STH-MVRV and Moving Averages for potential buy or sell signals.
Analyze Market Cycles:
Use the Average MVRV to gain a broader view of market conditions, balancing short-term and long-term insights.
What Makes This Indicator Unique?
In-Depth Blockchain Metric: Builds directly on the STH-MVRV ratio, a key metric in blockchain analysis.
Integrated Analysis: Combines the STH-MVRV with Moving Averages for enhanced functionality.
Customizability and Practicality: Users can adapt the settings to fit their unique trading style, ensuring the tool is both flexible and powerful.
This combination of blockchain insights and technical tools makes the STH MVRV + Double MA indicator an essential addition to any trader’s arsenal. Use it to stay ahead of market trends and make informed decisions with confidence.
-Jeffrey
MA PremiumMA Premium: Advanced Moving Average with Dynamic ATR Bands
MA Premium is a cutting-edge moving average indicator designed to help traders identify potential price reversal zones and optimize their trading strategies. The indicator combines a proprietary “Safety MA” with dynamic ATR-based support and resistance bands, visualized through clean lines and optional cloud regions.
Key Features
1. Proprietary “Safety MA”
The Safety MA utilizes a custom multi-layered EMA algorithm, providing a highly responsive and smooth trend line.
Dynamically adjusts to changing market conditions, offering clear signals for trend direction and potential reversals.
2. Dynamic ATR-Based Bands
Generates multiple support and resistance levels using advanced ATR calculations.
Bands represent zones of increasing market volatility and highlight potential price reversal areas, suitable for tiered trading strategies.
Visually separates overbought and oversold zones to assist in identifying critical price action points.
3. Customizable Settings
Adjustable Bandwidth: Scale the ATR bands dynamically using the Bandwidth Coefficient to align with market volatility.
MA Speed Selection: Toggle between “Fast,” “Medium,” or “Slow” settings to adjust the sensitivity of the Safety MA.
4. Intuitive Visualizations
Optional display of cloud lines and shaded regions to visually enhance support/resistance zones.
A clean and structured design ensures clarity in interpretation.
How to Use
Set the MA Type (“Fast,” “Medium,” or “Slow”) for desired responsiveness.
Adjust the Bandwidth Coefficient to match the current market's volatility.
The Safety MA acts as a dynamic trend-following tool.
Use the ATR-based bands to identify areas where price may react (e.g., potential reversals in overbought or oversold zones).
Employ the dynamic bands for tiered trade execution to manage risk and enhance entry/exit strategies.
Green bands highlight overbought zones (potential bearish reactions).
Red bands indicate oversold zones (potential bullish reactions).
Unlike traditional moving average tools, MA Premium introduces advanced dynamic band calculations and unique visual cues to help traders navigate market volatility effectively. Its adaptability and precision make it an invaluable tool for scalpers, swing traders, and long-term investors alike.
Note on Closed-Source Policy
As part of my development principles, I choose to publish my indicators as closed-source to preserve the uniqueness and integrity of the algorithms used. While the underlying logic remains private, the detailed description provided ensures that traders can fully understand the purpose, functionality, and application of the indicator. This approach allows me to focus on delivering original tools that add value to the trading community.
Disclaimer
This script is provided under the Mozilla Public License 2.0 and is intended for educational purposes only. It should not be construed as financial advice. Always combine this indicator with additional market context and use sound risk management practices.

Range Channel by Atilla YurtsevenThis script creates a dynamic channel around a user-selected moving average (MA). It calculates the relative difference between price and the MA, then finds the average of the positive differences and the negative differences separately. Using these averages, it plots upper and lower bands around the MA as well as a histogram-like oscillator to show when price moves above or below the average thresholds.
How It Works
Moving Average Selection
The indicator allows you to choose among multiple MA types (SMA, EMA, WMA, Linear Regression, etc.). Depending on your preference, it calculates the chosen MA for the selected lookback period.
Relative Difference Calculation
It then computes the percentage difference between the source (typically the closing price) and the MA. (diff = (src / ma - 1) * 100)
Positive & Negative Averages
- Positive differences are averaged and represent how far the price typically moves above the MA.
- Negative differences are similarly averaged for when price moves below the MA.
Range Channel & Oscillator
- The channel is plotted around the MA using the average positive and negative differences (Upper Edge and Lower Edge).
- The “Untrended” histogram plots the difference (diff). Green bars occur when price is above the MA on average, and red bars when below. Two additional lines mark the upper and lower average thresholds on this histogram.
How to Use
Identify Overbought/Oversold Zones: The upper edge can serve as a dynamic overbought level, while the lower edge can suggest potential oversold conditions. When the histogram approaches or crosses these levels, it may signal price extremes relative to its average movement.
Trend Confirmation: Compare price action relative to the channel. If price and the histogram consistently remain above the MA and upper threshold, it could indicate a stronger bullish trend. If they remain below, it might signal a prolonged bearish trend.
Entry/Exit Timings:
- Entry: Traders can look for moments when price breaks back inside the channel from an extreme, anticipating a mean reversion.
- Exit: Watching how price interacts with these dynamic edges can help define stop-loss or take-profit points.
Because these thresholds adapt over time based on actual price behavior, they can be more responsive than fixed-percentage bands. However, like all indicators, it’s most effective when used in conjunction with other technical and fundamental tools.
Disclaimer
This script is provided for educational and informational purposes only. It does not guarantee any specific outcome or profit. Use it at your own discretion and risk.
Trade smart, stay safe.
Atilla Yurtseven

Strength of Divergence Across Multiple Indicators (+CMF&VWMACD)Modified Version of Strength of Divergence Across Multiple Indicators by reees
Purpose:
This Pine Script indicator is designed to identify and evaluate the strength of bullish and bearish divergences across multiple technical indicators. Divergences occur when the price of an asset is moving in one direction while a technical indicator is moving in the opposite direction, potentially signaling a trend reversal.
Key Features:
1. Multiple Indicator Support: The script now analyzes divergences for the following indicators:
* RSI (Relative Strength Index)
* OBV (On-Balance Volume)
* MACD (Moving Average Convergence/Divergence)
* STOCH (Stochastic Oscillator)
* CCI (Commodity Channel Index)
* MFI (Money Flow Index)
* AO (Awesome Oscillator)
* CMF (Chaikin Money Flow) - Newly added
* VWMACD (Volume-Weighted MACD) - Newly added
2. Customizable Divergence Parameters:
* Bullish/Bearish: Enable or disable the detection of bullish and bearish divergences independently.
* Regular/Hidden: Detect both regular and hidden divergences (hidden divergences can indicate trend continuation).
* Broken Trendline Exclusion: Optionally ignore divergences where the trendline connecting price pivots is broken by an intermediate pivot.
* Pivot Lookback Periods: Adjust the number of bars used to identify valid pivot highs and lows for divergence calculations.
* Weighting: Assign different weights to regular vs. hidden divergences and to the relative change in price vs. the indicator.
3. Indicator-Specific Settings:
* Weight: Each indicator can be assigned a weight, influencing its contribution to the overall divergence strength calculation.
* Extreme Value: Define a threshold above which an indicator's divergence is considered "extreme," giving it a higher strength rating.
4. Divergence Strength Calculation:
* For each indicator, the script calculates a divergence "degree" based on the magnitude of the divergence and the user-defined weightings.
* The total divergence strength is the sum of the individual indicator divergence degrees.
* Strength is categorized as "Extreme," "Very strong," "Strong," "Moderate," "Weak," or "Very weak."
5. Visualization:
* Divergence Lines: The script draws lines on the chart connecting the price and indicator pivots that form a divergence (optional, with customizable transparency).
* Labels: Labels display the total divergence strength and a breakdown of each indicator's contribution. The size and visibility of labels are based on the strength.
6. Alerts:
* The script can generate alerts when the total divergence strength exceeds a user-defined threshold.
New Indicators (CMF and VWMACD):
* Chaikin Money Flow (CMF):
* Purpose: Measures the buying and selling pressure by analyzing the relationship between price, volume, and the accumulation/distribution line.
* Divergence: A bullish CMF divergence occurs when the price makes a lower low, but the CMF makes a higher low (suggesting increasing buying pressure). A bearish divergence is the opposite.
* Volume-Weighted MACD (VWMACD):
* Purpose: Similar to the standard MACD but uses volume-weighted moving averages instead of simple moving averages, giving more weight to periods with higher volume.
* Divergence: Divergences are interpreted similarly to the standard MACD, but the VWMACD can be more sensitive to volume changes.
How It Works (Simplified):
1. Pivot Detection: The script identifies pivot highs and lows in both price and the selected indicators using the specified lookback periods.
2. Divergence Check: For each indicator:
* It checks if a series of pivots in price and the indicator are diverging (e.g., price makes a lower low, but the indicator makes a higher low for a bullish divergence).
* It calculates the divergence degree based on the difference in price and indicator values, weightings, and whether it's a regular or hidden divergence.
3. Strength Aggregation: The script sums up the divergence degrees of all enabled indicators to get the total divergence strength.
4. Visualization and Alerts: It draws lines and labels on the chart to visualize the divergences and generates alerts if the total strength exceeds the set threshold.
Benefits:
* Comprehensive Divergence Analysis: By considering multiple indicators, the script provides a more robust assessment of potential trend reversals.
* Customization: The many adjustable parameters allow traders to fine-tune the script to their specific trading style and preferences.
* Objective Strength Evaluation: The divergence strength calculation and categorization offer a more objective way to evaluate the significance of divergences.
* Early Warning System: Divergences can often precede significant price movements, making this script a valuable tool for anticipating potential trend changes.
* Volume Confirmation: The inclusion of CMF and VWMACD add volume-based confirmation to the divergence signals, potentially increasing their reliability.
Limitations:
* Lagging Indicators: Most of the indicators used are lagging, meaning they are based on past price data. Divergences may sometimes occur after a significant price move has already begun.
* False Signals: No indicator is perfect, and divergences can sometimes produce false signals, especially in choppy or ranging markets.
* Subjectivity: While the script aims for objectivity, some settings (like weightings and extreme values) still involve a degree of subjective judgment.

EMA Volatility Channel [QuantAlgo]EMA Volatility Channel 🌊📈
The EMA Volatility Channel by QuantAlgo is an advanced technical indicator designed to capture price volatility and trend dynamics through adaptive channels based on exponential moving averages. This sophisticated system combines EMA-based trend analysis with dynamic volatility-adjusted bands to help traders and investors identify trend direction, potential reversals, and market volatility conditions. By evaluating both price momentum and volatility together, this tool enables users to make informed trading decisions while adapting to changing market conditions.
💫 Dynamic Channel Architecture
The EMA Volatility Channel provides a unique framework for assessing market trends through a blend of exponential moving averages and volatility-based channel calculations. Unlike traditional channel indicators that use fixed-width bands, this system incorporates dynamic volatility measurements to adjust channel width automatically, helping users determine whether price movements are significant relative to current market conditions. By combining smooth EMA trends with adaptive volatility bands, it evaluates both directional movement and market volatility, while the smoothing parameters ensure stable yet responsive channel adjustments. This adaptive approach allows users to identify trending conditions while remaining aware of volatility expansions and contractions, enhancing both trend-following and reversal strategies.
📊 Indicator Components & Mechanics
The EMA Volatility Channel is composed of several technical components that create a dynamic channel system:
EMA Midline: Calculates a smoothed exponential moving average that serves as the channel's centerline, providing a clear reference for trend direction.
Volatility Measurement: Computes average price movement to determine dynamic channel width, adapting to changing market conditions automatically.
Smooth Band Calculation: Applies additional smoothing to the channel bands, reducing noise while maintaining responsiveness to significant price movements.
📈 Key Indicators and Features
The EMA Volatility Channel combines various technical tools to deliver a comprehensive analysis of market conditions.
The indicator utilizes exponential moving averages with customizable length and smoothing parameters to adapt to different trading styles. Volatility calculations are applied to determine channel width, providing context-aware boundaries for price movement. The trend detection component evaluates price action relative to the channel bands, helping validate trends and identify potential reversals.
The indicator incorporates multi-layered visualization with color-coded channels and bars to signal both trend direction and market position. These adaptive visual cues, combined with programmable alerts for channel breakouts, help traders and investors track both trend changes and volatility conditions, supporting both trend-following and mean-reversion strategies.
⚡️ Practical Applications and Examples
✅ Add the Indicator: Add the indicator to your TradingView chart by clicking on the star icon to add it to your favorites ⭐️
👀 Monitor Channel Position: Watch the price position relative to the channel bands to identify trend direction and potential reversals. When price moves outside the channel, consider potential trend changes or extreme conditions.
🔔 Set Alerts: Configure alerts for channel breakouts and trend changes, ensuring you can act on significant technical developments promptly.
🌟 Summary and Tips
The EMA Volatility Channel by QuantAlgo is a versatile technical tool, designed to support both trend following and volatility analysis across different market environments. By combining smooth EMA trends with dynamic volatility-based channels, it helps traders and investors identify significant price movements while measuring market volatility, providing reliable technical signals. The tool's adaptability across timeframes makes it suitable for both trend-following and reversal strategies, allowing users to capture opportunities while maintaining awareness of changing market conditions.

HMA Gaussian Volatility AdjustedOverview
The "HMA Gaussian Volatility Adjusted" indicator introduces a unique combination of HMA smoothing with a Gaussian filter and two components to measure volatility (Average True Range (ATR) and Standard Deviation (SD)). This tool provides traders with a stable and accurate measure of price trends by integrating a Gaussian Filter smoothed using HMA with a customized calculation of volatility. This innovative approach allows for enhanced sensitivity to market fluctuations while filtering out short-term price noise.
Technical Composition and Calculation
The "HMA Gaussian Volatility Adjusted" indicator incorporates HMA smoothing and dynamic standard deviation calculations to build upon traditional volatility measures.
HMA & Gaussian Smoothing:
HMA Calculation (HMA_Length): The script applies a Hull Moving Average (HMA) to smooth the price data over a user-defined period, reducing noise and helping focus on broader market trends.
Gaussian Filter Calculation (Length_Gaussian): The smoothed HMA data is further refined by putting it into a Gaussian filter to incorporate a normal distribution.
Volatility Measurement:
ATR Calculation (ATR_Length, ATR_Factor): The indicator incorporates the Average True Range (ATR) to measure market volatility. The user-defined ATR multiplier is applied to this value to calculate upper and lower trend bands around the Gaussian, providing a dynamic measure of potential price movement based on recent volatility.
Standard Deviation Calculation (SD_Length): The script calculates the standard deviation of the price over a user-defined length, providing another layer of volatility measurement. The upper and lower standard deviation bands (SDD, SDU) act as additional indicators of price extremes.
Momentum Calculation & Scoring
When the indicator signals SHORT:
Diff = Price - Upper Boundary of the Standard Deviation (calculated on a Gaussian filter).
When the indicator signals LONG:
Diff = Price - Upper Boundary of the ATR (calculated on a Gaussian filter).
The calculated Diff signals how close the indicator is to changing trends. An EMA is applied to the Diff to smooth the data. Positive momentum occurs when the Diff is above the EMA, and negative momentum occurs when the Diff is below the EMA.
Trend Detection
Trend Logic: The indicator uses the calculated bands to identify whether the price is moving within or outside the standard deviation and ATR bands. Crosses above or below these bands, combined with positive/negative momentum, signals potential uptrends or downtrends, offering traders a clear view of market direction.
Features and User Inputs
The "HMA Gaussian Volatility Adjusted" script offers a variety of user inputs to customize the indicator to suit traders' styles and market conditions:
HMA Length: Allows traders to adjust the sensitivity of the HMA smoothing to control the amount of noise filtered from the price data.
Gaussian Length: Users can define the length at which the Gaussian filter is applied.
ATR Length and Multiplier: These inputs let traders fine-tune the ATR calculation, affecting the size of the dynamic upper and lower bands to adjust for price volatility.
Standard Deviation Length: Controls how the standard deviation is calculated, allowing further customization in detecting price volatility.
EMA Confluence: This input lets traders determine the length of the EMA used to calculate price momentum.
Type of Plot Setting: Allows users to determine how the indicator signal is plotted on the chart (Background color, Trend Lines, BOTH (backgroung color and Trend Lines)).
Transparency: Provides users with customization of the background color's transparency.
Color Long/Short: Offers users the option to choose their preferred colors for both long and short signals.
Summary and Usage Tips
The "HMA Gaussian Volatility Adjusted" indicator is a powerful tool for traders looking to refine their analysis of market trends and volatility. Its combination of HMA smoothing, Gaussian filtering, and standard deviation analysis provides a nuanced view of market movements by incorporating various metrics to determine direction, momentum, and volatility. This helps traders make better-informed decisions. It's recommended to experiment with the various input parameters to optimize the indicator for specific needs.

VD Zig Zag with SMAIntroduction
The VD Zig Zag with SMA indicator is a powerful tool designed to streamline technical analysis by combining Zig Zag swing lines with a Simple Moving Average (SMA). It offers traders a clear and intuitive way to analyze price trends, market structure, and potential reversals, all within a customizable framework.
Definition
The Zig Zag indicator is a trend-following tool that highlights significant price movements by filtering out smaller fluctuations. It visually connects swing highs and lows to reveal the underlying market structure. When paired with an SMA, it provides an additional layer of trend confirmation, helping traders align their strategies with market momentum.
Calculations
Zig Zag Logic:
Swing highs and lows are determined using a user-defined length parameter.
The highest and lowest points within the specified range are identified using the ta.highest() and ta.lowest() functions.
Zig Zag lines dynamically connect these swing points to visually map price movements.
SMA Logic:
The SMA is calculated using the closing prices over a user-defined period.
It smooths out price action to provide a clearer view of the prevailing trend.
The indicator allows traders to adjust the Zig Zag length and SMA period to suit their preferred trading timeframe and strategy.
Takeaways
Enhanced Trend Analysis: The Zig Zag lines clearly define the market's structural highs and lows, helping traders identify trends and reversals.
Customizable Parameters: Both the swing length and SMA period can be tailored for short-term or long-term trading strategies.
Visual Clarity: By filtering out noise, the indicator simplifies chart analysis and enables better decision-making.
Multi-Timeframe Support: Adapts seamlessly to the chart's timeframe, ensuring usability across all trading horizons.
Limitations
Lagging Nature: As with any indicator, the Zig Zag and SMA components are reactive and may lag during sudden price movements.
Sensitivity to Parameters: Improper parameter settings can lead to overfitting, where the indicator reacts too sensitively or misses significant trends.
Does Not Predict: This indicator identifies trends and structure but does not provide forward-looking predictions.
Summary
The VD Zig Zag with SMA indicator is a versatile and easy-to-use tool that combines the strengths of Zig Zag swing analysis and moving average trends. It helps traders filter market noise, visualize structural patterns, and confirm trends with greater confidence. While it comes with limitations inherent to all technical tools, its customizable features and multi-timeframe adaptability make it an excellent addition to any trader’s toolkit.
Additional Features
Have an idea or a feature you'd like to see added?
Feel free to reach out or share your suggestions here—I’m always open to updates!

Moving AveragesWhile this "Moving Averages" indicator may not revolutionize technical analysis, it certainly offers a valuable and efficient solution for traders seeking to streamline their chart analysis process. This all-in-one tool addresses a common frustration among traders: the need to constantly search for and compare different types and lengths of moving averages.
Key Features
The indicator allows for the configuration of up to 5 moving averages simultaneously, providing a comprehensive view of price trends. Users can choose from 7 types of moving averages for each line, including SMA, EMA, WMA, VWMA, HMA, SMMA, and TMA. This variety ensures that traders can apply their preferred moving average types without the need for multiple indicators.
Each moving average can be fully customized in terms of length, color, line style, and thickness, allowing for clear visual differentiation. However, what sets this indicator apart is its "Smart Opacity" feature. When activated, this option dynamically adjusts the transparency of the moving average lines based on their direction, with ascending lines appearing more opaque and descending lines more transparent. This subtle yet effective visual cue aids in quickly identifying trend changes and potential trading signals.
Advantages
The primary benefit of this indicator lies in its convenience. By consolidating multiple moving averages into a single, customizable tool, it saves traders valuable time and reduces chart clutter. The Smart Opacity feature, while not groundbreaking, does offer an intuitive way to visualize trend strength and direction at a glance.
Moreover, the indicator's flexibility makes it suitable for various trading styles and experience levels. Whether you're a novice trader learning to interpret basic trend signals or an experienced analyst fine-tuning a complex strategy, this tool can adapt to your needs.
In conclusion, while this "Moving Averages" indicator may not be a game-changer in the world of technical analysis, it represents a thoughtful refinement of a fundamental trading tool. By focusing on user convenience and visual clarity, it offers a practical solution for traders looking to optimize their chart analysis process and make more informed trading decisions.

Dynamic Score SMA [QuantAlgo]Dynamic Score SMA 📈🌊
The Dynamic Score SMA by QuantAlgo offers a powerful trend-following approach that combines the simplicity of the Simple Moving Average (SMA) with an innovative dynamic trend scoring technique . By continuously evaluating price movement relative to the SMA over a customizable window, this indicator adapts to varying market conditions, providing traders and investors with clearer, more adaptable trend signals. With this dynamic scoring approach, the Dynamic Score SMA helps identify trend shifts, allowing for more strategic decision-making.
🌟 Conceptual Foundation and Innovation
At the core of the Dynamic Score SMA is its dynamic trend score system , which assesses price movements by comparing them to the SMA over a series of historical data points. This technique goes beyond traditional SMA indicators by offering a dynamic, probabilistic evaluation of trend strength, delivering a more responsive and nuanced view of market direction. The integration of this scoring system enables traders and investors to navigate both trending and sideway markets with greater confidence and precision.
⚙️ Technical Composition and Calculation
The Dynamic Score SMA leverages the Simple Moving Average to establish a baseline trend, with customizable SMA length to control the indicator’s sensitivity. The dynamic trend scoring technique then evaluates price behavior relative to the SMA over a specified window, generating a trend score that reflects the current market bias.
When the score crosses the designated uptrend or downtrend thresholds, the indicator signals a potential trend shift. By adjusting the SMA length, window duration, and thresholds, users can refine the indicator’s responsiveness to match their preferred trading or investing strategy, making it suitable for both volatile and steady markets.
📈 Features and Practical Applications
Customizable SMA Length: Set the length of the SMA to control how sensitive the trend is to price changes. Longer lengths produce smoother trends, while shorter lengths increase responsiveness.
Window Length for Dynamic Scoring: Adjust the window length to determine how many data points are considered in the dynamic trend score calculation, allowing for more tailored analysis of recent versus long-term trends.
Uptrend/Downtrend Thresholds: Define thresholds for triggering trend signals. Higher thresholds reduce sensitivity, providing clearer signals in volatile markets, while lower thresholds capture shorter-term movements.
Bar and Background Coloring: Visual cues, including bar coloring and background fills, provide a quick reference for current trend direction, making it easier to monitor market conditions.
Trend Confirmation: The dynamic trend scoring system verifies trend strength, offering more reliable entry and exit points by filtering out potential false signals.
⚡️ How to Use
✅ Add the Indicator: Add the Dynamic Score SMA to your favourites, then apply it to your chart. Customize the SMA length, window size, and thresholds to match your trading or investing preferences.
👀 Monitor Trend Shifts: Observe the trend in relation to the SMA and watch for signals when the score crosses key thresholds. Bar and/or background coloring will help identify the current trend direction and any shifts in momentum.
🔔 Set Alerts: Configure alerts for significant trend crossovers and reversals, enabling you to act on market changes in real-time without needing constant chart observation.
💫 Summary and Usage Tips
The Dynamic Score SMA by QuantAlgo is a sophisticated trend-following indicator that combines the familiarity of the SMA with a dynamic trend scoring system, providing a more adaptable and probabilistic approach to trend analysis. By tailoring the SMA length, scoring window, and thresholds, traders and investors can fine-tune the indicator for both short-term adjustments and long-term trend following. For optimal use, adjust sensitivity based on market volatility, and rely on the visual cues for clear trend confirmation. Whether you’re navigating choppy markets or stable trends, the Dynamic Score SMA offers a refined approach to capturing market direction with enhanced precision.

CPR by NKDCentral Pivot Range (CPR) Trading Strategy:
The Central Pivot Range (CPR) is a widely-used tool in technical analysis, helping traders pinpoint potential support and resistance levels in the market. By using the CPR effectively, traders can better gauge market trends and determine favorable entry and exit points. This guide explores how the CPR works, outlines its calculation, and describes how traders can enhance their strategies using an extended 10-line version of CPR.
What Really Central Pivot Range (CPR) is?
At its core, the CPR consists of three key lines:
Pivot Point (PP) – The central line, calculated as the average of the previous day’s high, low, and closing prices.
Upper Range (R1) – Positioned above the Pivot Point, acting as a potential ceiling where price may face resistance.
Lower Range (S1) – Found below the Pivot Point, serving as a potential floor where price might find support.
Advanced traders often expand on the traditional three-line CPR by adding extra levels above and below the pivot, creating up to a 10-line system. This extended CPR allows for a more nuanced understanding of the market and helps identify more detailed trading opportunities.
Applying CPR for Trading Success
1. How CPR is Calculation
The CPR relies on the previous day's high (H), low (L), and close (C) prices to create its structure:
Pivot Point (PP) = (H + L + C) / 3
First Resistance (R1) = (2 * PP) - L
First Support (S1) = (2 * PP) - H
Additional resistance levels (R2, R3) and support levels (S2, S3) are calculated by adding or subtracting multiples of the previous day’s price range (H - L) from the Pivot Point.
2. Recognizing the Market Trend
To effectively trade using CPR, it’s essential to first determine whether the market is trending up (bullish) or down (bearish). In an upward-trending market, traders focus on buying at support levels, while in a downward market, they look to sell near resistance.
3. Finding Ideal Entry Points
Traders often look to enter trades when price approaches key levels within the CPR range. Support levels (S1, S2) offer buying opportunities, while resistance levels (R1, R2) provide selling opportunities. These points are considered potential reversal zones, where price may bounce or reverse direction.
4. Managing Risk with Stop-Loss Orders
Proper risk management is crucial in any trading strategy. A stop-loss should be set slightly beyond the support level for buy positions and above the resistance level for sell positions, ensuring that losses are contained if the market moves against the trader’s position.
5. Determining Profit Targets
Profit targets are typically set based on the distance between entry points and the next support or resistance level. Many traders apply a risk-reward ratio, aiming for larger potential profits compared to the potential losses. However, if the next resistance and support level is far then middle levels are used for targets (i.e. 50% of R1 and R2)
6. Confirmation Through Other Indicators
While CPR provides strong support and resistance levels, traders often use additional indicators to confirm potential trade setups. Indicators such as moving averages can
help validate the signals provided by the CPR.
7. Monitoring Price Action At CPR Levels
Constantly monitoring price movement near CPR levels is essential. If the price fails to break through a resistance level (R1) or holds firm at support (S1), it can offer cues on when to exit or adjust a trade. However, a strong price break past these levels often signals a continued trend.
8. Trading Breakouts with CPR
When the price breaks above resistance or below support with strong momentum, it may signal a potential breakout. Traders can capitalize on these movements by entering positions in the direction of the breakout, ideally confirmed by volume or other technical indicators.
9. Adapting to Changing Market Conditions
CPR should be used in the context of broader market influences, such as economic reports, news events, or geopolitical shifts. These factors can dramatically affect market direction and how price reacts to CPR levels, making it important to stay informed about external market conditions.
10. Practice and Backtesting for Improvements
Like any trading tool, the CPR requires practice. Traders are encouraged to backtest their strategies on historical price data to get a better sense of how CPR works in different market environments. Continuous analysis and practice help improve decision-making and strategy refinement.
The Advantages of Using a 10-Line CPR System
An extended 10-line CPR system—comprising up to five resistance and five support levels—provides more granular control and insight into market movements. This expanded view helps traders better gauge trends and identify more opportunities for entry and exit. Key benefits include:
R2, S2 Levels: These act as secondary resistance or support zones, giving traders additional opportunities to refine their trade entries and exits.
R3, S3 Levels: Provide an even wider range for identifying reversals or trend continuations in more volatile markets.
Flexibility: The broader range of levels allows traders to adapt to changing market conditions and make more precise decisions based on market momentum.
So in Essential:
The Central Pivot Range is a valuable tool for traders looking to identify critical price levels in the market. By providing a clear framework for identifying potential support and resistance zones, it helps traders make informed decisions about entering and exiting trades. However, it’s important to combine CPR with sound risk management and additional confirmation through other technical indicators for the best results.
Although no trading tool guarantees success, the CPR, when used effectively and combined with practice, can significantly enhance a trader’s ability to navigate market fluctuations.

Options Series - Supertrend, HalfTrend, Ichimoku Cloud and P_SAR➤ Supertrend:
➤ HalfTrend:
➤ Ichimoku Cloud:
➤ Parabolic SAR:
⭐ Overview and How It Works:
This script combines multiple popular technical indicators—Supertrend, HalfTrend, Ichimoku Cloud, and Parabolic SAR—into a single, cohesive tool for analyzing price trends and reversals. Designed for traders who prefer multi-layered confirmation, it displays non-overlay signals in a candlestick format, helping users make sense of intricate market dynamics. It also includes a "Master Candle" condition, which aggregates the signals from all indicators, providing a powerful snapshot of market sentiment.
References for study,
Supertrend and HalfTrend and Ichimoku Cloud and Parabolic SAR
⭐ Key Features and Functionality:
The script integrates four indicators and visually represents them in a non-overlay fashion, meaning that each indicator's signal appears on separate candlestick layers. It uses color coding to differentiate between bullish and bearish signals. The Master Candle is a unique feature that aggregates the signals from all indicators to show the overall sentiment.
Supertrend: It uses ATR and a multiplier factor to create a trailing stop, identifying bullish and bearish trends.
HalfTrend: It analyzes market volatility that provides buy and sell signals based on volatility channels and historical highs and lows.
Ichimoku Cloud: It leverages historical highs and lows to form the conversion and baseline, which are compared to assess market strength.
Parabolic SAR: A stop-and-reverse system that highlights potential reversals. It is based on time and price, offering traders potential reversal points.
Master Candle: It computes a score based on the confluence of all four indicators, adding another layer of confirmation.
🎨 Visualizations and User Experience:
The script's user interface is highly visual, with color-coded candlesticks plotted across multiple layers. Each indicator has its own color coding for bullish and bearish signals, ensuring clarity:
➤ Green for bullish signals.
➤ Red for bearish signals.
➤ Each candlestick layer represents a different indicator (e.g., Supertrend, HalfTrend, etc.), making it easy for the trader to isolate and interpret signals.
➤ The "Master Candle" provides an overarching view of the market by displaying a consolidated signal, which can reduce confusion from mixed indicator signals.
⭐ Settings and Customization:
The script is highly customizable, allowing users to adjust the settings for each indicator. Key customizable parameters include:
• Supertrend ATR Period and Factor
• HalfTrend Amplitude and Channel Deviation
• Ichimoku Conversion, Base, and Lagging Span Periods
• Parabolic SAR Start, Increment, and Maximum value
Additionally, users can toggle the visibility of each indicator and customize the look of the plot to suit their preferences.
⭐ Uniqueness of the Concept:
No repaints. This is the advanced representation and the combination of multiple indicators into a single script, along with a powerful "Master Candle" that aggregates them, makes this tool unique. Most scripts provide isolated indicator signals, while this one brings together four powerful indicators and visually simplifies the analysis. The non-overlay style and color-coded candlesticks offer traders an easy-to-understand, actionable visual cue, which stands out from traditional indicator overlays.
🚀 Conclusion:
This script is a comprehensive, multi-indicator trading tool suitable for traders looking for reliable trend-following and reversal detection. Its ability to provide an aggregated "Master Candle" signal reduces noise and aids in better decision-making. Customization options allow users to tailor it to their trading style, while its clear visualizations provide an excellent user experience.

Technical Analysis ExpressionsDescription:
The indicator allows to display different moving averages and price levels from any timeframe. Instead of setting each plot one by one, you can specify all of them in one expression.
Inputs:
There's only one input, which is a text area where you can specify each plot as an expression. Each expression must be on a new line. Each expression can specify the source of the displayed values, the plot color and the timeframe from which that value is taken.
Here's an example expression that will plot SMA(20) of Close price from Daily timeframe, and the plot is going to be red. This will also plot an EMA(50) of High price from current timeframe, and the plot is going to be green (notice that you can specify the color as one of the standard Pinescript colors, or using a HEX color, and even using transparency if needed):
SMA(close, 20) red "D"
EMA(high, 50) #00ff00
You can also specify the color to be "chart.fg" which is the Foreground Color of current chart (it depends on whether the "Dark Theme" is enabled in Tradingview). The available moving averages are: SMA, EMA, WMA, HMA, RMA, VWMA. The available sources are: open, high, low, close, hl2, hlc3, hlcc4, ohlc4.

Multi-Scale Adaptive MAs (Hurst, CVaR, Fractal) // AlgoFyreThe Multi-Scale Adaptive MAs (Hurst, CVaR, Fractal) indicator adjusts moving averages based on market conditions, using Hurst Exponent for trend persistence, CVaR for extreme risk assessment, and Fractal Dimension for market complexity. It enhances trend detection and risk management across various timeframes.
TABLE OF CONTENTS
🔶 ORIGINALITY 🔸Adaptive Mechanisms
🔸Multi-Faceted Analysis
🔸Versatility Across Timeframes
🔸Multi-Scale Combination
🔶 FUNCTIONALITY 🔸Hurst Exponent (H)
🞘 How it works
🞘 How to calculate
🞘 Code extract
🔸Conditional Value at Risk (CVaR)
🞘 How it works
🞘 How to calculate
🞘 Code extract
🔸Fractal Dimension (FD)
🞘 How it works
🞘 How to calculate
🞘 Code extract
🔶 INSTRUCTIONS 🔸Step-by-Step Guidelines
🞘 Setting Up the Indicator
🞘 Understanding What to Look For on the Chart
🞘 Possible Entry Signals
🞘 Possible Take Profit Strategies
🞘 Possible Stop-Loss Levels
🞘 Additional Tips
🔸Customize settings
🔶 CONCLUSION
▅▅▅▅▅▅▅▅▅▅▅▅▅▅▅▅▅▅▅▅▅▅▅▅▅▅▅▅▅▅▅▅▅▅▅▅▅▅▅▅▅▅▅▅▅▅
🔶 ORIGINALITY The Multi-Scale Adaptive MAs (Hurst, CVaR, Fractal) indicator stands out due to its unique approach of dynamically adjusting moving averages based on advanced statistical measures, making it highly responsive to varying market conditions. Unlike traditional moving averages that rely on static periods, this indicator adapts in real-time using three distinct adaptive methods: Hurst Exponent, CVaR, and Fractal Dimension.
🔸Adaptive Mechanisms
Traditional MA indicators use fixed lengths, which can lead to lagging signals or over-sensitivity in volatile markets. The Multi-Scale Adaptive MAs employ adaptive methods to adjust the MA length dynamically, providing a more accurate reflection of current market conditions.
🔸Multi-Faceted Analysis
By integrating Hurst Exponent, CVaR, and Fractal Dimension, the indicator offers a comprehensive market analysis. It captures different aspects of market behavior, including trend persistence, risk of extreme movements, and complexity, which are often missed by standard MAs.
🔸Versatility Across Timeframes
The indicator’s ability to switch between different adaptive methods based on market conditions allows traders to analyze short-term, medium-term, and long-term trends with enhanced precision.
🔸Multi-Scale Combination
Utilizing multiple adaptive MAs in combination provides a more nuanced view of the market, allowing traders to see how short, medium, and long-term trends interact. This layered approach helps in identifying the strength and consistency of trends across different scales, offering more reliable signals and aiding in complex decision-making processes. When combined, these MAs can also signal key market shifts when they converge or diverge, offering deeper insights than a single MA could provide.
🔶 FUNCTIONALITY The indicator adjusts moving averages based on a variety of different choosable adaptives. The Hurst Exponent to identify trend persistence or mean reversion, adapting to market conditions for both short-term and long-term trends. Using CVaR, it evaluates the risk of extreme price movements, ensuring the moving average is more conservative during high-risk periods, protecting against potential large losses. By incorporating the Fractal Dimension, the indicator adapts to market complexity, adjusting to varying levels of price roughness and volatility, which allows it to respond more accurately to different market structures and patterns.
Let's dive into the details:
🔸Hurst Exponent (H)
Measures the degree of trend persistence or mean reversion.
By using the Hurst Exponent, the indicator adjusts to capture the strength and duration of trends, helping traders to stay in profitable trades longer and avoid false reversals in ranging markets.
It enhances the detection of trends, making it suitable for both short-term scalping and identifying long-term trends.
🞘 How it works Rescaled Range (R/S) Analysis Calculate the mean of the closing prices over a set window.
Determine the deviation of each price from the mean.
Compute the cumulative sum of these deviations over the window.
Calculate the range (R) of the cumulative deviations (maximum minus minimum).
Compute the standard deviation (S) of the price series over the window.
Obtain the R/S ratio as R/S.
Linear Regression for Hurst Exponent Calculate the logarithm of multiple window sizes and their corresponding R/S values.
Use linear regression to determine the slope of the line fitting the log(R/S) against log(window size).
The slope of this line is an estimate of the Hurst Exponent.
🞘 How to calculate Range (R)
Calculate the maximum cumulative deviation:
R=max(sum(deviation))−min(sum(deviation))
Where deviation is the difference between each price and the mean.
Standard Deviation (S)
Calculate the standard deviation of the price series:
S=sqrt((1/(n−1))∗sum((Xi−mean)2))
Rescaled Range (R/S)
Divide the range by the standard deviation:
R/S=R/S
Hurst Exponent
Perform linear regression to estimate the slope of:
log(R/S) versus log(windowsize)
The slope of this line is the Hurst Exponent.
🞘 Code extract // Hurst Exponent
calc_hurst(source_, adaptive_window_) =>
window_sizes = array.from(adaptive_window_/10, adaptive_window_/5, adaptive_window_/2, adaptive_window_)
float hurst_exp = 0.5
// Calculate Hurst Exponent proxy
rs_list = array.new_float()
log_length_list = array.new_float()
for i = 0 to array.size(window_sizes) - 1
len = array.get(window_sizes, i)
// Ensure we have enough data
if bar_index >= len * 2
mean = adaptive_sma(source_, len)
dev = source_ - mean
// Calculate cumulative deviations over the window
cum_dev = ta.cum(dev) - ta.cum(dev )
r = ta.highest(cum_dev, len) - ta.lowest(cum_dev, len)
s = ta.stdev(source_, len)
if s != 0
rs = r / s
array.push(rs_list, math.log(rs))
array.push(log_length_list, math.log(len))
// Linear regression to estimate Hurst Exponent
n = array.size(log_length_list)
if n > 1
mean_x = array.sum(log_length_list) / n
mean_y = array.sum(rs_list) / n
sum_num = 0.0
sum_den = 0.0
for i = 0 to n - 1
x = array.get(log_length_list, i)
y = array.get(rs_list, i)
sum_num += (x - mean_x) * (y - mean_y)
sum_den += (x - mean_x) * (x - mean_x)
hurst_exp := sum_den != 0 ? sum_num / sum_den : 0.5
else
hurst_exp := 0.5 // Default to 0.5 if not enough data
hurst_exp
🔸Conditional Value at Risk (CVaR)
Assesses the risk of extreme losses by focusing on tail risk.
This method adjusts the moving average to account for market conditions where extreme price movements are likely, providing a more conservative approach during periods of high risk.
Traders benefit by better managing risk and avoiding major losses during volatile market conditions.
🞘 How it works Calculate Returns Determine the returns as the percentage change between consecutive closing prices over a specified window.
Percentile Calculation Identify the percentile threshold (e.g., the 5th percentile) for the worst returns in the dataset.
Average of Extreme Losses Calculate the average of all returns that are less than or equal to this percentile, representing the CVaR.
🞘 How to calculate Return Calculation
Calculate the return as the percentage change between consecutive prices:
Return = (Pt − Pt−1) / Pt−1
Where Pt is the price at time t.
Percentile Threshold
Identify the return value at the specified percentile (e.g., 5th percentile):
PercentileValue=percentile(returns,percentile_threshold)
CVaR Calculation
Compute the average of all returns below the percentile threshold:
CVaR = (1/n)∗sum(Return) for all Return≤PercentileValue
Where n is the total number of returns.
🞘 Code extract // Percentile
calc_percentile(data, percentile, window) =>
arr = array.new_float(0)
for i = 0 to window - 1
array.push(arr, data )
array.sort(arr)
index = math.floor(percentile / 100 * (window - 1))
array.get(arr, index)
// Conditional Value at Risk
calc_cvar(percentile_value, returns, window) =>
// Collect returns worse than the threshold
cvar_sum = 0.0
cvar_count = 0
for i = 0 to window - 1
ret = returns
if ret <= percentile_value
cvar_sum += ret
cvar_count += 1
// Calculate CVaR
cvar = cvar_count > 0 ? cvar_sum / cvar_count : 0.0
cvar
🔸Fractal Dimension (FD)
Evaluates market complexity and roughness by analyzing how price movements behave across different scales.
It enables the moving average to adapt based on the level of market noise or structure, allowing for smoother MAs during complex, volatile periods and more sensitive MAs during clear trends.
This adaptability is crucial for traders dealing with varying market states, improving the indicator's responsiveness to price changes.
🞘 How it works Total Distance (L) Calculation Sum the absolute price movements between consecutive periods over a given window.
Maximum Distance (D) Calculation Calculate the maximum displacement from the first to the last price point within the window.
Calculate Fractal Dimension Use Katz's method to estimate the Fractal Dimension as the ratio of the logarithms of L and D, divided by the logarithm of the number of steps (N).
🞘 How to calculate Total Distance (L)
Sum the absolute price changes over the window:
L=sum(abs(Pt−Pt−1)) for t from 2 to n
Where Pt is the price at time t.
Maximum Distance (D)
Find the maximum absolute displacement from the first to the last price in the window:
D=max(abs(Pn-P1))
Fractal Dimension Calculation
Use Katz's method to estimate fractal dimension:
FD=log(L/D)/log(N)
Where N is the number of steps in the window.
🞘 Code extract // Fractal Dimension
calc_fractal(source_, adaptive_window_) =>
// Calculate the total distance (L) traveled by the price
L = 0.0
for i = 1 to adaptive_window_
L += math.abs(source_ - source_ )
// Calculate the maximum distance between first and last price
D = math.max(math.abs(source_ - source_ ), 1e-10) // Avoid division by zero
// Calculate the number of steps (N)
N = adaptive_window_
// Estimate the Fractal Dimension using Katz's formula
math.log(L / D) / math.log(N)
🔶 INSTRUCTIONS The Multi-Scale Adaptive MAs indicator can be set up by adding it to your TradingView chart and configuring the adaptive method (Hurst, CVaR, or Fractal) to match current market conditions. Look for price crossovers and changes in the slope for potential entry signals. Set take profit and stop-loss levels based on dynamic changes in the moving average, and consider combining it with other indicators for confirmation. Adjust settings and use adaptive strategies for enhanced trend detection and risk management.
🔸Step-by-Step Guidelines 🞘 Setting Up the Indicator Adding the Indicator to the Chart: Go to your TradingView chart.
Click on the "Indicators" button at the top.
Search for "Multi-Scale Adaptive MAs (Hurst, CVaR, Fractal)" in the indicators list.
Click on the indicator to add it to your chart.
Configuring the Indicator: Open the indicator settings by clicking on the gear icon next to its name on the chart.
Adaptive Method: Choose between "Hurst," "CVaR," and "Fractal" depending on the market condition and your trading style.
Length: Set the base length for the moving average (e.g., 20, 50, or 100). This length will be adjusted dynamically based on the selected adaptive method.
Other Parameters: Adjust any other parameters as needed, such as window sizes or scaling factors specific to each adaptive method.
Chart Setup: Ensure you have an appropriate timeframe selected (e.g., 1-hour, 4-hour, daily) based on your trading strategy.
Consider using additional indicators like volume or RSI to confirm signals.
🞘 Understanding What to Look For on the Chart Indicator Behavior: Observe how the adaptive moving average (AMA) behaves compared to standard moving averages, e.g. notice how it might change direction with strength (Hurst).
For example, the AMA may become smoother during high market volatility (CVaR) or more responsive during strong trends (Hurst).
Crossovers: Look for crossovers between the price and the adaptive moving average.
A bullish crossover occurs when the price crosses above the AMA, suggesting a potential uptrend.
A bearish crossover occurs when the price crosses below the AMA, indicating a possible downtrend.
Slope and Direction: Pay attention to the slope of the AMA. A rising slope suggests a bullish trend, while a declining slope indicates a bearish trend.
The slope’s steepness can give you clues about the trend's strength.
🞘 Possible Entry Signals Bullish Entry: Crossover Entry: Enter a long position when the price crosses above the AMA and the AMA has a positive slope.
Confirmation Entry: Combine the crossover with other indicators like RSI (above 50) or increasing volume for confirmation.
Bearish Entry: Crossover Entry: Enter a short position when the price crosses below the AMA and the AMA has a negative slope.
Confirmation Entry: Use additional indicators like RSI (below 50) or decreasing volume to confirm the bearish trend.
Adaptive Method Confirmation: Hurst: Enter when the AMA indicates a strong trend (steeper slope). Suitable for trend-following strategies.
CVaR: Be cautious during high-risk periods. Enter only if confirmed by other indicators, as the AMA may become more conservative.
Fractal: Ideal for capturing reversals in complex markets. Look for crossovers in volatile markets.
🞘 Possible Take Profit Strategies Static Take Profit Levels: Set take profit levels based on predefined ratios (e.g., 1:2 or 1:3 risk-reward ratio).
Place take profit orders at recent swing highs (for long positions) or swing lows (for short positions).
Trailing Stop Loss: Use a trailing stop based on a percentage of the AMA value to lock in profits as the trend progresses.
Adjust the trailing stop dynamically to follow the AMA, allowing profits to run while protecting gains.
Adaptive Method Based Exits: Hurst: Exit when the AMA begins to flatten or turn in the opposite direction, signaling a potential trend reversal.
CVaR: Consider taking profits earlier during high-risk periods when the AMA suggests caution.
Fractal: Use the AMA to exit in complex markets when it smooths out, indicating reduced volatility.
🞘 Possible Stop-Loss Levels Initial Stop Loss: Place an initial stop loss below the AMA (for long positions) or above the AMA (for short positions) to protect against adverse movements.
Use a buffer (e.g., ATR value) to avoid being stopped out by normal price fluctuations.
Adaptive Stop Loss: Adjust the stop loss dynamically based on the AMA. Move the stop loss along the AMA as the trend progresses to minimize risk.
This helps in adapting to changing market conditions and avoiding premature exits.
Adaptive Method-Specific Stop Loss: Hurst: Use wider stops during trending markets to allow for minor pullbacks.
CVaR: Adjust stops in high-risk periods to avoid being stopped out prematurely during price fluctuations.
Fractal: Place stops at recent support/resistance levels in highly volatile markets.
🞘 Additional Tips Combine with Other Indicators: Enhance your strategy by combining the AMA with other technical indicators like MACD, RSI, or Bollinger Bands for better signal confirmation.
Backtesting and Practice: Backtest the indicator on historical data to understand how it performs in different market conditions.
Practice using the indicator on a demo account before applying it to live trading.
Market Awareness: Always be aware of market conditions and fundamental events that might impact price movements, as the AMA reacts to price action and may not account for sudden news-driven events.
🔸Customize settings 🞘 Time Override: Enables or disables the ability to override the default time frame for the moving averages. When enabled, you can specify a custom time frame for the calculations.
🞘 Time: Specifies the custom time frame to use when the Time Override setting is enabled.
🞘 Enable MA: Enables or disables the moving average. When disabled, MA will not be displayed on the chart.
🞘 Show Smoothing Line: Enables or disables the display of a smoothing line for the moving average. The smoothing line helps to reduce noise and provide a clearer trend.
🞘 Show as Horizontal Line: Displays the moving average as a horizontal line instead of a dynamic line that follows the price.
🞘 Source: Specifies the data source for the moving average calculation (e.g., close, open, high, low).
🞘 Length: Sets the period length for the moving average. A longer length will result in a smoother moving average, while a shorter length will make it more responsive to price changes.
🞘 Time: Specifies a custom time frame for the moving average, overriding the default time frame if Time Override is enabled.
🞘 Method: Selects the calculation method for the moving average (e.g., SMA, EMA, SMMA, WMA, VWMA).
🞘 Offset: Shifts the moving average forward or backward by the specified number of bars.
🞘 Color: Sets the color for the moving average line.
🞘 Adaptive Method: Selects the adaptive method to dynamically adjust the moving average based on market conditions (e.g., Hurst, CVaR, Fractal).
🞘 Window Size: Sets the window size for the adaptive method, determining how much historical data is used for the calculation.
🞘 CVaR Scaling Factor: Adjusts the influence of CVaR on the moving average length, controlling how much the length changes based on calculated risk.
🞘 CVaR Risk: Specifies the percentile cutoff for the worst-case returns used in the CVaR calculation to assess extreme losses.
🞘 Smoothing Method: Selects the method for smoothing the moving average (e.g., SMA, EMA, SMMA, WMA, VWMA).
🞘 Smoothing Length: Sets the period length for smoothing the moving average.
🞘 Fill Color to Smoothing Moving Average: Enables or disables the color fill between the moving average and its smoothing line.
🞘 Transparency: Sets the transparency level for the color fill between the moving average and its smoothing line.
🞘 Show Label: Enables or disables the display of a label for the moving average on the chart.
🞘 Show Label for Smoothing: Enables or disables the display of a label for the smoothing line of the moving average on the chart.
🔶 CONCLUSION The Multi-Scale Adaptive MAs indicator offers a sophisticated approach to trend analysis and risk management by dynamically adjusting moving averages based on Hurst Exponent, CVaR, and Fractal Dimension. This adaptability allows traders to respond more effectively to varying market conditions, capturing trends and managing risks with greater precision. By incorporating advanced statistical measures, the indicator goes beyond traditional moving averages, providing a nuanced and versatile tool for both short-term and long-term trading strategies. Its unique ability to reflect market complexity and extreme risks makes it an invaluable asset for traders seeking a deeper understanding of market dynamics.

Fear/Greed Zone Reversals [UAlgo]The "Fear/Greed Zone Reversals " indicator is a custom technical analysis tool designed for TradingView, aimed at identifying potential reversal points in the market based on sentiment zones characterized by fear and greed. This indicator utilizes a combination of moving averages, standard deviations, and price action to detect when the market transitions from extreme fear to greed or vice versa. By identifying these critical turning points, traders can gain insights into potential buy or sell opportunities.
🔶 Key Features
Customizable Moving Averages: The indicator allows users to select from various types of moving averages (SMA, EMA, WMA, VWMA, HMA) for both fear and greed zone calculations, enabling flexible adaptation to different trading strategies.
Fear Zone Settings:
Fear Source: Select the price data point (e.g., close, high, low) used for Fear Zone calculations.
Fear Period: This defines the lookback window for calculating the Fear Zone deviation.
Fear Stdev Period: This sets the period used to calculate the standard deviation of the Fear Zone deviation.
Greed Zone Settings:
Greed Source: Select the price data point (e.g., close, high, low) used for Greed Zone calculations.
Greed Period: This defines the lookback window for calculating the Greed Zone deviation.
Greed Stdev Period: This sets the period used to calculate the standard deviation of the Greed Zone deviation.
Alert Conditions: Integrated alert conditions notify traders in real-time when a reversal in the fear or greed zone is detected, allowing for timely decision-making.
🔶 Interpreting Indicator
Greed Zone: A Greed Zone is highlighted when the price deviates significantly above the chosen moving average. This suggests market sentiment might be leaning towards greed, potentially indicating a selling opportunity.
Fear Zone Reversal: A Fear Zone is highlighted when the price deviates significantly below the chosen moving average of the selected price source. This suggests market sentiment might be leaning towards fear, potentially indicating a buying opportunity. When the indicator identifies a reversal from a fear zone, it suggests that the market is transitioning from a period of intense selling pressure to a more neutral or potentially bullish state. This is typically indicated by an upward arrow (▲) on the chart, signaling a potential buy opportunity. The fear zone is characterized by high price volatility and overselling, making it a crucial point for traders to consider entering the market.
Greed Zone Reversal: Conversely, a Greed Zone is highlighted when the price deviates significantly above the chosen moving average. This suggests market sentiment might be leaning towards greed, potentially indicating a selling opportunity. When the indicator detects a reversal from a greed zone, it indicates that the market may be moving from an overbought condition back to a more neutral or bearish state. This is marked by a downward arrow (▼) on the chart, suggesting a potential sell opportunity. The greed zone is often associated with overconfidence and high buying activity, which can precede a market correction.
🔶 Why offer multiple moving average types?
By providing various moving average types (SMA, EMA, WMA, VWMA, HMA) , the indicator offers greater flexibility for traders to tailor the indicator to their specific trading strategies and market preferences. Different moving averages react differently to price data and can produce varying signals.
SMA (Simple Moving Average): Provides an equal weighting to all data points within the specified period.
EMA (Exponential Moving Average): Gives more weight to recent data points, making it more responsive to price changes.
WMA (Weighted Moving Average): Allows for custom weighting of data points, providing more flexibility in the calculation.
VWMA (Volume Weighted Moving Average): Considers both price and volume data, giving more weight to periods with higher trading volume.
HMA (Hull Moving Average): A combination of weighted moving averages designed to reduce lag and provide a smoother curve.
Offering multiple options allows traders to:
Experiment: Traders can try different moving averages to see which one produces the most accurate signals for their specific market.
Adapt to different market conditions: Different market conditions may require different moving average types. For example, a fast-moving market might benefit from a faster moving average like an EMA, while a slower-moving market might be better suited to a slower moving average like an SMA.
Personalize: Traders can choose the moving average that best aligns with their personal trading style and risk tolerance.
In essence, providing a variety of moving average types empowers traders to create a more personalized and effective trading experience.
🔶 Disclaimer
Use with Caution: This indicator is provided for educational and informational purposes only and should not be considered as financial advice. Users should exercise caution and perform their own analysis before making trading decisions based on the indicator's signals.
Not Financial Advice: The information provided by this indicator does not constitute financial advice, and the creator (UAlgo) shall not be held responsible for any trading losses incurred as a result of using this indicator.
Backtesting Recommended: Traders are encouraged to backtest the indicator thoroughly on historical data before using it in live trading to assess its performance and suitability for their trading strategies.
Risk Management: Trading involves inherent risks, and users should implement proper risk management strategies, including but not limited to stop-loss orders and position sizing, to mitigate potential losses.
No Guarantees: The accuracy and reliability of the indicator's signals cannot be guaranteed, as they are based on historical price data and past performance may not be indicative of future results.

Swing Trend AnalysisIntroducing the Swing Trend Analyzer: A Powerful Tool for Swing and Positional Trading
The Swing Trend Analyzer is a cutting-edge indicator designed to enhance your swing and positional trading by providing precise entry points based on volatility contraction patterns and other key technical signals. This versatile tool is packed with features that cater to traders of all timeframes, offering flexibility, clarity, and actionable insights.
Key Features:
1. Adaptive Moving Averages:
The Swing Trend Analyzer offers multiple moving averages tailored to the timeframe you are trading on. On the daily chart, you can select up to four different moving average lengths, while all other timeframes provide three moving averages. This flexibility allows you to fine-tune your analysis according to your trading strategy. Disabling a moving average is as simple as setting its value to zero, making it easy to customize the indicator to your needs.
2. Dynamic Moving Average Colors Based on Relative Strength:
This feature allows you to compare the performance of the current ticker against a major index or any symbol of your choice. The moving average will change color based on whether the ticker is outperforming or underperforming the selected index over the chosen period. For example, on a daily chart, if the 21-day moving average turns blue, it indicates that the ticker has outperformed the selected index over the last 21 days. This visual cue helps you quickly identify relative strength, a key factor in successful swing trading.
3. Visual Identification of Price Contractions:
The Swing Trend Analyzer changes the color of price bars to white (on a dark theme) or black (on a light theme) when a contraction in price is detected. Price contractions are highlighted when either of the following conditions is met: a) the current bar is an inside bar, or b) the price range of the current bar is less than the 14-period Average Daily Range (ADR). This feature makes it easier to spot price contractions across all timeframes, which is crucial for timing entries in swing trading.
4. Overhead Supply Detection with Automated Resistance Lines:
The indicator intelligently detects the presence of overhead supply and draws a single resistance line to avoid clutter on the chart. As price breaches the resistance line, the old line is automatically deleted, and a new resistance line is drawn at the appropriate level. This helps you focus on the most relevant resistance levels, reducing noise and improving decision-making.
5. Buyable Gap Up Marker: The indicator highlights bars in blue when a candle opens with a gap that remains unfilled. These bars are potential Buyable Gap Up (BGU) candidates, signaling opportunities for long-side entries.
6. Comprehensive Swing Trading Information Table:
The indicator includes a detailed table that provides essential data for swing trading:
a. Sector and Industry Information: Understand the sector and industry of the ticker to identify stocks within strong sectors.
b. Key Moving Averages Distances (10MA, 21MA, 50MA, 200MA): Quickly assess how far the current price is from key moving averages. The color coding indicates whether the price is near or far from these averages, offering vital visual cues.
c. Price Range Analysis: Compare the current bar's price range with the previous bar's range to spot contraction patterns.
d. ADR (20, 10, 5): Displays the Average Daily Range over the last 20, 10, and 5 periods, crucial for identifying contraction patterns. On the weekly chart, the ADR continues to provide daily chart information.
e. 52-Week High/Low Data: Shows how close the stock is to its 52-week high or low, with color coding to highlight proximity, aiding in the identification of potential breakout or breakdown candidates.
f. 3-Month Price Gain: See the price gain over the last three months, which helps identify stocks with recent momentum.
7. Pocket Pivot Detection with Visual Markers:
Pocket pivots are a powerful bullish signal, especially relevant for swing trading. Pocket pivots are crucial for swing trading and are effective across all timeframes. The indicator marks pocket pivots with circular markers below the price bar:
a. 10-Day Pocket Pivot: Identified when the volume exceeds the maximum selling volume of the last 10 days. These are marked with a blue circle.
b. 5-Day Pocket Pivot: Identified when the volume exceeds the maximum selling volume of the last 5 days. These are marked with a green circle.
The Swing Trend Analyzer is designed to provide traders with the tools they need to succeed in swing and positional trading. Whether you're looking for precise entry points, analyzing relative strength, or identifying key price contractions, this indicator has you covered. Experience the power of advanced technical analysis with the Swing Trend Analyzer and take your trading to the next level.

VWAP Bands [TradingFinder] 26 Brokers Data (Forex + Crypto)🔵 Introduction
Indicators are tools that help analysts predict the price trend of a stock through mathematical calculations on price or trading volume. It is evident that trading volume significantly impacts the price trend of a stock symbol.
The Volume-Weighted Average Price (VWAP) indicator combines the influence of trading volume and price, providing technical analysts with a practical tool.
This technical indicator determines the volume-weighted average price of a symbol over a specified time period. Consequently, this indicator can be used to identify trends and entry or exit points.
🟣 Calculating the VWAP Indicator
Adding the VWAP indicator to a chart will automatically perform all calculations for you. However, if you wish to understand how this indicator is calculated, the following explains the steps involved.
Consider a 5-minute chart. In the first candle of this chart (which represents price information in the first 5 minutes), sum the high, low, and close prices, and divide by 3. Multiply the resulting number by the volume for the period and call it a variable (e.g., X).
Then, divide the resulting output by the total volume for that period to calculate your VWAP. To maintain the VWAP sequence throughout the trading day, it is necessary to add the X values obtained from each period to the previous period and divide by the total volume up to that time. It is worth noting that the calculation method is the same for intervals shorter than a day.
The mathematical formula for this VWAP indicator : VWAP = ∑ (Pi×Vi) / ∑ Vi
🔵 How to Use
Traders might consider the VWAP indicator as a tool for predicting trends. For example, they might buy a stock when the price is above the VWAP level and sell it when the price is below the VWAP.
In other words, when the price is above the VWAP, the price is rising, and when it is below the VWAP, the price is falling. Major traders and investment funds also use the VWAP ratio to help enter or exit stocks with the least possible market impact.
It is important to note that one should not rely solely on the VWAP indicator when analyzing symbols. This is because if prices rise quickly, the VWAP indicator may not adequately describe the conditions. This indicator is generally used for daily or shorter time frames because using longer intervals can distort the average.
Since this indicator uses past data in its calculations, it can be considered a lagging indicator. As a result, the more data there is, the greater the delay.
🟣 Difference Between VWAP and Simple Moving Average
On a chart, the VWAP and the simple moving average may look similar, but these two indicators have different calculations. The VWAP calculates the total price considering volume, while the simple moving average does not consider volume.
In simpler terms, the VWAP indicator measures each day's price change relative to the trading volume that occurred that day. In contrast, the simple moving average implicitly assumes that all trading days have the same volume.
🟣 Reasons Why Traders Like the VWAP Indicator
The VWAP Considers Volume: Since VWAP takes volume into account, it can be more reliable than a simple arithmetic average of prices. Theoretically, one person can buy 200,000 shares of a symbol in one transaction at a single price.
However, during the same time frame, 100 other people might place 200 different orders at various prices that do not total 100,000 shares. In this case, if you only consider the average price, you might be mistaken because trading volume is ignored.
The Indicator Can Help Day Traders: While reviewing your trades, you might notice that the shares you bought at market price are trading below the VWAP indicator.
In this case, there's no need to worry because with the help of VWAP, you always get a price below the average. By knowing the volume-weighted average price of a stock, you can easily make an informed decision about paying more or less than other traders for the stock.
VWAP Can Signal Market Trend Changes: Buying low and selling high can be an excellent strategy for individuals. However, you are looking to buy when prices start to rise and sell your shares when prices start to fall.
Since the VWAP indicator simulates a balanced price in the market, when the price crosses above the VWAP line, one can assume that traders are willing to pay more to acquire shares, and as a result, the market will grow. Conversely, when the price crosses below the line, this can be considered a sign of a downward movement.
🔵 Setting
Period : Indicator calculation time frame.
Source : The Price used for calculations.
Market Ultra Data : If you turn on this feature, 26 large brokers will be included in the calculation of the trading volume.
The advantage of this capability is to have more reliable volume data. You should be careful to specify the market you are in, FOREX brokers and Crypto brokers are different.
Multiplier : Coefficient of band lines.
