Multiple

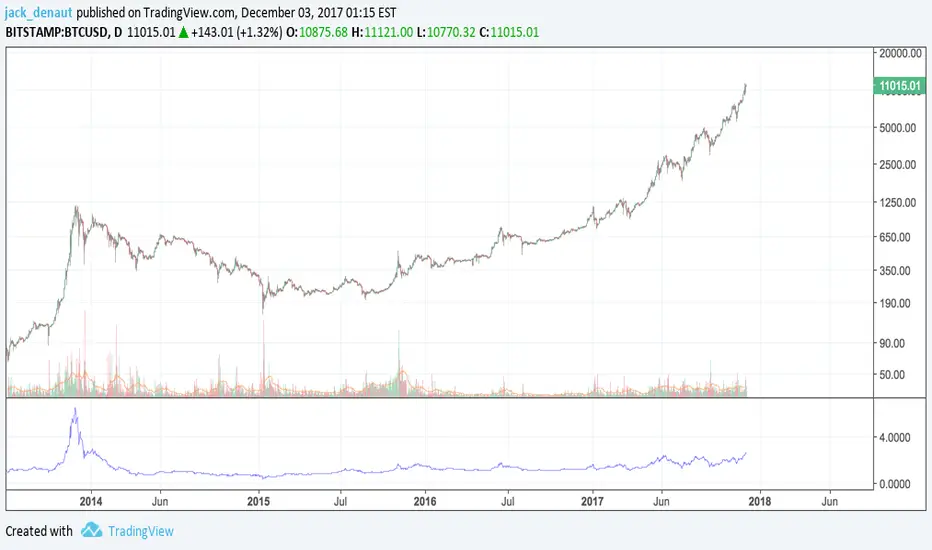
Mayer Multiple v2.0 - Klahr ThresholdThis is a simple update to the Mayer Multiple script by Unbound , which charts an indicator created by Trace Mayer and popularized by Preston Pysh.
The original post identified any price below 2.4x the 100-day MA as the BTC buy threshold. While the logic there is historically sound, it does not account for the fact that the BTC trend is parabolic in nature. With that in mind, I've attempted to update the 2.4x multiple to react based on the moving average of the Mayer Multiple itself. To do so, I simply found the number that, when added to the MM moving average, historically hit the 2.4x multiple during periods of low volatility. This turns out to be 1.17.
The green line represents the Klahr Threshold (is it obnoxious if I call it that? I've always wanted an indicator named after me). As you can see from the above chart, it hovers around 2.4x in late 2012 to early 2013, rises above it until mid 2014, and then stays below until 2016. It then stays almost exactly at 2.4x until April 2017, when it rises significantly above it for the first time since July 2014. The convergence in late 2012 and 2016-2017 is what leads me to believe that this should be the basis for the updated threshold.
It's entirely possible that there's a more robust method of calculating a reactive threshold (or a different number that should be added to the multiple's MA), but I think this is a good first step in refining the multiple to withstand the test of time.

Bitcoin MultipleMultiple of Bitcoin over the 200 day average.
Inspired from: www.theinvestorspodcast.com
Dinapoli Displaced Moving AveragesThanks to another TradingView member I was able to come up with Dinapoli's displaced MAs.
3X3
7X5
25X5
All in one.


BlackCompositIndicator4OverlayThis is not new indicator.
// Candle Patterns Indicator created by Robert N. 030715
// Volume Indicator @author LazyBear
// Updated and translated by Blyayshman
Это не новый индикатор - это компиляция нескольких для удобства одновременного отображения и экономии разрешенных индикаторов.
Эта версия для отображения на главном экране, вместе с графиком.
Можно отобразить до 4-х MA, 2-х EMA и анализатор паттернов японских свечей.
Пожелания и предложения приветствуются.
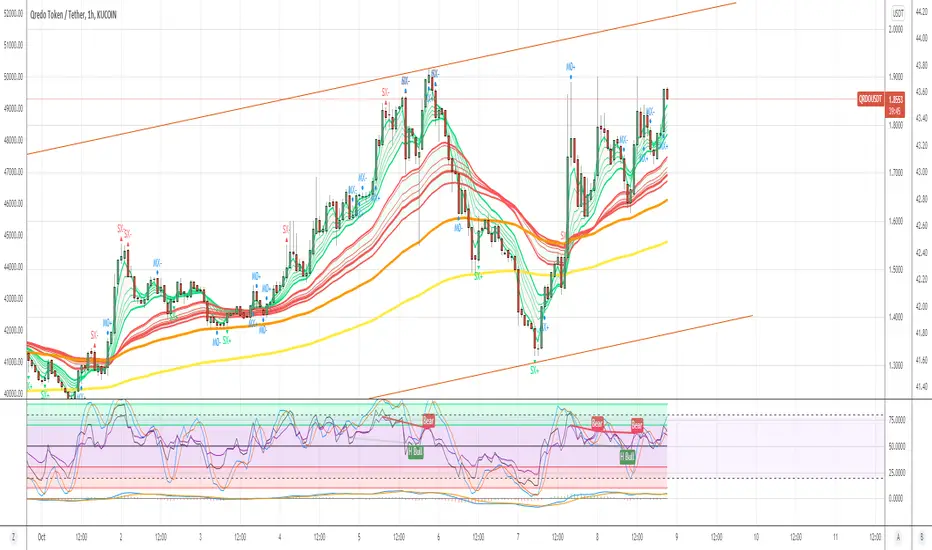
[naoligo] 10x MA (H, D, W, M)This one is based on "Generic 8x MA Plotter" indicator, by @LazyBear.
It will plot three Moving Averages based on current time interval and seven based on chosen periods by hour, day, week and month. You will be able to see where is, for example, a 50 days SMA when using a 5 minutes time interval chart. I find it very useful to analyze, in a snap, possible price ranges and enter/exit points. All reference values are from setups known and used by traders.
Cons: Use it wisely, because if you choose to plot all the 10 Moving Averages, he will consume a lot of the computer resources.
Enjoy!!
Edit: I forgot to mention that you can choose between EMA or SMA for each time interval, that are distributed in:
2x MA Hour;
2x MA Day;
2x MA Week;
1x MA Month.
I've tried to keep the code as simple as possible, so you can increase that number or modify the Moving Average that each time interval will use.
Peace!

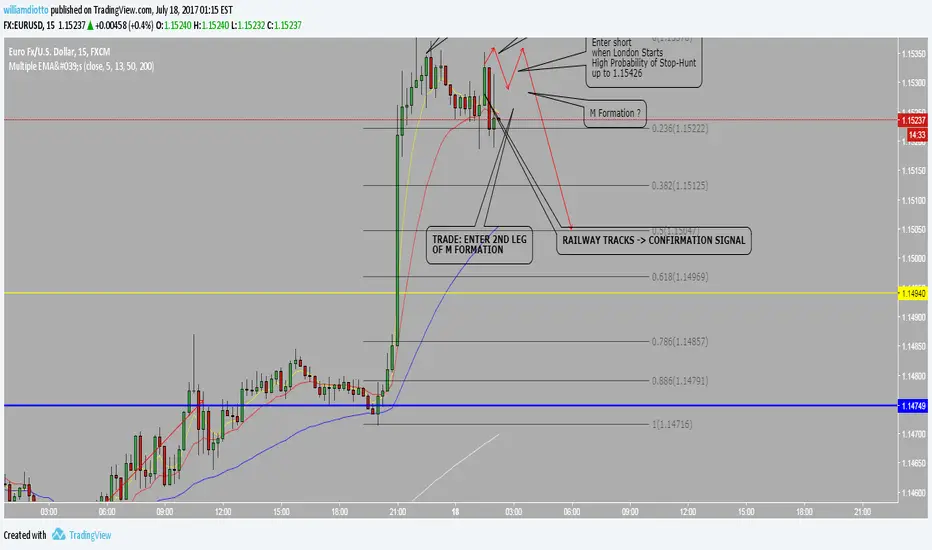
Multiple EMA'sGives you the opportunity to use 4 EMA's in one script.
*THIS IS A SCRIPT, NOT A TRADE*
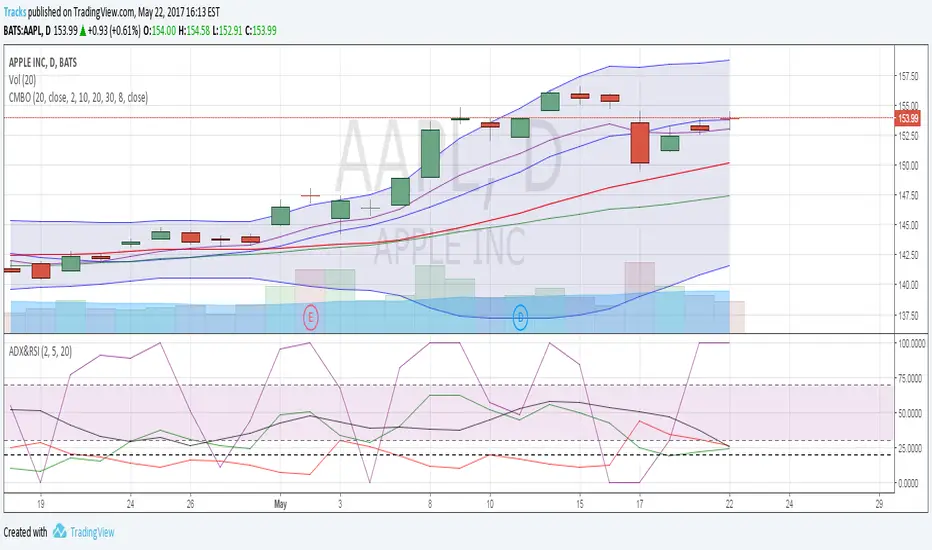
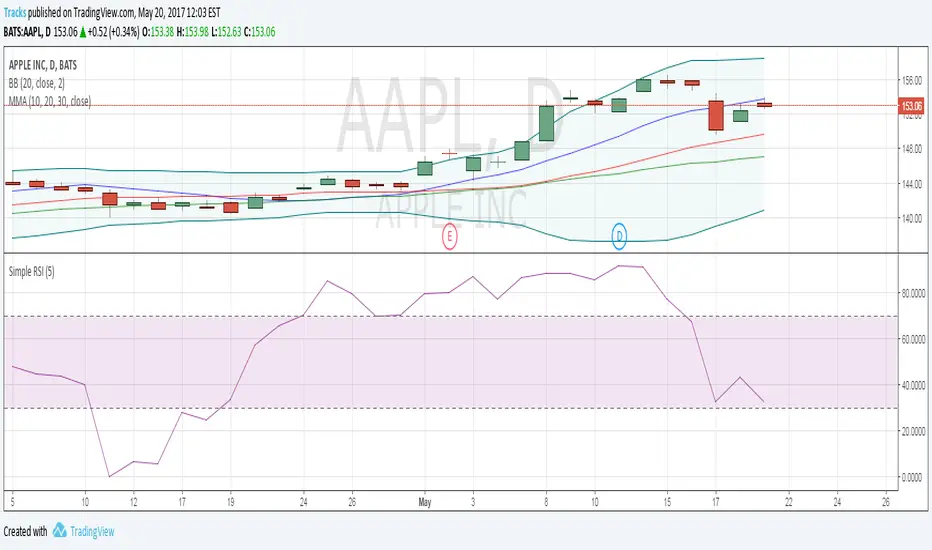
Combo IndicatorFor easier setup, this script combines 5 indicators. 3 simple moving averages, 1 EMA and Bollinger Bands. These are common indicators that are that often used and discussed on OptionsPlayers.com
Multiple Moving AverageCombines 3 moving average plot lines into one indicator for easy configuration
Burak Birers MA DiffI use it to see the difference of average price which should be the same on theory. Put it on 5 mins chart to see the crossings.

Super Guppy MMA [MFWIC]I compiled the new and improved Guppy Multiple Moving Averages. Hope it has some value. Plan your trade and trade your plan!

Easy Multiple Moving AveragesFor easy one on/off clicking. Don't waste your time clicking multiple times.

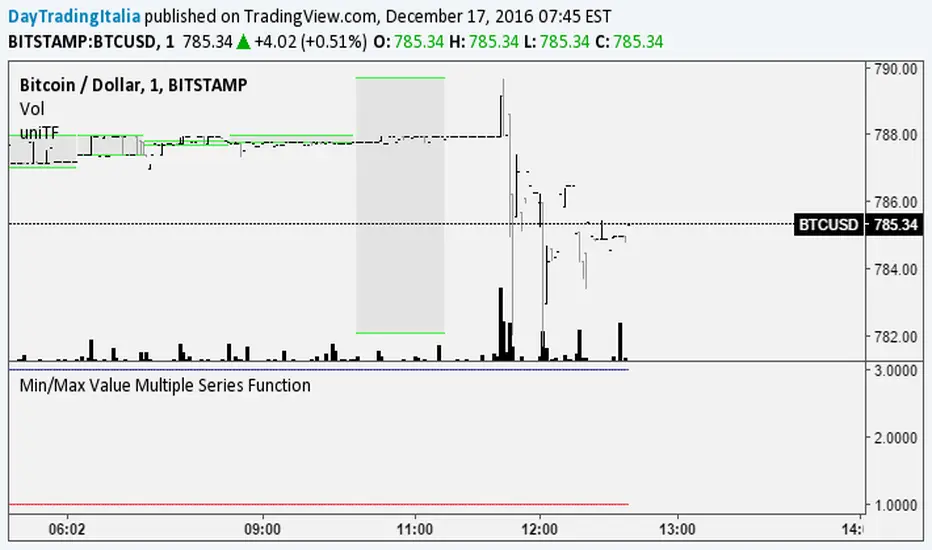
Min/Max Value Multiple Series FunctionTrying different solutions to find the minimum/maximum value in a set of predefined series
Inside Bars Multiple Time Frames ColorHello, this is just a script that helps to identify "inside bars" on the current time frame or a higher one, by coloring them with the selected color.

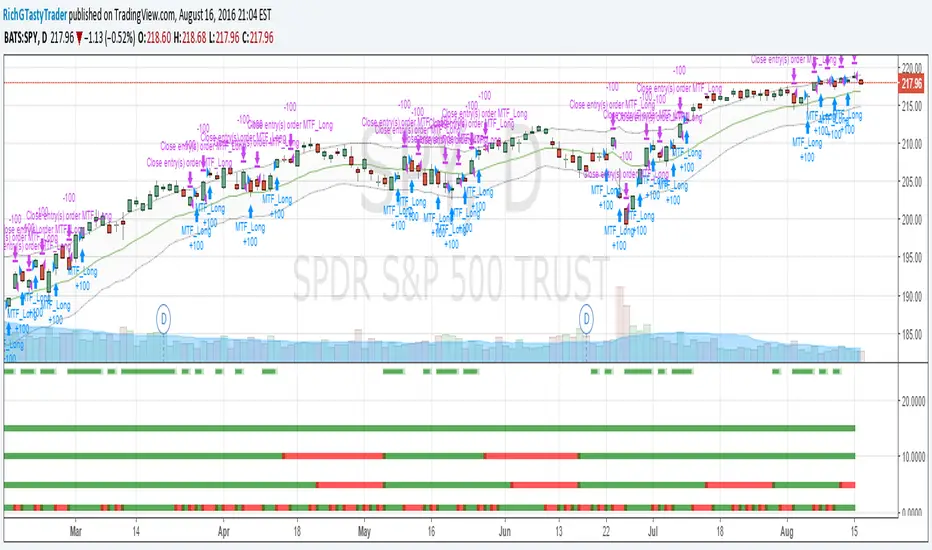
[RichG] Easy MTF Strategy v1.1This is a second attempt at an easy to understand multiple time frame strategy. This one uses ATR for exits. If the position is long, and the price closes below the ATR multiplier, it triggers a close. If the position is short, and the price closes above the ATR/multiplier, it triggers a close. This generates a lot of little trades but is useful because it uses multiple time frames along with cutting losses when the ATR disagrees.
Pairs Volume FXCM mini accountScript shows the volume of the currency pairs in the FXCM mini account. I set it daily or weekly to see which pair is picking up in activity. My style of currency trading is short holds on the highest volatility. This helps me determine which pairs have the highest volume (or tick activity since there is no true exchange for currency). I use this in conjunction with the other script I wrote, "Pairs Range" which shows which pairs have the highest daily range. This script has a built in 5-sma on each pair. High daily range and high volume is volatility and liquidity. **** This does not include currencies in CHF ****

Triple Guppy CrossGUPPY MULTIPLE ESTIMATED MOVING AVERAGE (EMA) is for Trend Trading. This script uses three sets of crosses to give us an indicator of possible trend reversal. Red cross is the first alert, followed by blue and black. Black cross being the strongest, red cross weakest.
More information about Guppy Trading can be found in the link below

Multi BB Heat Vis - SMA/EMA/Breakout - r2I don't expect to iterate any further on this script, unless any weird issue crops up.
Description and usage detailed in the comments at the top of the script. Cheers!
To repaint or not to repaint, all the relevant sources are exposed as inputs for customisation - so the choice is yours.
Cheers!
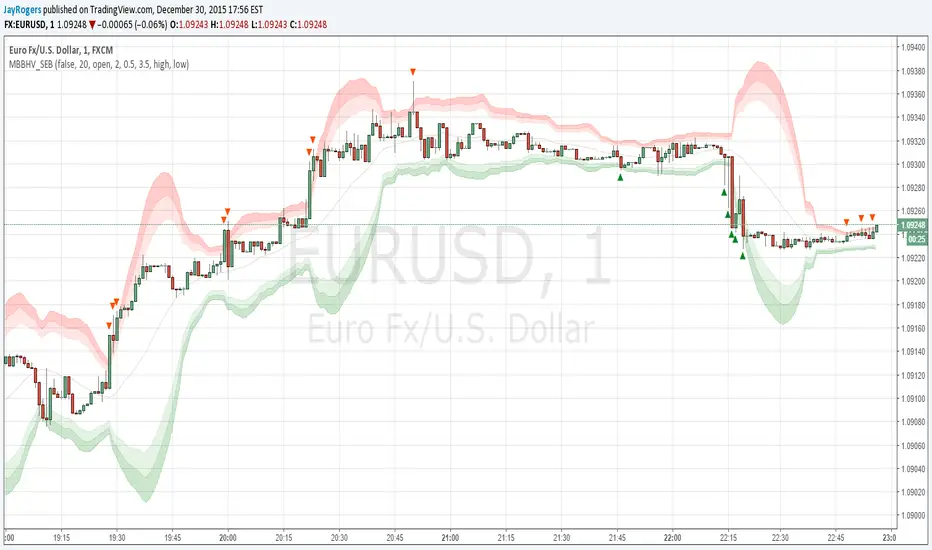
[JR] Multi Bollinger Heat BandsBollinger Bands, with incremented additional outer bands.
Set as you would normally, but with the addition of an incremental value for the added outer bands.
Defaults with Length 20, base multiplier of 2.0, and an Increment value of 0.5 for additional outer bands at 2.5 and 3.0. Adjust values to suite your needs.
All lines and zones have colour and formatting options available - because why not eh?
