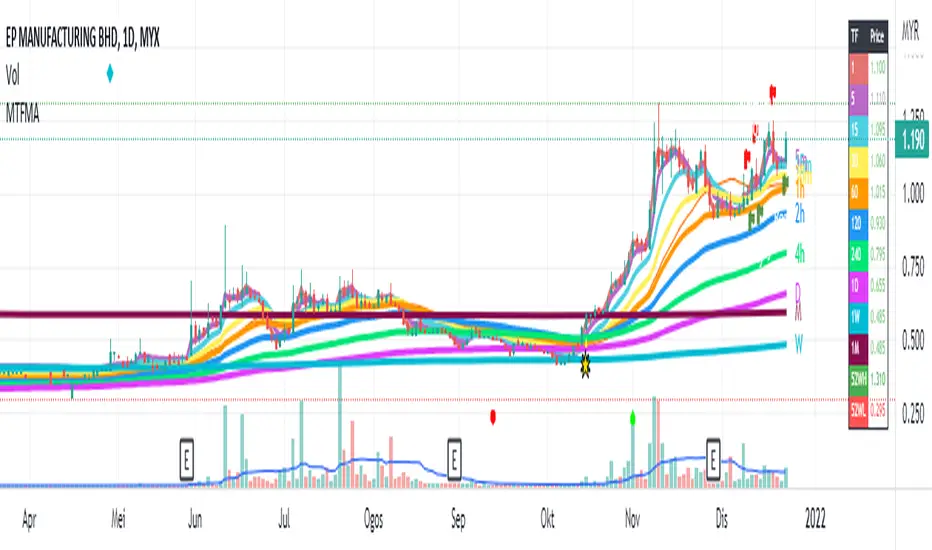
Multiple Timeframe (Moving Average) With InfoThis indicator combine 4 indicator in one pine script : Main indicator is Moving Average in multiple timeframes, Bollinger Band, Crossover Signal, Info Panel, 52Weeks High & 52 Weeks Low.
1)
For multiple moving average, it has 9 difference timeframes.
- Default timeframes is (1minute, 5minutes, 15minutes, 30minutes, 1hour, 4hours, 1Day, 1Week & 1Month). User also have choices to change the option.
- For Moving Average, there also available multiple choice of Moving Average : SMA , EMA , DEMA , VWMA , RMA, WMA . Default Moving Average is EMA (200)
- There also include info panel / table that show TF (Timeframes) for every MAs, & their price. Colors change according to current price. Bullish = Green, Neutral = Neutral, Bearish = Red
There are also function for user to turn on/off :
- (MA) Type & Lenght.
- Multiple MAs.
- Info / Table
User can use multiple line in daily chart to find support & resistance .
Example : For uptrend stock, candle close on top of EMA200 line for 1 hour timeframe. So it's can becomes immediate support, while the other EMAs on below is their next support.
Example :
For downtrend stock, candle close on top of EMA200 line for 5minutes timeframe. So it's become support, while the other EMAs on top is their resistance.
Example :
This Multiple MAs Inspired by xdecow :
www.tradingview.com
Checkout his Multi Timeframe Moving Average here :
2)
This indicator also have Bollingger Band. User have option to turn it on / off. User can use it as a target price if all the EMAs below the candle.
Example :
3)
This indicator also shown 52 Weeks High & 52 Weeks Low. User have option to turn it on / off. Their price also shown at the info panel.
Example :
4)
Crossover Signal. This crossover is default, it happen when candle close on top / near timeframe 5Minutes is (Ready). While candle close below timeframe 5Minutes is (Caution). User can choice other shape if they don't want the text label. To change the crossover for other setup, user can change it under = #2. The crossover only shown in past 10 candle.
Example :
Feel free to use it & comment. Thanks.
Multiple
ArrayMultipleDimensionPrototypeLibrary "ArrayMultipleDimensionPrototype"
A prototype library for Multiple Dimensional array methods
index_md_to_1d()
new_float(dimensions, initial_size) Creates a variable size multiple dimension array.
Parameters:
dimensions : int array, dimensions of array.
initial_size : float, default=na, initial value of the array.
Returns: float array
dimensions(id, value) set value of a element in a multiple dimensions array.
Parameters:
id : float array, multiple dimensions array.
value : float, new value.
Returns: float.
get(id) get value of a multiple dimensions array.
Parameters:
id : float array, multiple dimensions array.
Returns: float.
set(id) set value of a element in a multiple dimensions array.
Parameters:
id : float array, multiple dimensions array.
Returns: float.

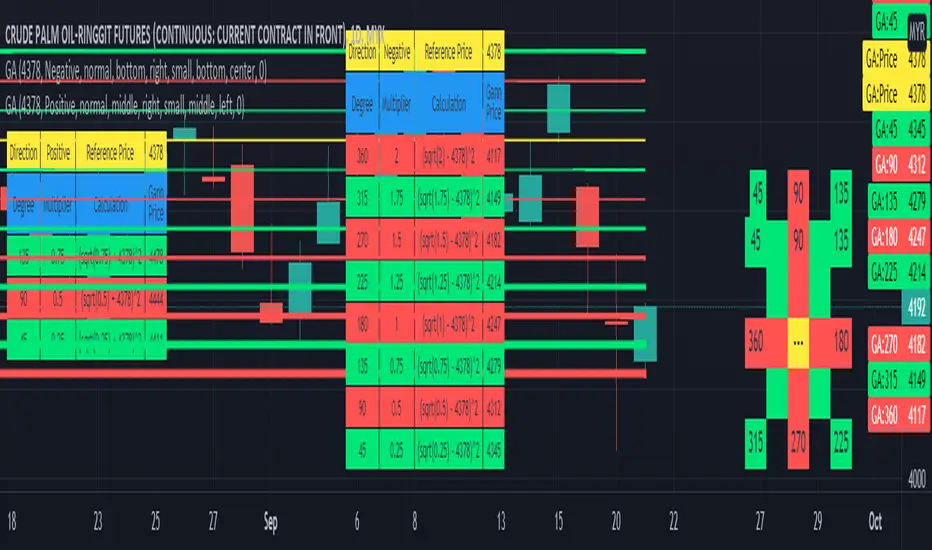
Gann Angle Table Calculator PlotterThis indicator was build upon based on Gann Angle and Gann Multiplier as refered of The Tunnel Thru The Air Or Looking Back From 1940, written by WD Gann .
Credits to FaizHebat for calculation.
Indicator features :
1. Font size from tiny to huge.
2. Table position.
3. Color for cell table and plot can be input or reversed.
4. Plot can be show or hide and also price can be track.
5. Able show currency and decimal price.
6. Gann table and Calculation table can show or hide.
7. Each Gann point can be hide including plot and calculation.
8. For desktop display only, not for mobile.
Pros :
1. Can be used as single or more indicator. (Chart show 2 same indicator with different setup)
Cons :
1. Price must be input before selecting any Gann Point.
FAQ
1. Credits
WD Gann , The Tunnel Thru The Air Or Looking Back From 1940
FaizHebat
2. Code Usage
Free to use for personal usage.
Positive direction with Currency and Decimal
Positive direction with Currency and Decimal
HPH's FractalTradesThis indicator is based on some dark fractal magic.
Not really, it's inspired by Vladimir Poltoratskiy and basically just waits for the price to go higher or lower than a previous fractal. If that's the case and all the additional settings allow the trade to take place, it is entered with the stop loss at the last opposite fractal of were it was entered (so if we enter a trade because the price went higher than the last up fractal, the sl is at the last down fractal).
The trades are visualised with a stop loss and 3 take profits levels (at a 1:1, 2,1:1 and 4:1 risk/reward ratio). The stop loss will trail once a certain take profit level is reached. Enjoy!
The settings:
LiveVersion : If ticked it will use close for stop losses and take profits. If unticked high and low will be used. Neither is accurate when backtesting as there is no intrabar data...
CancelEarly : Swings trade in the opposite direction when an opposite signal is received. If unticked the trade will continue until a tp or sl is hit.
ShowStats : Show a table in the top right displaying how many times the stop losses or take profits got hit.
FractalPeriods : Number of bars that are required for a fractal. E.g. if it's 2, 2 bars need to be lower on the left and right of a candle for it to print an up fractal.
MinFractalDiv : If this is bigger than 0, it will not allow new fractals to print unless they are at least a percentage based amount bigger than the last one. So this can be used to filter out fractals that are in the same range. Bigger value = more aggressive filtering!
TicksOnFractal : Tick based offset to add onto the fractals to enter trades. E.g. if it's 5 and the price goes above an up fractal, it needs to go up 5 more ticks to enter a trade.
UseFilter, FilterMultMin and FilterMultMax : If ticked, trades are limited to the once in the specified range (distance of the stop loss). E.g. if FilterMultMax is 0.05, the stop loss can not be bigger than 5% of the assets price for the trade to take place.

TIL Multi RSITrading Indicator Lab’s Multi RSI for TradingView is a powerful indicator that extends your capability to monitor RSI signals up to 20 different symbols all at the same time in just a single chart.
Eagle Eyes
The Multi RSI indicator can calculate the RSI of close prices of multiple symbols at any timeframe. This allows you to scan for RSI signals that may escape your search for potential good trading opportunities. It lets you choose the symbols you want to monitor for up to 20 slots and it INSTANTLY tells you which ones are overbought, oversold and even those that are at the verge of the buying or selling extremes in real-time so you can always be there when that big trend reversal happens.
Auto Sort
The symbols you add to the Multi RSI indicator are automatically sorted by their RSI readings from the most oversold down to the most overbought, each with a color assigned to them. Symbols that have an RSI reading of 50 and above are displayed in red while those below 50 are displayed in green. Those that breach the oversold and overbought signals are displayed in a brighter shade of color of red and green respectively. These colors are fully customizable in the indicator’s inputs.
Adjustable Oversold and Overbought Levels
The Multi RSI indicator uses the default 70/30 oversold-overbought levels but this can be easily adjusted in the Inputs section to match your preferences. The indicator’s color and alert system adjusts automatically to these changes.
Arrows
Beside each RSI reading is an arrow which gives you information about its trajectory, whether it is going up, down, or sideways. This is based on the last bar’s RSI value.
Alerts
The indicator lets you know when one or more symbols in the table crosses the oversold or overbought levels. These are predefined alert conditions that can be chosen in TradingView’s alert creation tool.
Available Alert Conditions
- Oversold – triggers when one or more symbols in the table are oversold
- Overbought – triggers when one of more symbols in the table are overbought
Inputs
- Length – sets the period of the RSI function to be applied to all symbols
- Oversold – sets the reference level for oversold signals (default level at 70)
- Overbought – sets the reference level for overbought signals (default level at 30)
- Symbol 1 – Symbol 20 – slots for TradingView symbols (charts) that you want to monitor
- Top Half Color 1 – the color of rows that are in the oversold level
- Top Half Color 2 – the color of rows that are 50 or above but not beyond the oversold level
- Bottom Half Color 1 – the color of rows that are in the overbought level
- Bottom Half Color 2 – the color of rows that are below 50 but not beyond the overbought level
- Position – sets where the indicator is displayed in the chart
- Font Size – sets the text size of the indicator
- Height – sets the size of each cell in the table. Size 0 means the height automatically adjusts to the chart’s size.

Ultimate RSIsThis RSI script includes everything you could want on an RSI. There are multiple timeframes which will give context to market movement, as well as a highlight feature to make it easier to visualize overbought and oversold stocks.
Tip: Uncheck the 4 plots with no color in them to remove the extra headers on the indicator.

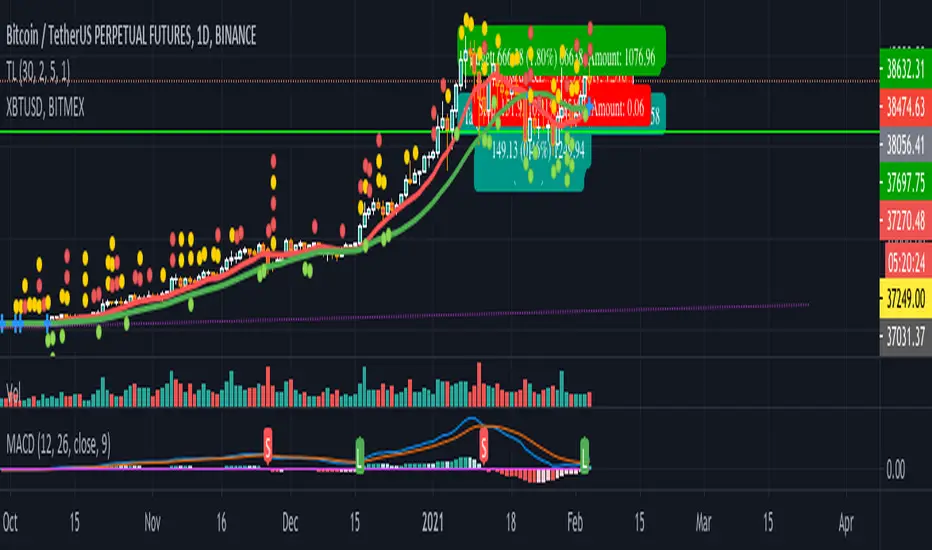
Multiple Timeframe RSI with 2 MA by GodtrixHi guys, how ya doing!
I know sometimes you'll need multiple timeframe RSI to study your chart, so do I, therefore I'll share my multi RSI tool for you.
There are total 3 RSI for you to use, you can turn each ON or OFF
I've added more colored value lines for your better view
Also provided a choice for smooth line or step line where there's no gap for higher timeframe RSI on a smaller timeframe chart
MA (SMA) is provided for smoother, less noise lines
Indicator Tips:
Bullish - When it is above 50, this is where you might want to decide whether to close your short order or new short order at top
Bearish - When it is below 50, this is where you might want to decide whether to close your long order or new long order at low

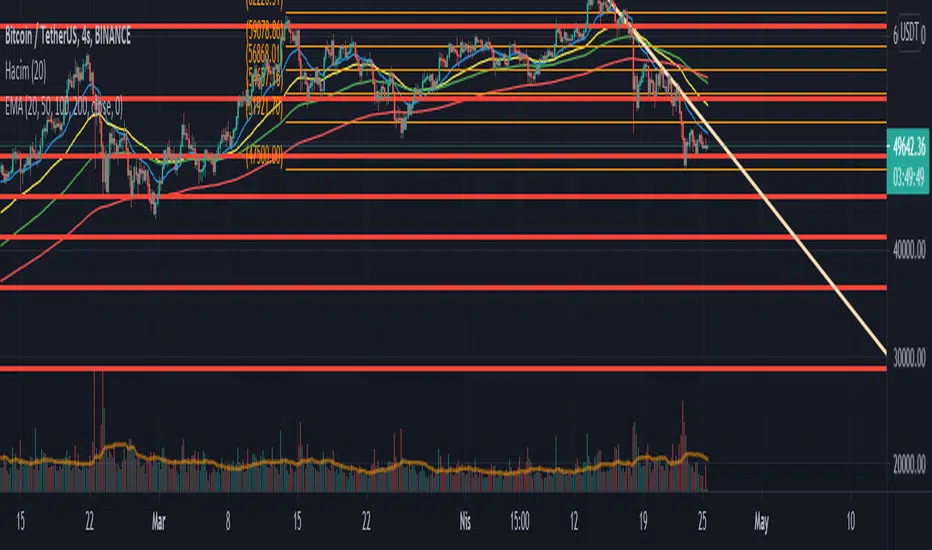
RSI & MACDThis indicator presents standart RSI and MACD indicators in a single indicator. The appearances of these indicators have been modified a little bit and squeezed into one window. To overcome the scale problem the MACD values has expanded with 1000 and divided by the current price to use both indicators in the same scale. Original values could be determined from there. Original Tradingview codes have been used to get full control of graphs.
Bu indikatör RSI ve MACD gösterfgelerini tek bir indikatörde sunuyor. İndikatörlerin görünüşleri bir miktar modifiye edilip iki indikatörğn tek bir pencereden takip edilmesine olanak sağlanmıştır. İki indikatördeki farklı ölçek kullanımından ortaya çıkan ölçek sorunu MACD değerlerinin 1000 ile genişletilip, ürünün güncel fiyatına bölünmesiyle giderilmiştir. Her iki indikatiör için de orjinal Tradingview kodları kullanılmıştır.

Moving Average ExponentialThis indicator is based on the embedded Tradingview EMA script. The difference is having the capability of showing four different EMA in one single indicator. Due to being baseed on the oroiginal EMA script, user can modify the source and length of each EMA as s/he wish.
Bu indikatör gömülü Tradingview EMA scripti üzerinden oluşturulmuştur. Diğer indikatörlerden farklı olarak dört EMA değerini tek bir indikatörde gösterir ve kullanıcının her bir EMA değeri için uzunluk ve zaman değerlerini modifiye etmesi mümkündür.
Chonky ATR Bars - Colored1. Compares visible bars to specified ATR inputs.
2. Colors bars if the bar is less than or greater than the specified ATR multiples.
Ex: if the bar has a range of 1/2 half the Daily ATR or less, color blue. if the bar has a range of triple the 4h ATR or greater, color orange.
_______________________________________________
DM me interesting ideas, filters, knowledge, etc. to gain access.
Teach me something idgaf.

MACD signal with alert (long/short/close) for TV free accountSend MACD alert through email (available for free/pro user):
// 3 - buy
// -2 - short
// 0 - close position
// 1 - ignore
Example buy signal
Alert: STRAT3. BINANCE:BTCUSDTPERP, price = 31080
Example sell signal
Alert: STRAT-2. BINANCE:BTCUSDTPERP, price = 31080
Example close signal
Alert: STRAT0. BINANCE:BTCUSDTPERP, price = 31080
Example ignore signal
Alert: STRAT1. BINANCE:BTCUSDTPERP, price = 31080
Free Multiple Timeframe Chart Candle Resolution by Emiliano MesaFree Multiple Timeframe Chart Resolution by Emiliano Mesa
This indicator allows free users to have a multiple timeframe candlestick graph without the need of upgrading to PRO, PRO+, or Premium accounts. Furthermore you can even apply indicators to the chart, and has a much more historic data than similar indicators with the same purpose I have previously seen in the platform, which is a huge plus.
How to use?
1) Install the indicator
2) The background color, must be the same color as your actual TradingView chart background. For example, as mine is the white theme, then ill choose the white background.
3) Set a small timeframe for your real TradingView chart, this must always be less than the timeframe set in the indicator
4) Set a bigger timeframe in the indicator, this is done in the "Timeframe Wanted"
5) Expand the indicator window as much as you want
For the best results, try to make the wanted resolution 3 times bigger than the real chart resolution. For instance if using 3 minute real resolution I suggest a 9 minute multiple time frame wanted resolution for the indicator. If you are using 5 minutes, ill suggest a 15 minute, and so on
Add an indicator over the indicator?
1) When clicking in the indicator name, you will see 3 dots. Click them
2) Select "Add indicator on indicator/Strategy"
3) Select the indicator you whish to add
4) Select if the indicator will work with close,open,high, or low. More options will come in future updates.
Enjoy!
Indicator by Emiliano Mesa

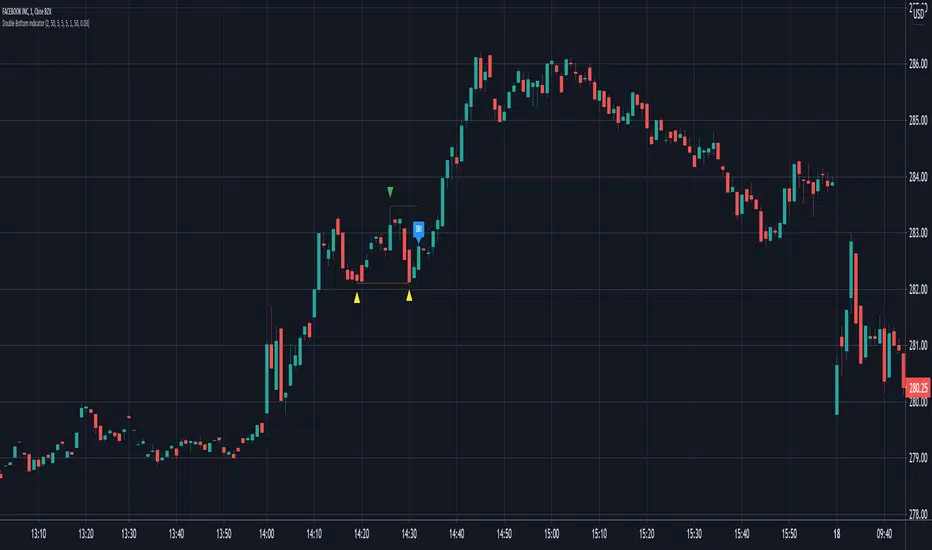
Fluffykats's Double Bottom indicator with alert v1This is a double bottom indicator with an alert that has many settings to customize your double bottom .
From Wikipedia "A double bottom is the end formation in a declining market. The pattern is formed by two price minima separated by local peak defining the neck line. The formation is completed and confirmed when the price rises above the neck line, indicating that further price rise is imminent or highly likely."
The following can be customized:
The left and right bar strengths for both the Right Top ( RT ) and Left Top ( LT ). For an explanation on RT / LT bar strength see (pivothigh) tradingview pine script API notes.
The price variance in % between RT / LT
The minimum and maximum allowable separation between RT / LT
Ability to toggle visibility of prices
PM us to obtain access
Best regards.
Moving Average DoublesThis script plots multiple moving averages each source based on its previous MA, all having the same length.
Input options:
Simple Moving Average ( SMA ) or Exponential Moving Average ( EMA )
One adjustable look back period
Choose how many MA's to display, max. 50
One adjustable line width
It probably works best for long term views to find trends or zones of confluence, and it looks awesome :)
Don't be afraid to share your thoughts or settings in the comments. Enjoy!

Moving Average ChannelThis indicator will use a moving average to create the channel around the price. It has some settings
Display Settings
Here it's possible to select what the indicator will display, from the middle line to the 3rd band level.
Reversion points will appear when the price cross out the selected band
Swing back option, when active, will make the indicator display the points when the price cross in the selected band
Moving Averages Settings
Here it's possible to select the moving averages settings that will be the basis for the channel calculation.
There are ten moving averages types t be selected, each one will give different entry points
Level Settings
Each level will apply the value on the moving average to get the level bands. All default numbers are from the Fibonacci sequence
When the extra filter is market, the indicator will display the crosses from the price and the selected band and also check if the candle closes in or out the bands.
That filter will check for a possible rejection of the price, providing more accurate movement indications, but fewer signals
Risk Management
In this part, it's possible to display stop loss and target profit levels based on the ATR indicator.
It's possible to select the multiplicator of the ATR to be applied on those levels


ALLinBull&Bear v9.0 STRATEGYEach of my Allin Custom Indicators combined, ads to your understanding where the Market could go next. Each of them have their own purpose and set of rules.
You will weight gathered information to get a better understanding of when to ENTER or EXIT a position (SHORT or LONG).
First you need to find the right Indicator Settings and the best preforming TimeFrame for chosen crypto or fiat pair. You will do that with a "STRATEGY" Indicator. I chose either 3min TF for highly liquid assets or 15min TF for assets of low liquidity but you can choose whatever you want to up to 30min TF.
Do not stop until you find 80% or more Precent Profitable result (test different setting on different TF for best results) in Strategy Tester. You can backtest your Strategy with different settings and in different TimeFames to find the very best results for that pair.
BACKTESTING past results does not guarantee your future results. BACKTESTING is used to fine-tune your indicator.
Example: with a guitar tuner (Strategy Tester in our case) you fine-tune your guitar (our Indicators in our case) so you know what tone the guitar will produce when you hit a certain note ("in-tuned" visual interpretation of the Market in our case). It is normal to get a 100% Precent Profitable result from backtesting with very little Drawdown. More than 80% and low drawdown usually means Indicators is "in-tune".
CUSTOM INDICATOR TYPE: STRATEGY
SETUP
There are five different settings. To use them efficiently you need to understand what is their purpose and meaning.
"2nd", "3rd" and "4th" FIELD
All of my custom indicators use data from 4 different TimeFrames. First TimeFrame is the one you picked in TradingView. Now you need to set up the other three TimeFrames. To do that you need to click on the "Settings" icon on this indicator and change the "2nd", "3rd" and "4th" field. The preferred setting I use to start searching for the best performing set of Settings is 2-8-32 OR 3-9-27 OR 4-16-64 OR 5-20-80. Those numbers are multiplication of chosen TimeFrame.
Example: setting 2-8-32 on a 5-minute TimeFrame means it will gather data from 5min TF, 10min TF (5minX2), 40min TF (5minX8) and 160min TF (5minX32).
Smoother FIELD
This Field is used to average down all that data indicator it is gathering from the price chart. I use integers like for example 9, 18, 27, and any number in between. It is connected to volatility. High Volatility needs Low Number and vice versa.
Threshold FIELD
This Field is used to cancel down all the mini signal confirmations that are false due to an insignificant influence on future price movements. This number is usually best at 21. When you set all other Fields and get satisfying results you can still try and fine-tune it even more and get even better results.
HOW TO USE IT
First, you have to choose your TimeFrame. I choose either 3min TF for highly liquid assets and 15min TF for assets of low liquidity but you can choose whatever you want to up to 30min TF. Example: if you chose 30min TimeFrame and you fill the "4th" Field with the number "80", one of observed TF by the indicator will be "30minX80" or "2400min" or "40h" TimeFrame, so it is HUGE.
It always depends based on the nature of the actual pair you are looking at. If it is very volatile with a lot of volume, the market beat for this pair settings is very different from another pair with for example very little volume and low volatility. So you need to find the right Indicator Settings at the right TimeFrame for each pair you are following. You are basically tuning your Indicator like you would tune your guitar so you know what to expect before hitting those "strings" of yours.
Find the best performing setting and TimeFrame with help from a TradingView feature called "Strategy Tester". Get familiar with this feature. But rule of thumb is: everything more than 80% Precent Profitable result with Max Drawdown (negative yield from the worst closed position) lower or similar to AvgTrade is considered good enough tuning of my Indicators.
You need to reevaluate your best setting whenever your last trade gets a negative result or something big (whale manipulation) happens on the market. You need to re-tune your Indicator so it will be in tune with the Market again. Check and try to find better performing (better Precent Profitable result, lower Drawdown) settings periodically every few days to find your best yielding results.
CUSTOM INDICATOR: BULL&BEAR
HOW TO READ IT
WHITE WAVY LINE AND TWO HORIZONTAL WHITE LINES
With this one just follow the existing rules when exiting an oversold or overbought area as in RSI,CCI or SRSI indicator. When combining with the signal colored lines in the background it then makes better sense if it is a false signal and it will turn back or it is the right signal and it will exit the oversold or overbought area and advance in that direction.
IN THE BACKGROUND: NINE COLORED LINES
Rule of thumb here is the more GREEN LINES you see the more LONG/BUY the Signal is and vice versa. It helps to look at those lines a few hours back to get the "feel" where the market is pushing the price. First (1), second (2) and seventh (7) line are the most important lines and they have to be aligned and prevailed in the same color to get a viable signal but it still needs to be confirmed with other Signals.
Before making any decisions based on visualisation you should refresh the page. Indicator is very data sensitive and needs that very last data for the most accurate visual representation of the Market.

ALLinOscillator v3.0 STRATEGYEach of my Allin Custom Indicators combined, ads to your understanding where the Market could go next. Each of them have their own purpose and set of rules.
You will weight gathered information to get a better understanding of when to ENTER or EXIT a position (SHORT or LONG).
First you need to find the right Indicator Settings and the best preforming TimeFrame for chosen crypto or fiat pair. You will do that with a "STRATEGY" Indicator. I chose either 3min TF for highly liquid assets or 15min TF for assets of low liquidity but you can choose whatever you want to up to 30min TF.
Do not stop until you find 80% or more Precent Profitable result (test different setting on different TF for best results) in Strategy Tester. You can backtest your Strategy with different settings and in different TimeFames to find the very best results for that pair.
BACKTESTING past results does not guarantee your future results. BACKTESTING is used to fine-tune your indicator.
Example: with a guitar tuner (Strategy Tester in our case) you fine-tune your guitar (our Indicators in our case) so you know what tone the guitar will produce when you hit a certain note ("in-tuned" visual interpretation of the Market in our case). It is normal to get a 100% Precent Profitable result from backtesting with very little Drawdown. More than 80% and low drawdown usually means Indicators is "in-tune".
CUSTOM INDICATOR TYPE: STRATEGY
SETUP
There are five different settings. To use them efficiently you need to understand what is their purpose and meaning.
"2nd", "3rd" and "4th" FIELD
All of my custom indicators use data from 4 different TimeFrames. First TimeFrame is the one you picked in TradingView. Now you need to set up the other three TimeFrames. To do that you need to click on the "Settings" icon on this indicator and change the "2nd", "3rd" and "4th" field. The preferred setting I use to start searching for the best performing set of Settings is 2-8-32 OR 3-9-27 OR 4-16-64 OR 5-20-80. Those numbers are multiplication of chosen TimeFrame.
Example: setting 2-8-32 on a 5-minute TimeFrame means it will gather data from 5min TF, 10min TF (5minX2), 40min TF (5minX8) and 160min TF (5minX32).
Smoother FIELD
This Field is used to average down all that data indicator it is gathering from the price chart. I use integers like for example 9, 18, 27, and any number in between. It is connected to volatility. High Volatility needs Low Number and vice versa.
Threshold FIELD
This Field is used to cancel down all the mini signal confirmations that are false due to an insignificant influence on future price movements. This number is usually best at 21. When you set all other Fields and get satisfying results you can still try and fine-tune it even more and get even better results.
HOW TO USE IT
First, you have to choose your TimeFrame. I choose either 3min TF for highly liquid assets and 15min TF for assets of low liquidity but you can choose whatever you want to up to 30min TF. Example: if you chose 30min TimeFrame and you fill the "4th" Field with the number "80", one of observed TF by the indicator will be "30minX80" or "2400min" or "40h" TimeFrame, so it is HUGE.
It always depends based on the nature of the actual pair you are looking at. If it is very volatile with a lot of volume, the market beat for this pair settings is very different from another pair with for example very little volume and low volatility. So you need to find the right Indicator Settings at the right TimeFrame for each pair you are following. You are basically tuning your Indicator like you would tune your guitar so you know what to expect before hitting those "strings" of yours.
Find the best performing setting and TimeFrame with help from a TradingView feature called "Strategy Tester". Get familiar with this feature. But rule of thumb is: everything more than 80% Precent Profitable result with Max Drawdown (negative yield from the worst closed position) lower or similar to AvgTrade is considered good enough tuning of my Indicators.
You need to reevaluate your best setting whenever your last trade gets a negative result or something big (whale manipulation) happens on the market. You need to re-tune your Indicator so it will be in tune with the Market again. Check and try to find better performing (better Precent Profitable result, lower Drawdown) settings periodically every few days to find your best yielding results.
CUSTOM INDICATOR: OSCILLATOR
HOW TO READ IT
GREEN AREA on the bottom and RED AREA on top are just like the oversold or overbought areas in RSI, CCI or SRSI and uses the same principle.
Example: when a WHITE wave line crosses-UP WHITE horizontal line in GREEN area it means that it is a LONG/BUY signal/confirmation. It needs to be confirmed with other confirmation signals in that same Indicator on in a "BULL&BEAR" Indicator to get better understanding that the price would not turn back down due to a false price move in UPWARDS direction.
GREEN or RED OSCILLATOR WAVE AREAS indicates the direction price is going and how strong the "force" behind the price move is.
Example: if WHITE LINE is over the RED/GREEN LINE the area turns GREEN and it is a LONG/BUY signal. When a shadow color is on the OTHER SIDE that means it is an added confirmation for a LONG/BUY position. When a SHADOW AREA is over the GREEN AREA and turns RED it usually means there are still forces pulling the price down.
Before making any decisions based on visualisation you should refresh the page. Indicator is very data sensitive and needs that very last data for the most accurate visual representation of the Market.

Multiple Timeframe Five Moving AveragesThis allows you to plot up to 5 moving averages on your chart at once. You can either use the chart's current timeframe or select a custom timeframe for your 5 moving averages (for example, you can see the 200DMA on your 4h chart without having to adjust the moving average length). You can also choose amongst SMA , EMA , and HULLMA for each MA.

Multi Timeframe EMA Golden Ropes [SOMMI 1.0 EDIT]Come and try out my famous Golden Ropes 💛💛💛💛
When a boxer is in the ring, they lean on the ropes for safety. And I provide this technique here, to you for free! 🥊 🏆
...
How SOMMI uses his Golden Ropes...
It is simple 200 period EMA.
Be bullish when price is above it, and be bearish when price is below it.
This is meant to establish a bias, and not a strategy by itself.
Execution
- You can use this with a strategy such as Stochastics, RSI or MACD. 💚
- For example, when we're above the Golden Ropes, look for "dips" to buy, using your indicator 🧡
- And when we are below the Golden Ropes, look for "peaks" to sell. 💙
- Make sure you use a stop which is just beyond the Golden Ropes, if you are close to it.
...
Two of my favorite scalping strategies...
STRATEGY #1:
- The market is trending one way (example: Down) and then comes back and touches the Golden Rope and holds there .
- This is a great selling opportunity, most indicators will tell you to sell at this point. Lean on the Golden ropes!
STRATEGY #2:
- The market is slowly grinding upwards and comes back near the Golden Ropes, and holds.
- Buy the dip, and put a stop beyond the Golden Ropes. 💛
BONUS!!
STRATEGY #3:
- The market has been grinding one way for a long time, on your selected time-frame. In this example, imagine it's been going up...
- It comes back towards the Golden Ropes and CUTS right through it on the downside.
- Sell through the Golden Rope, with a stop just above it.
- You MUST have a good price on this strategy, if you are too late and miss it, avoid FOMO and wait for the next trade!
🥊

Leavitt Convolutions Multicator - Jay Leavitt, Ph.D.Hot off the press, I present this next generation "Leavitt Convolutions Multicator" employing PSv4.0, originally formulated by Jay Leavitt, Ph.D. for TASC - January 2020 Traders Tips. Basically it's an all-in-one combination of three Leavitt indicators. This triplet indicator, being less than a 60 line implementation at initial release, is a heavily modified version of the original indicator using novel techniques, surpassing Leavitt's original intended design.
Utilizing the "Power of Pine", I included the maximum amount of features I could surmise in an ultra small yet powerful package. Configurations are displayed above in multiple scenarios that should be suitable for most traders.
Features List Includes:
Dark Background - Easily disabled in indicator Settings->Style for "Light" charts or with Pine commenting
AND much, much more... You have the source!
For those of you who are new to Pine Script, this script may also help you understand advanced programming techniques in Pine and how they may be utilized in a most effective manner. Most notably, the script shows how to potentially combine three indicators in one with Pine. This is commonly what my dense intricate code looks like behind the veil, and if you are wondering why there is no notes, that's because the notation is in the variable naming.
The comments section below is solely just for commenting and other remarks, ideas, compliments, etc... regarding only this indicator, not others. When available time provides itself, I will consider your inquiries, thoughts, and concepts presented below in the comments section, should you have any questions or comments regarding this indicator. When my indicators achieve more prevalent use by TV members, I may implement more ideas when they present themselves as worthy additions. As always, "Like" it if you simply just like it with a proper thumbs up, and also return to my scripts list occasionally for additional postings. Have a profitable future everyone!

Multi Moving Averages @Hendo 4C (14 Types)A script containing 14 different types of Moving Averages, a total of 4 can be added per chart (allowing multiple Moving Averages under a smaller TradingView plan).
It also comes with: Adaptive coloring, settings for the source of calculations, customizable colors and lengths. Most importantly, as mentioned: 14 different types found below.
Simple Moving Average (SMA)
Exponential Moving Average (EMA)
Double Exponential Moving Average (DEMA)
Triple Exponential Moving Average (TEMA)
Running Moving Average (RMA)
Kaufman's Adaptive Moving Average (KAMA)
Hull's Moving Average (HMA)
Least Square Moving Average (LSMA)
Weighted Moving Average (WMA)
A. Legoux Moving Average (ALMA)
Volume Weighted Moving Average (VWMA)
Symetrically Weighted Moving Average (SWMA)
Smoothed Moving Average (SMMA)
Elastic Volume Weighted Moving Average (eVWMA)
The goal of creating this script was to allow people with a small TradingView subscription to have access to multiple Moving Averages. Of course it’s not unique in that use case, the thing that makes this script is unique is the fact that it comes with 14 different Moving Averages that can be selected independently. You want a RMA paired with 2 EMA’s and one HMA? Go ahead!
I’m open to add any requests that you guys might have. Feel free to ask so in the comments.
Check out my “Volatility Stop Loss Helper” too! And happy trading.
Last: I think it’s pretty clear to say that this was not “my idea” to build. But I found most of the similar scripts available pretty lacking in terms of settings and additions.
{{Settings overview}}
“Adaptive Colouring”: If enabled the Moving Average colours will be determined by their relation to price. If price is above the Moving Average it’s green, and red if price is below.
“Plot First MA”: Disable or enable the first moving average
“Moving Average Type 1”: The type of Moving Average that the first MA should be. 14 choices.
“Moving Average Length 1”: The length of the first Moving Average.
“Source of Calculation MA1”: The source that is used to calculate the Moving Average. Default is “Close”.
“Plot Second MA”: Enable if you want to use 2 Moving Averages
Settings are the same as described above. But then for the second MA.
“Plot Third MA”: Enable if you want to use 3 Moving Averages
Settings are the same as described above. But then for the third MA.
“Plot Fourth MA”: Enable if you want to use 4 Moving Averages
Settings are the same as described above. But then for the fourth MA.
It is recommended to click the little left arrow to hide your indicators in the top corner while using this indicator. Due to the length of the settings menu.
Settings can be added due to requests. Please check the update notes below:
