9 x TimeFrames: MACD + Histogram, Logarithmic***Up to 9 MACD's with fixed timeframes***
-Simply enter your MACD settings, and which timeframes you would like to see.
-Settings stick regardless of viewing resolution (within reason)
-Enter 0 to disable if you want less than 9 MACD's
***Logarithmic option for consistency over long timeframes***
***Layered histogram, can be disabled, adjusted vertically***
Multipletimeframe

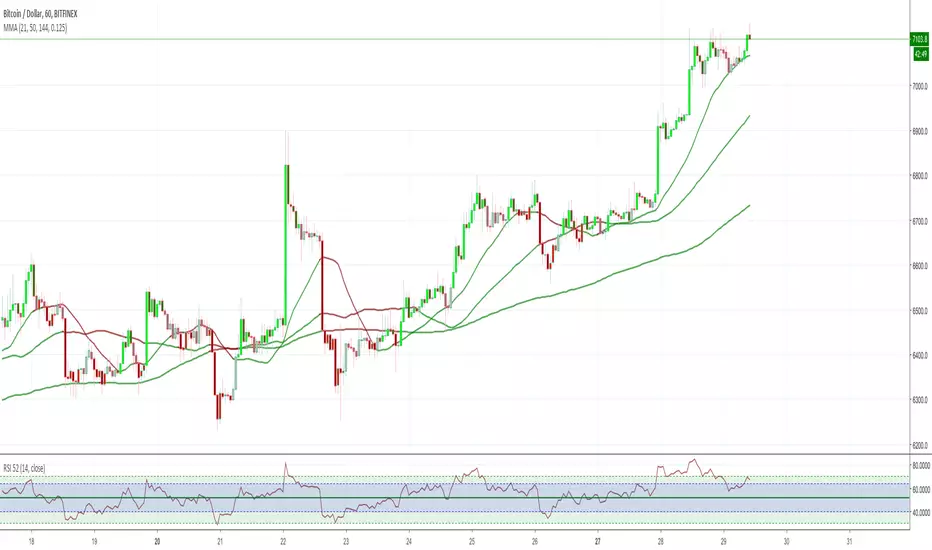
Reverse Engineered RSI - Key Levels + MTFThis indicator overlays 5 Reverse Engineered RSI (RERSI) levels on your main chart window.
The RERSI was first developed by Giorgos Siligardos in the June 2003 issue of Stocks and Commodities Magazine. HPotter provided the initial implementation - from which this script is derived - so all credit to them (see: ).
In simple terms, RERSI plots lines on the price chart that reflect levels of the RSI . E.g. if you set up a RERSI line at a level of 50, then price will touch that line when the standard RSI indicator reads 50. Hopefully that makes sense, but compare the two if it doesn't.
Why is the RERSI useful if it's just plotting RSI values? Well, it simplifies things, and enables you to get a clearer picture of trend direction, RSI support and resistance levels, RSI trading signals, and it keeps your chart window uncluttered.
I've set up 5 RERSI lines to be plotted: Overbought and Oversold Levels, a Middle Level (generally leave this at 50), and then Down/Up Trend Lines. The latter two are loosely based on the work of Constance Brown (and they in turn were influenced by Andrew Brown), who posited that RSI doesn't breach certain levels during trends (e.g. 40-50 is often a support level during an uptrend).
Play around with the levels, and the RSI Length, to see how your particular market reacts, and where key levels may lie. Remember, this isn't meant as a stand-alone system (although I think there's potential to use it as such, especially with price action trading - which I guess wouldn't make it stand-alone then!!), and works best with confirmation from other sources.
Oh, and there's MTF capability, because I think that's useful for all indicators.
Any queries, please let me know.
Cheers,
RJR

FofT - 1h, 4h, and Daily RSI in any time intervalView multiple-timeframe RSIs in a single interval. All RSI lines stay the same no matter your preference to trade in 15m, 1h, 3h…. etc.
Default RSI length is 7 (can be changed in the format settings)
All RSIs are smoothed out in default (can be changed in the format settings)
Line colors
5m RSI - white (disabled in default)
15m RSI - Lime (disabled in default)
1h RSI - Yellow
4h RSI - Red
D RSI - Blue
Overbought and Oversold threshold colors
>70 (grey) - overbought
>80 (orange) - highly overbought
>90 (pink) - extremely overbought
=50 (black dotted lines) - equilibrium
<30 (grey) - oversold
<20 (orange) - highly oversold
<10 (pink) - extremely oversold
How to add to chart
* Click on "Add to Favorite scripts" in the bottom right
* While in chart view click on "/" button on your keyboard or click on the Indicators button on the top tool bar
* Go to Favorites Tab and click on this indicator
Other interval RSIs will be added based on request. Feel free to leave any questions or requests in the comment section below.
If you find this script useful, please like and share.

FofT - 1h, 4h, and D multi-timeframe EMAs in any time intervalView multiple-timeframe EMAs in a single interval. All EMA lines stay the same no matter your preference to trade in 15m, 1h, 3h…. etc.
Default EMA length is 10 (can be changed in the format settings)
Line colors
1h EMA - Yellow
4h EMA - Red
D EMA - Blue
How to add to chart
Click on "Add to Favorite scripts" in the bottom right
While in chart view click on "/" button on your keyboard or click on the Indicators button on the top tool bar
Go to Favorites Tab and click on this indicator
Other interval EMAs will be added based on request. Feel free to leave any questions or requests in the comment section below.
If you find this script useful, please like and share.

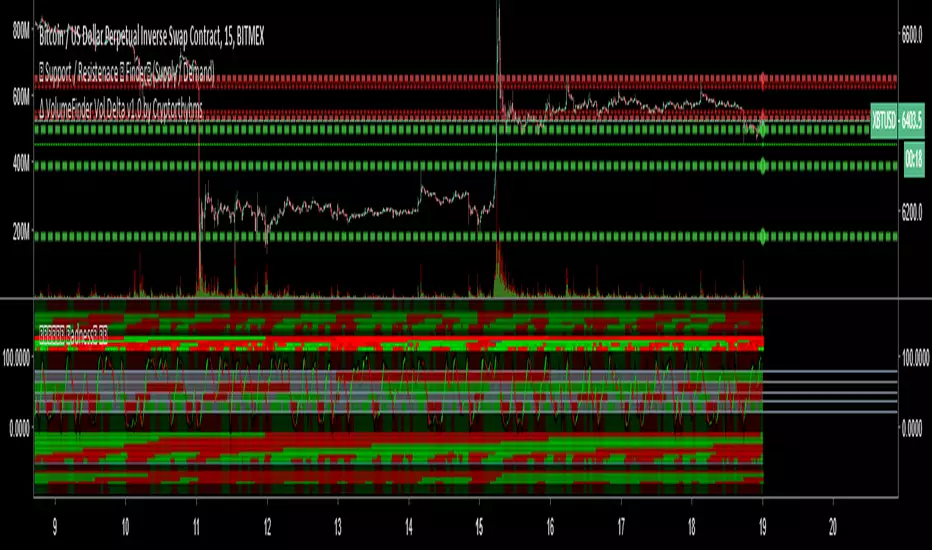
BottomFinder MTF Madness - 5x MTF Grid IndicatorsHello Again Trading View!
Bottom Finder Team here bringing another delicious indicator, this time to help spot those trends! This version is closed for Beta Testing with our subscribers only for the next few weeks. After beta improvements it will be released free to anyone who signs up as a free member on our site.
This is meant to be used on the 15m timeframe, and it looks up into higher TF's. It is meant to be maximized, so have this open in one tab and the chart on another. Dual Monitors are best. All options and Time frames are fully configurable inputs.
Indicators from top to bottom are:
1.)Polarity Filtration - 6 Timeframes
2.)Price Volume Trend - 4 Timeframes
3.)Stochastic RSI - 4 Timeframe Grid, and Current Timeframe in lines/ribbons
4.)MACD Crossovers - 8 Timeframes
5.)SuperTrend - 4 Timeframes
And last...
6.)Background Color indicator is up/down (green/red) price on 1 Hour Heiken Ashi candle chart.
No more swapping back and forth between timeframes!
For access to this and many other exclusive indicators - you can visit our telegram and ask about becoming a subscriber. All our paid indicators have a reasonable lifetime cap price. Once you reach it, indicator is yours for life - no more subscription.

TDI Complementary Overlay by YardleyRosetteMay 2018, Traders Dynamic Index Overlay Indicator ( Free Indicator )
The Full 'TDI' Complementary Overlay for all securities. FOREX, BITCOIN (CRYPTOCURRENCIES), STOCKS, etc.
This is the overlay of Traders Dynamic Index updated in my knowledge to optimal settings.
Added an "Xtreme" Phaser for noticing major moving average/trendline breakouts.
Added representation of Overbought/Sold level lines.
Moving Averages visually reordered.
Settings I found of moving averages to correlate the best with Traders Dynamic Index all in one overlay indicator.
Using KK_Traders Dynamic Index_Bar Highlighting which is the closest to Traders Dynamic Index Pro on MT4, I set the best alignment to Traders Dynamic Index with potential target price points as an overlay indicator representing Traders Dynamic Index components and a level as moving averages on price chart.
"Phaser", as in phase changing; shifting direction.
Especially for those who do not have TV PRO.
______________
El Índice Dinámico de Comerciantes encimadas a gráficas de precio.
En especial para quienes solo pueden usar 3 indicadores.
_____________

Bollinger/Donchian ChannelsProvides a blending of Bollinger Bands and Donchian Channels with shading criteria between.
