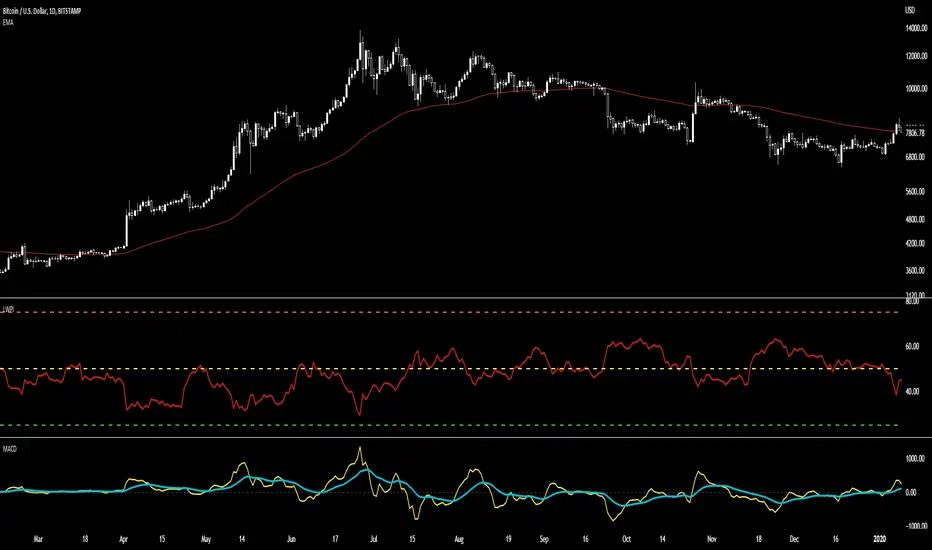
Larry Williams Proxy Index Larry Williams Proxy Index indicator( Featured in No-Nonsense Forex Episode:https://www.youtube.com/watch?v=KkynxVPNL0E&t=49s)
How to use:
Go long when the line crosses below 50
Go short when the line crosses above 50
Nnfx
ATR MultiplierOVERVIEW
The Average True Range Multiplier (ATRX) is a simple technical indicator that takes the value of the ATR indicator and multiplies it by a user-specified amount.
CONCEPTS
This indicator is primarily used to set key levels based on historical volatility. The ATR indicator alone measures the historical volatility of the selected instrument, this indicator just multiplies that value to save the hassle of doing that yourself.

Strategy Puma Trending StrategyThis script is a trading strategy, the structure originally made by the youtuber no nonsense forex.
It contains a combination of different indicators that contain different parameters an assets price and volume much reach before a trade is made.
Indicators include one for volume, volatility, baseline, zero cross indicator and a trigger indicator.

ATR with MAOVERVIEW
The Average True Range Moving Average (ATRMA) is a technical indicator that gauges the amount of volatility currently present in the market, relative to the historical average volatility that was present before. It adds a moving average to the Average True Range (ATR) indicator.
This indicator is extremely similar to the VOXI indicator, but instead of measuring volume, it measures volatility. Volume measures the amount of shares/lots/units/contracts exchanged per unit of time. Volatility, on the other hand, measures the range of price movement per unit of time.
The purpose of this indicator is to help traders filter between non-volatile periods in the market from volatile periods in the market without introducing subjectivity. It can also help long-term investors to determine market regime using volatility without introducing subjectivity.
CONCEPTS
This indicator assumes that trends are more likely to start during periods of high volatility, and consolidation is more likely to persist during periods of low volatility. The indicator also assumes that the average true range (ATR) of the last 14 candles is reflective of the current volatility in the market. ATR is the average height of all the candles, where height = |high - low|.
Suppose the ATR of the last 14 candles is greater than a moving average of the ATR(14) of the last 20 candles (this occurs whenever the indicator's filled region is colored BLUE). In that case, we can assume that the current volatility in the market is high.
Suppose the ATR of the last 14 candles is less than the moving average of the ATR(14) of the last 20 candles (this occurs whenever the indicator's filled region is colored RED). In that case, we can assume that the current volatility in the market is low.
HOW DO I READ THIS INDICATOR?
If the ATR line is above the ATR MA line (indicated by the blue color), the current volatility is greater than the historical average volatility.
If the ATR line is above the ATR MA line (indicated by the red color), the current volatility is less than the historical average volatility.

Volume OximeterOVERVIEW
The Volume Oximeter (VOXI) is a technical indicator that gauges the amount of volume currently present in the market, relative to the historical volume that was present before. The purpose of this indicator is to filter out with-trend signals during ranging/non-trending conditions.
CONCEPTS
This indicator assumes that trends are more likely to start during periods of high volume, compared to during periods of low volume. This is because high volume indicates that there are bigger players currently in the market, which is necessary to begin a sustained trending move.
So, to determine whether the current volume is "high", it is compared to an average volume for however number of candles back the user specifies.
If the current volume is greater than the average volume, it is reasonable to assume we are in a high volume period. Thus, this is the ideal time to enter a trending trade due to the assumption that trends are more likely to start during these high volume periods.
The default values in the indicator are designed for use on the daily chart but can be applied to any timeframe.
The default volume lookback period is 259 since there are usually 259 daily candles in a year on Forex daily charts. This means that the average volume will represent the average volume over the past year. This would be 365 on Crypto daily charts, since the Crypto is open 24/7 instead of 24/5). This is what the current volume will be compared to.
The default smoothing lookback period is 10, but this can be adjusted depending on the indicator that's giving you your with-trend signals. After my backtesting, 10 was the best value for my with-trend indicator, so you should do your own testing to see which value works best with your with-trend indicator.
HOW DO I READ THIS INDICATOR?
If the VOXI line is above or equal to zero (indicated by the blue color), the current volume is greater than the historical average volume.
This is a good time to take with-trend signals since high volume is necessary for sustained trending moves to begin.
If the VOXI line is below zero (indicated by the red color), the current volume is less than the historical average volume.
This is a good time to ignore with-trend signals since an absence of volume indicates that there aren't big market participants to participate in a new trending move.

Fractal Dimension Index The Fractal Dimension Index is a technical indicator that gauges the amount of volatility currently present in the market.
The theory behind this indicator is that a value of 1.5 suggests the market is acting in a completely random fashion. As the market deviates from 1.5, the opportunity for earning profits is increased in proportion to the amount of deviation.
Keep in mind that the indicator does not show the direction of trends ! Although you can try to test it as a trend-following indicator that gives trend-following signals, that isn't the intended use of the indicator.
The Fractal Dimension Index is red when the market is in a trend. And it is blue when there is high volatility. When the Fractal Dimension Index changes its color from red to blue , it means that a trend is finishing. The market becomes erratic and high in volatility when the Fractal Dimension Index is blue . Usually, these "blue periods" do not go on for a long time, they come before a new trend.
So, look for trend-following signals while the Fractal Dimension Index is blue since this indicates high volatility before a potential trend, and avoid trend-following signals when the Fractal Dimension Index is red since this indicates a ranging/non-trending market or a trend that started long ago.

Volume + VolatilityBefore I begin I want to mention:
1. This is a variation of the 'CCI & BB' made by matsu_bitmex (Link: ) and SigmaDraconis's 'On Balance Volume Oscillator + Bollinger Bands' (Link: )
2. While using this sometimes you may not notice the crossover so I've added the Line 'x' outside 'x' BB to only see if Line 3 and 4 crossed over
The indicator:
1. When the background is green and the 2 lines are going up it means uptrend
2. When the background is red and the 2 lines are going down it means downtrend
3. When there is a crossover and the background outside BB turns yellow, it means there is a lot of volatility or volume
How to use (Or how I use this):
1. All trades based on the yellow color MUST be during a trend
2. When the color changes to yellow for the 1st time in the direction of a trend it is advisable to enter
Strategy - Cryptosystem NNFX wayFirst script done!
This is my version of the No-Nonsense Forex (NNFX) Strategy
This strategy shows you the entry and exit signal with a standard 1.5 x ATR for Stop Loss and 1 x ATR for Taking Profit. You can adjust the settings to your needs.
This strategy uses 5 indicators:
1. Average True Range for SL and TP placement, there is a nuance where you can add the 1XATR Rule;
2. SMA used to filter longs and shorts;
3. SSL Channel for 1st Confirmation;
4. DPO for 2nd Confirmation;
5. Waddah Attar Explosion as a volume indicator.
There is no exit indicator because I coded 2 trades (2x0.5). TP1 will be at 1xATR and TP2 will automatically trail behind with 1.5XATR. You can see the red trailing line on the charts.
Other exits can be: When SSL gives opposite signal or when price crosses and closes your baseline.
I used this system for 1D timeframe.
Hopefully this can be usefull for your tradingstyle.
Would be great if you guys leave a like.
Thanks!

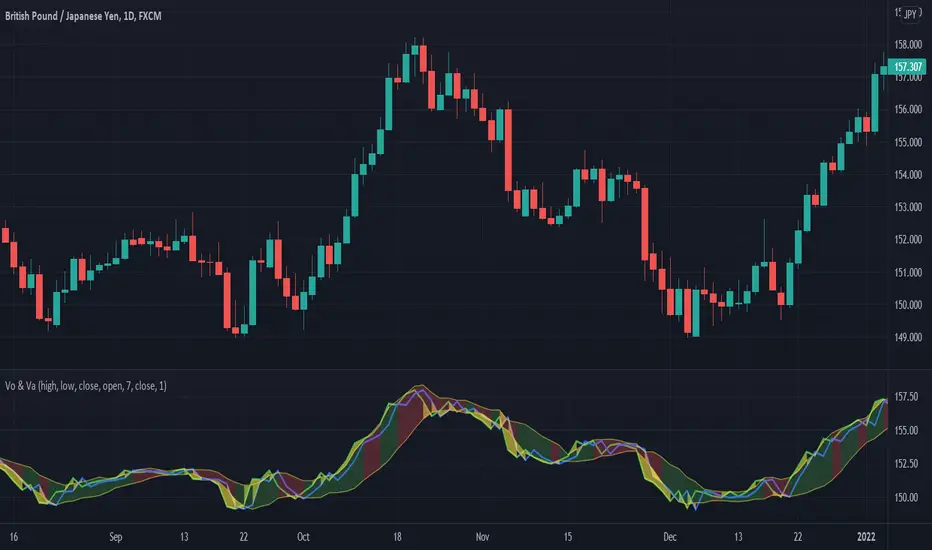
Soldi OscillatorThe Soldi Oscillator measures the mean of logarithmic returns, given this data you can assume market expectancy in returns of the mean. When seeing positive Means you can assume positive returns will follow positive returns if positive autocorrelation is present. Vice versa for the other event of negative returns.
How you can effectively use this indicator and oscillator is by looking at a higher time frame and if the oscillator is positive, you can go to a lower timeframe and try to trade in that direction of the market as the expected returns are positive in nature.
You can also spot trend divergences very well as the trend continues but the returns are dropping that means the returns are mean reverting and can have a potential to flip to the other side

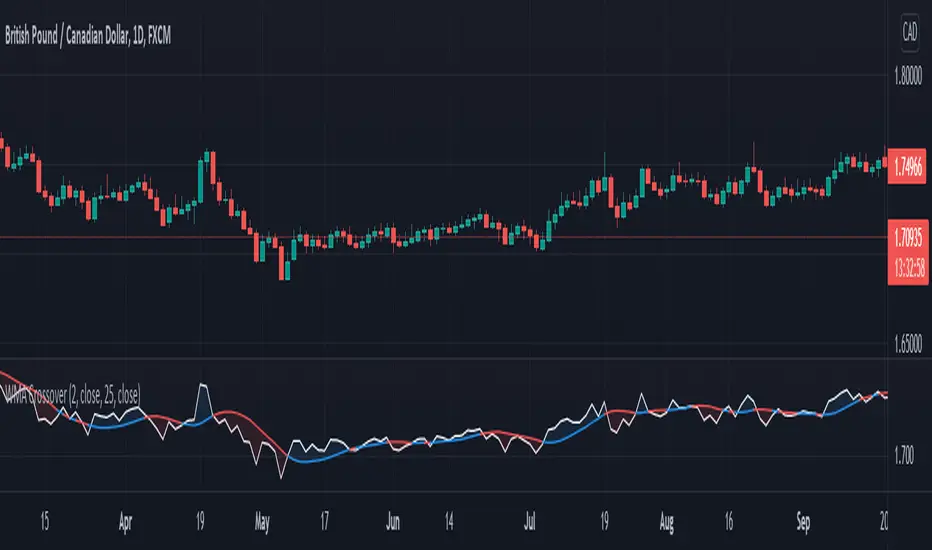
Moving Average Multitool CrossoverAs per request, this is a moving average crossover version of my original moving average multitool script .
It allows you to easily access and switch between different types of moving averages, without having to continuously add and remove different moving averages from your chart. This should make backtesting moving average crossovers much, much more easier. It also has the option to show buy and sell signals for the crossovers of the chosen moving averages.
It contains the following moving averages:
Exponential Moving Average (EMA)
Simple Moving Average (SMA)
Weighted Moving Average (WMA)
Double Exponential Moving Average (DEMA)
Triple Exponential Moving Average (TEMA)
Triangular Moving Average (TMA)
Volume-Weighted Moving Average (VWMA)
Smoothed Moving Average (SMMA)
Hull Moving Average (HMA)
Least Squares Moving Average (LSMA)
Kijun-Sen line from the Ichimoku Kinko-Hyo system (Kijun)
McGinley Dynamic (MD)
Rolling Moving Average (RMA)
Jurik Moving Average (JMA)
Arnaud Legoux Moving Average (ALMA)
Vector Autoregression Moving Average (VAR)
Welles Wilder Moving Average (WWMA)
Sine Weighted Moving Average (SWMA)
Leo Moving Average (LMA)
Variable Index Dynamic Average (VIDYA)
Fractal Adaptive Moving Average (FRAMA)
Variable Moving Average (VAR)
Geometric Mean Moving Average (GMMA)
Corrective Moving Average (CMA)
Moving Median (MM)
Quick Moving Average (QMA)
Kaufman's Adaptive Moving Average (KAMA)
Volatility-Adjusted Moving Average (VAMA)
Modular Filter (MF)

Moving Average MultitoolI made this script as a personal tool while backtesting multiple moving averages. It allows you to easily access and switch between different types of moving averages, without having to continuously add and remove different moving averages from your chart.
It also has the option to show the a 14 period average distance between the closing price of an asset and the selected moving average, as a multiple of ATR. This number can be shown by enabling the "Show ATR Between MA and Close" setting. The intention of this value is to quantify and compare the speed of different moving averages across any instrument and any timeframe. The higher the value, the slower the moving average. The lower the value, the faster the moving average.

WMA Combo Crossover V2Before I begin I want to mention:
1. This is an upgrade of my indicator WMA Combo Crossover. (Link: www.tradingview.com)
2. The upgrade was inspired from the CCI and Bollinger Bands indicator by matsu_bitmex. (Link: www.tradingview.com)
3. I have combined the indictor with Bollinger Bands , coloring those sections as yellow, to increase winning trades as well as avoid losing trades by spotting potential reversals with the aid of news avoidance
4. This indicator is designed primarily for NNFX (No Nonsense Forex) though it can be used for any type of trading style
5. Also, I want to thank kurtisbu for helping me out. Thank you!
The indicator:
1. When WMA 25 is blue and is going upwards, it means there is an uptrend
2. When WMA 25 is red and is going down, it means there is a downtrend
3. During a trend, the color may switch to red and blue occasionally. When the color switches back to the direction of the trend, it can be used for re-entries
4. All trades based on the yellow color MUST be during a trend
5. When the color changes to yellow that means price is very volatile and only on the 1st candle is it advisable to enter a trade. (I have not backtested entering on the 2nd candle of a yellow color change)
6. During a trend, when the color changes to yellow and there is an incoming news event, then the chances of a reversal increase and I recommended avoid entering

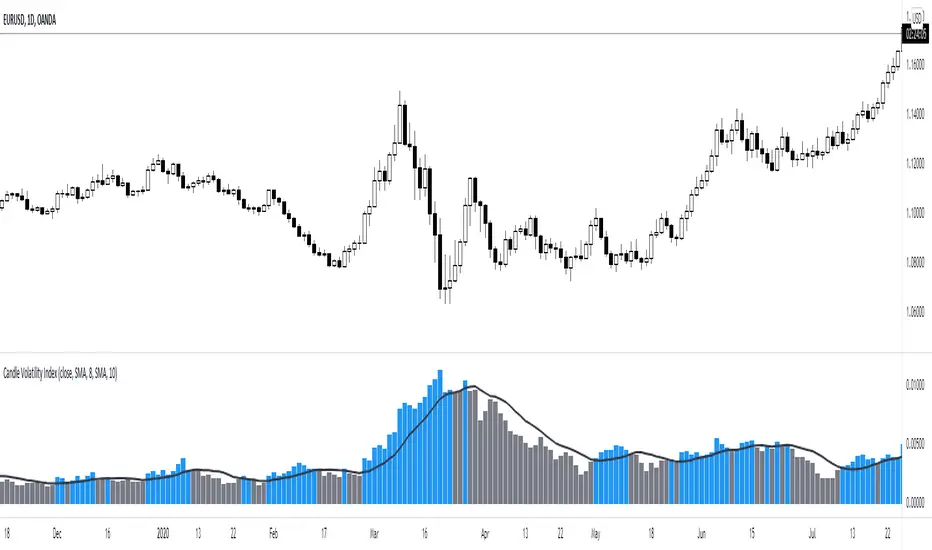
Candle Volatility Index [by NicoadW]This is the migration of the CandleVolatilitIndex from MT4.
The indicator works as following:
Step 1: The "Volatility Value" is calculated by applying a moving average to the change of the selected source (default: 10-Period-SMA applied to the change from last close to this close -> SMA(close-close , 10) )
Step 2: The signal line is calculated by applying a moving average onto the "Volatility Value" calculated in step 1.
The default settings are the same as in the original MT4 version.
Visualization:
The histogram shows the "Volatility Value" calculated in step 1.
Case 1:
The value is above the signal line (blue bar) -> Volatility is given
Case 2:
The value is below the signal line (grey bar) -> Volatility is not there
This is intended to be used as a Volume/Volatility Indicator for a NNFX-System but can be used in any strategy.
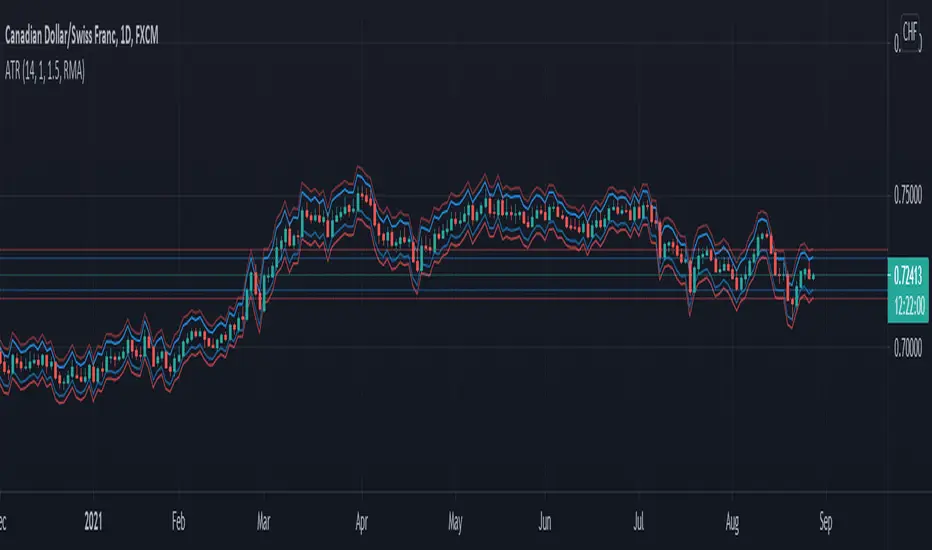
NNFX ATRBefore I begin I want to mention:
1. This is an indicator specially made for NNFX traders who use the ATR rule of ATR1x for Take Profit and ATR1.5x for Stop Loss
2. It is a product of combining the in-built ATR and Dillon Grech's ATR ()
The indicator:
1. It can be used for a quick look using the lines to see instead of calculating whether price hit a TP or SL. However I have kept the Main ATR for those who want to record the ATR into the spreadsheet when back testing or forward testing
2. When placing a buy/long order, TP is blue and appears above price, SL is red and appears below price
3. When placing a sell/short order, TP is blue and appears below price, SL is red and appears above price
4. The Main ATR, which is yellow, is way below price because I didn't want the chart to be overwhelmed by a 5th line in the middle of 2 TPs and SLs aka make the chart look claustrophobic
WMA Combo CrossoverBefore I begin I want to mention:
1. This is an inspiration from the Ultimate Oscillator by zinlytics. (Link: )
2. I wanted to make an indicator similar to the Ultimate Oscillator by making it more responsive to price
3. This indicator is a trend indicator which uses the Weighted Moving Average (WMA)
4. Also, I want to thank PhoenixBinary for helping me out
The indicator:
1. Made several changes such as switching over to a WMA instead of an EMA
2. When WMA 20 is blue and is going upwards, it means there is an uptrend
3. When WMA 20 is red and is going down, it means there is a downtrend
4. During a trend, the color may switch to red and blue occasionally. When the color switches back to the direction of the trend, it can be used for re-entries
[FTA] Curvature of MeniscusIntroduction:
Curvature of Meniscus is a hybrid indicator comprised of three parts:
1. The first part is a heavily modified Demarker RSI which is represented as the histogram and is the main trend indicator C1 .
2. The second part is the 0 line which is replaced by the Waddah Attar Explosion V2 indicator C2 .
3. The third part is the background color which is borrowed from the Klinger Safety Zones volume indicator Vol .
It is smooth and has almost zero lag.
The signals can be used as per nnfx C1-C2-Vol algorithm.
The DeMarker indicator is relatively unknown to trading beginners but enjoys huge support from the more experienced traders. The indicator measures the strength of a trend and thus can give you a warning when a change in the trend direction might occur. This can not only help you to find new trade entries but also prevent you from entering into losing trades or letting your open trades run and ultimately result in a loss.
The line of the indicator is calculated as follows: First the indicator finds the minimal and the maximal value of the specified period. Afterwards those values are used to calculate the moving average of these values which then is displayed in the chart. Just like most oscillators the DeMarker indicator uses oversold and overbought zones at 0.3 and 0.7 to define good entry opportunities.
The "Curvature of Meniscus" indicator has the DeMarker indicator/RSI modified in three different ways:
1. Smoothed and almost no-lagged;
2. Colored histogram to determine the trend and the divergences;
3. An early signal line for those who like to take counter-trend trades/reversal entries.
Play with the settings and let me know what you think about this new hybrid!

MM ATR Risk CalculatorBased on the NNFX Lot size position calculations MoneyMovesInvestments would like to provide to you the Free MM Atr Risk calculator
Directions are simple
Tells you the Atr value
Stop loss in pips
You can enter your account size
Based on your account size, enter the percent you want to risk
then the calculator will tell you your stop loss in pips based on current market and your lot size based on the account size and percent you want to risk
Check us out for your other trading needs
Link below or PM us for access to our other indicators
Happy Trading

MM PullbackThis Strategy Indicator that detects price reaction zones and give out high probability trades when price pulls back from the zone
with two built in Oscillators the Momentum Oscillator and StochRsi
Art x1.5 SL and Two Tp Levels and Sl alarm to help backtesting
also Built in Channel indicators to help filter trades
Also alerts for all the signals
How to Use
Best time to buy is when you see the Buy badge at the bounce off the Green MA
vis Versa for Sells
for signals that are away from the MA that acts like your major level of S&R
you can use the Bands to help catch the current trend
This is an advanced Market Structure Algo First be able to identify market trend and structure before using this algo
For access please PM
Happy trading
Price Cross Range StrengthPurpose:
This script shows when price is in a range or trending. When the green line rises above the threshold the price is trending. When the green line falls below the threshold it's ranging. You may try adjusting the lookback way far back to find more areas of resistance.
Logic:
It shows how many instances the current price has been crossed in the past measured bars. The logic is that any price area that has been crossed many times is a strong area where ranging occurs.
Ideas:
1. Can be used as a dynamic length to other moving averages.

MM Session Open AlgoThe MM Session Open Algo is a strategy to catch the opening breakout of a security
displays the current session with background color
Entry, Stop Loss Based on Atr, and two Take Profit levels
Kill zone entries for New york and London session
provides valid signal for entry once price crosses entry line
and set "opening session price" to determine what signal you are looking for. based on time frame
shows the Daily,Weekly,Monthly high and low
average daily range
and comes with trend filter.
Directions are Simple
when price crosses and closes above entry line. you get in with the set inputs of Tp and Sl
or you can set buy/sell stops with the price provided for you and ride the wave of the direction it goes with he Tp and Sl provided
Link below or PM us for access to this indicator Happy Trading

Strategy NNFX Tester Strategy NNFX, Baseline, QQEs Fast C1, Slow C2, ATR, Volume and Exit
This is a Strategy Tester designed to work with Study (Alerts) of the same.
At time of creation based on Revision 8 of the Study.
DO NOT USE the Currency/Money Management section under settings. use the position sizing under "Inputs" - "Money Management" - "Risk per trade" which is defaulted to 2%
This has adjustable Baselines, Exits, ATR calculations, C1 and C2 are currently QQE & QQE Histo with adjustable settings but I'll include more choice of C1 & C2 as time goes on.
Find settings that work for you, then move them over to the Study version for best results.
Forward plans are to add much more options to both Alert/Strategy.
If anyone wants to collaborate or anything hit me up.

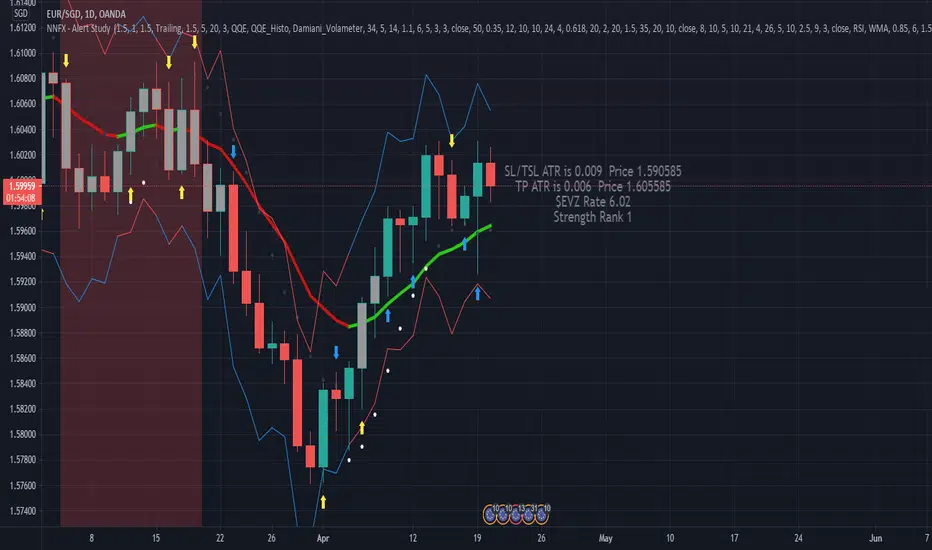
NNFX, Baseline, QQEs Fast C1, Slow C2, ATR, Volume and ExitDesigned Around the NNFX rules
Selectible Baseine
Selectible Exit Indicators
ATR bands, ATR labels for TP and TSL (1x and 1.5x ATR).
Indication (White Diamond) where candle is over 1x ATR in size.
Combined QQE Fast & Slow (C1 & C2) confirmations, Candles Grey before Trend Confirmed, change to Normal Colour when Trend established (QQE MOD used for calcualtions).
Continuations signaled by white dot above/below candle (0.9x ATR from Close Signal).
Exit Long and Exit Short signaled by Red and Blue Arrow under/above candle.
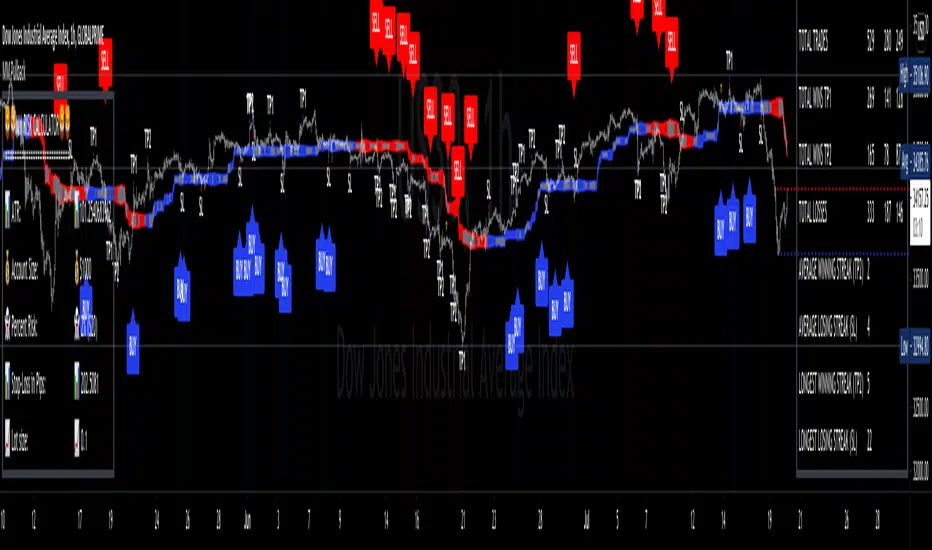
MM DonBased on the nnfx trading style this algorithms has many different calculations to provide the best signal and confirmations
1. The SuperSmooth Forecast Moving Average
2. TrendLine Moving Average
3. Smoothed Heiken Ashi Moving Average
4. Baseline that can change between 15 different moving averages
Buy/Sell Alarms for all the moving averages
Exit buy/sell Alarms
Entry
3 TP
ATR x1.5 Stop Loss auto generated per signal.
Also be able to set tp alarms for both buy/sell entries. so you place your trade and be alerted when your take profits have been hit.
works on all timeframes for scalpers, intraday, or even swing.
effective on binary as well.
Directions are simple
combine simple Market Structure & as long as everything matches (Buy Signal & everything is blue + baseline is white) (Sell Signal & everything is Red + Baseline is Red) you can enter the signal generated, exit the trade when told to exit and Manage your trade.
this was made to make trading easy and create confidence with in the trader.
Link below or PM us for access to this indicator Happy Trading
