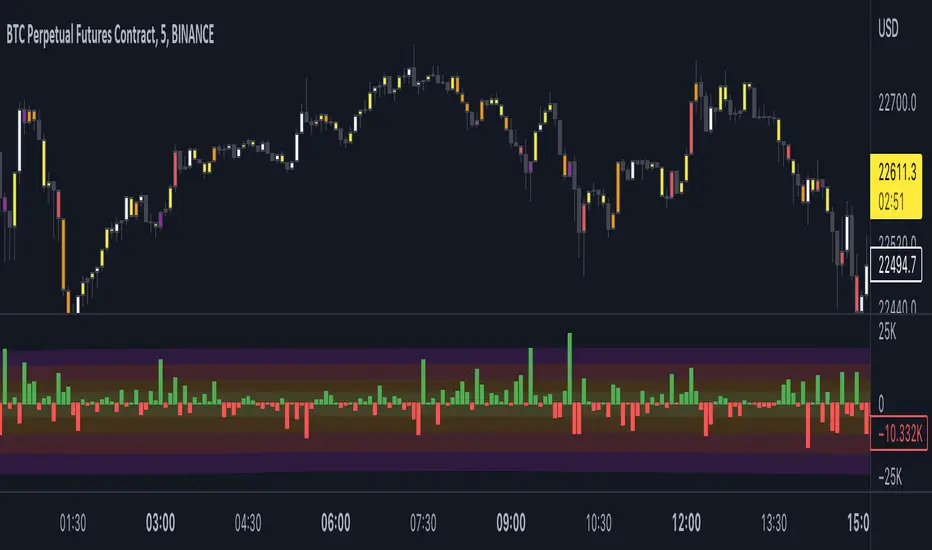
Open Interest Delta - By LeviathanThis script plots Open Interest Delta (change in OI). It also draws a heatmap and colors chart's candles to help you identify bars with large OI increase or decrease and apply Open Interest analysis concepts to your trading.
Positive OI Delta = net increase in open/unsettled positions
Negative OI Delta = net decrease in open/unsettled positions
OI
Open Interest Profile (OI)- By LeviathanThis script implements the concept of Open Interest Profile, which can help you analyze the activity of traders and identify the price levels where they are opening/closing their positions. This data can serve as a confluence for finding the areas of support and resistance , targets and placing stop losses. OI profiles can be viewed in the ranges of days, weeks, months, Tokyo sessions, London sessions and New York sessions.
A short introduction to Open Interest
Open Interest is a metric that measures the total amount of open derivatives contracts in a specific market at a given time. A valid contract is formed by both a buyer who opens a long position and a seller who opens a short position. This means that OI represents the total value of all open longs and all open shorts, divided by two. For example, if Open Interest is showing a value of $1B, it means that there is $1B worth of long and $1B worth of short contracts currently open/unsettled in a given market.
OI increasing = new long and short contracts are entering the market
OI decreasing = long and short contracts are exiting the market
OI unchanged = the net amount of positions remains the same (no new entries/exits or just a transfer of contracts occurring)
About this indicator
*This script is basically a modified version of my previous "Market Sessions and Volume Profile by @LeviathanCapital" indicator but this time, profiles are generated from Tradingview Open Interest data instead of volume (+ some other changes).
The usual representation of OI shows Open Interest value and its change based on time (for a particular day, time frame or each given candle). This indicator takes the data and plots it in a way where you can see the OI activity (change in OI) based on price levels. To put it simply, instead of observing WHEN (time) positions are entering/exiting the market, you can now see WHERE (price) positions are entering/exiting the market. This is the same concept as when it comes to Volume and Volume profile and therefore, similar strategies and ways of understanding the given data can be applied here. You can even combine the two to gain an edge (eg. high OI increase + Volume Profile showing dominant market selling = possible aggressive shorts taking place)
Green nodes = OI increase
Red nodes = OI decrease
A cluster of large green nodes can be used for support and resistance levels (*trapped traders theory) or targets (lots of liquidations and stop losses above/below), OI Profile gaps can present an objective for the price to fill them (liquidity gaps, imbalances, inefficiencies, etc), and more.
Indicator settings
1. Session/Lookback - Choose the range from where the OI Profile will be generated
2. OI Profile Mode - Mode 1 (shows only OI increase), Mode 2 (shows both OI increase and decrease), Mode 3 (shows OI decrease on left side and OI increase on the right side).
3. Show OI Value Area - Shows the area where most OI activity took place (useful as a range or S/R level )
4. Show Session Box - Shows the box around chosen sessions/lookback
5. Show Profile - Show/hide OI Profile
6. Show Current Session - Show/hide the ongoing session
7. Show Session Labels - Show/hide the text labels for each session
8. Resolution - The higher the value, the more refined a profile is, but fewer profiles are shown on the chart
9. OI Value Area % - Choose the percentage of VA (same as in Volume Profile's VA)
10. Smooth OI Data - Useful for assets that have very large spikes in OI over large bars, helps create better profiles
11. OI Increase - Pick the color of OI increase nodes in the profile
12. OI Decrease - Pick the color of OI decrease nodes in the profile
13. Value Area Box - Pick the color of the Value Area Box
14. Session Box Thickness - Pick the thickness of the lines surrounding the chosen sessions
Advice
The indicator calculates the profile based on candles - the more candles you can show, the better profile will be formed. This means that it's best to view most sessions on timeframes like 15min or lower. The only exception is the Monthly profile, where timeframes above 15min should be used. Just take a few minutes and switch between timeframes and sessions and you will figure out the optimal settings.
This is the first version of Open Interest Profile script so please understand that it will be improved in future updates.
Thank you for your support.
** Some profile generation elements are inspired by @LonesomeTheBlue's volume profile script

Volume CVD and Open InterestVolume, Cumulative Delta Volume and Open Interest are great indications of strength and sentiment in the market. Until now they have required separate indicators, but this indicator can show them all.
With a clean and aesthetic plot, this indicator has the option to choose the data source:
- Volume - the total volume of transactions, buys and sells
- Up Volume - the total volume from buys only
- Down Volume - the total volume from sells only
- Up/Down Volume (Net) - the difference in the Buy Volume and Sell Volume
- Cumulative Delta - the sum of the up/down volume for the previous 14 bars
- Cumulative Delta EMA - a smoothed average of the sum of the up/down volume for the previous 14 bars, over a 14 period EMA
- Open Interest - a user defined ticker, whose value is added to the plot, while this is designed to be used with Open Interest tickers, you can actually choose any ticker you want, perhaps you want to see DXY while charting Bitcoin!
There are several customization features for the colour of the plot, with a nice gradient colouring from high to low. You can choose the lookback which defines only the highest and lowest values for the colour gradient. There is also an option for how the Open Interest value is determined, based on Close, Open or differences between previous values.
While similar, Volume and Open Interest are not the same. To me the simplest explanation is Volume shows the trades that have been executed and the buy/sell direction, while Open Interest shows the value of open trades that are yet to be completed.
Volume shows strength, sentiment and volatility.
Open Interest does not show direction, but does indicate momentum and liquidity in the market.

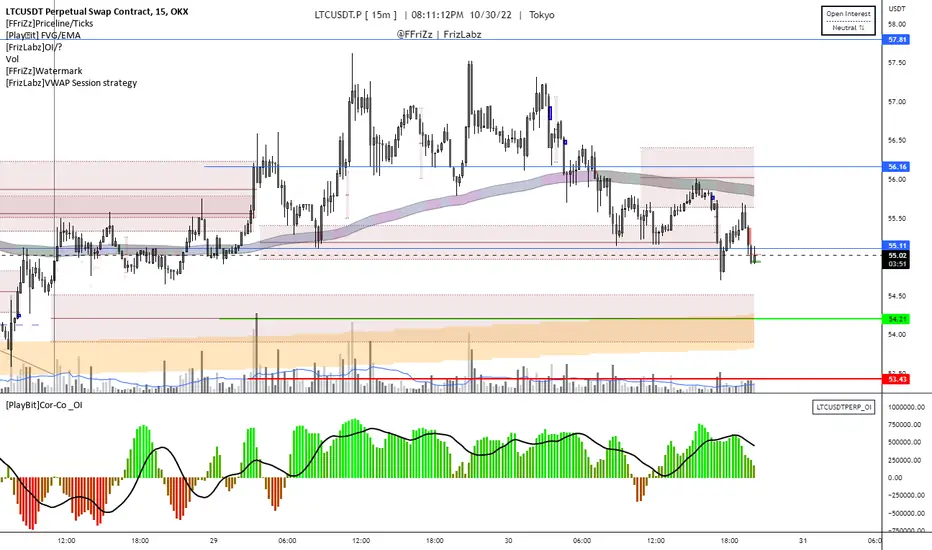
[PlayBit]Correlation-Co _OI Correlation-Co _OI
This Indicator uses a Correlation Coefficient to compare a Crypto Currency to the Binance Open Interest feed if the data is provided
A move in the same direction is indicated with a positive value (the indicator will move up)
A move in the opposite direction the indicator will indicate with a negative value (the indicator will move down)
If both are moving in the same direction and are converging or diverging this will be shown by larger values for divergence and smaller for convergence but will be a positive value
Negative values are shown when price and _OI are moving opposite each other
You can toggle the auto Open Interest option in the settings to use something other than Open Interest if you would like
I still need to add a visual showing when longs are unwinding or opening and when shorts are covering or opening
This is a concept that I made for @Johnny a while back and I'm republishing public from private
This can be useful when comparing a Asset with its Open Interest
The main bit of code was taken from:
by @mortdiggiddy
Let me know if you have any Ideas or suggestions or if I overlooked something
Hope you enjoy,
@FFriZz | @FrizLabz
ILM NSE Futures - Open Interest Analysis - FnOUse this indicator on Daily Timeframe
This script works only on India NSE Futures (Indices and Fno Stocks)
This script pulls Stock/Index Price/Volume Info + Futures Current/Next Price/Volume/Open Interest Info
Calculates the Combined OI and identifies the OI Buildup based on the Price Change and color codes the info for easy reading
This script also calculates Stock/Futures Volume action to identify if big players are aggressively trading in Futures
Also OI Buildup to Future Volume is calculated to track the presence of big players.
Summary Row is displayed at the bottom which shows Futures Premium/Discount to Index/Stock

Crypto Longs & Shorts (Multi Exchange) - InFinitoThis indicator uses data provided by different crypto derivative exchanges to estimate and display the potential Longs and Shorts opened and closed during a determined period. The indicator supports multiple exchanges and coins.
Knowing the the behavior of traders as in how they're positioning can be useful for different things like:
Get a sense of market sentiment
Better anticipating which way liquidity/stop hunts might potentially go.
All data is calculated based off OI data provided by exchanges except for Bitfinex which provides both Longs and Shorts opened and closed
Preset exchanges included are:
Bitfinex
Binance: USDT, USDPERP & BUSD pairs
Bitmex: USDT & USD pairs
Kraken
The indicator is preset to work with BTC but it can be easily changed to any coin by typing it's name (Capitalized) in the Coin Name box

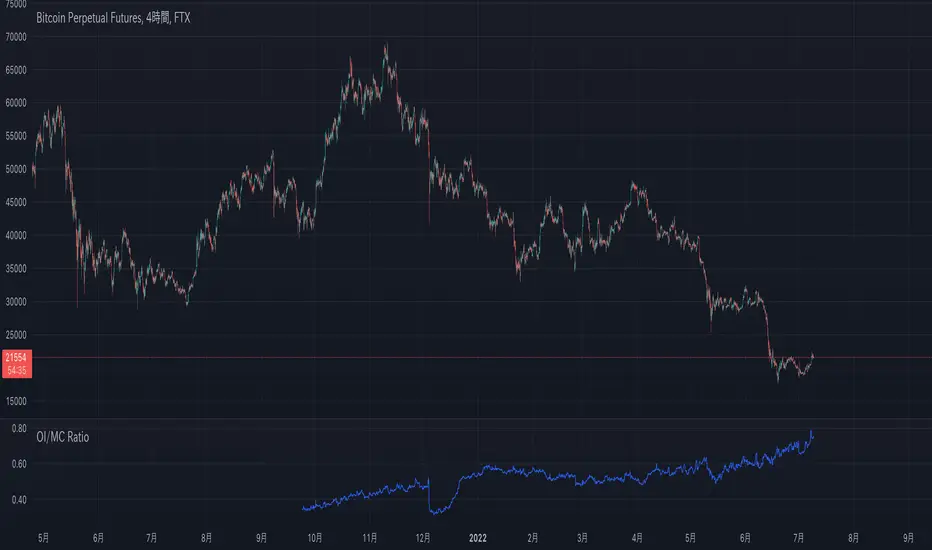
OI/MC Ratio(Open Interest/Market Cap Ratio)Created the OI/MC Ratio (Open Interest/Market Cap Ratio), an indicator that can be frequently observed on other data sites but does not yet exist on TradingView.
The formula is as follows
Ratio = (OI/MC)*100
OI includes all currently available in TradingView.
It is also possible to exclude specific OIs on the settings screen.
====OI List====
〜Binance〜
BTCUSDTPERP
BTCPERP
BTCBUSDPERP
〜Kraken〜
BTCUSDPERP
〜Bitmex〜
XBTUSD
XBTUSDT
=============
Binance Big Open Interest Delta Change v2 Note: This script will only work properly with Binance Futures symbols.
This script simply looks at the open interest for the symbol you are currently viewing and determines if a large change in open interest has occurred, which triggers a background color alert.
It does this by comparing the absolute value of the range of the current open interest bar with a simple average (length set by user) of the past x range. The user also determines what is considered a 'large' change in open interest by setting a multiplier with which the current range must exceed compared to the average range in order to trigger an alert.
If the change in open interest is an increase in OI, the alert is blue, and if the change in open interest is a decrease, the alert is orange.
The open interest ticker that is used for calculation is derived by adding the current ticker and "_OI" so that it auto changes each time you switch to a new Binance futures contract.

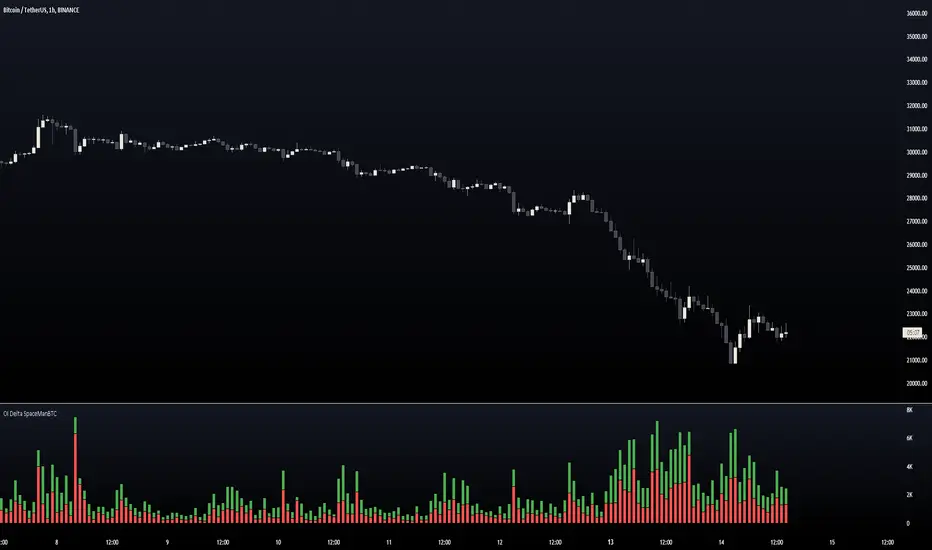
Open Interest Delta OI Delta
This indicator aims to provide users an idea for OI changes intrabar referencing the LTF data, there will be some limitations as its limited to the LTF of 1minute maximum,
however there can be some insight provided regardless.
Below we can see an additional 2 modes,
Split:
Delta
The difference between the 3 modes include:
Split is a separation of the initial mode "Singular" it divides the 2 into separate axis positioning to allow for a different perspective of the same data.
Delta: Takes the difference of the 2 and makes it easier for users to see which side was in control, personally delta makes it easier to see DIVS in momentum and where exhaustion is occuring.
-Dev note, this was made alongside many other things so less testing was done do dm me anytime if theres any issues that need solving.
.b pin-up symbolWhen trading cryptocoins, it is necessary to check the price trend of NASDAQ, BTC.D, BTC.OI, BTC spot or other coins of similar groups.
However it is very cumbersome to put a comparison symbol in the Tradingview chart and combine individual indicators one by one.
Moreover even with such a combination, the chart is messy and visibility is not good.
This script was developed as a composite-solution to that situation, and will make you happy.
- NQ1!, USTECH100CFD | symbol fixed
- BTC.Dominance, BTC.OpenInterest, BTC symbol, others pin-up-symbol | selectable
- Pin-up-symbol | selectable
- Pin-up-symbol's candle chart
- Trending
* EMA 9,21,50,200 ribbon classic EMA
* .b price line ; .b price = unique trending price with price-action + relative-volume-action + ATR
* Dynamic S/R Cloud ; BB + donchian band + high/low + atr mixed custom-logic
* VWWMA + .b price Shadow ; Volume-weighted WMA on .b price = unique MA faster than classic VWMA
Trending shadow direction is not bad even on low-timeframe (1, 2, 3, 5m, 15m...)
- Pattern
* Harmonic Pattern ; A simplified version of the harmonic pattern indicator, simply show-up pattern complete position
for reference only - adopted from HeWhoMustNotBeNamed's script.
- Information Panel
* BTC Dominance, BTC Open Interest, Pin-Up-Symbol price
* Trend meter ; 5,15,30,1h,2h,4h Meter Calc with 1 minute-timeframe candles
5 = Green if the current price is higher than the price 5 minutes ago.
1h = Green if the current price is higher than the price 2 hours ago.
4h = Red if the current price is lower than the price 4 hours ago.
* caution ; To use real-time chart of "CME_MINI:NQ1!" you have to additional subscribe CME data,
default setting is 'NQ1!' , you can change to 'USTECH100CFD'
* When you choose symbol which is closed trading hours, the script's update stopped.
Even if the selected pin-up-symbol is on trading hours, the currently selected symbol's chart doesn't update.
* recommended | chart setting > Appearance : Top margin 0%, Bottom margin 0% for optimized screen usage :)
if you have any questions freely contact to me by message on tradingview, or telegram @sr_bt
but please understand that responses may be quite late.
------------------------------------------------------------------------------------------------------------------------------------------------------------
copyright 2022 (sr_b)
Special thanks to all of contributors of community.
The script (originaly .b) may be freely distributed under the MIT license.
The other classic script code also may be freely distributed under the MIT license.
Simplified Harmonic script part | core adopted from 'Multi ZigZag Harmonic Patterns (HeWhoMustNotBeNamed)' MPL2.0 license

Derivative Effective Position [Auto+Binance] [Moto]Hello traders,
This indicator shows the effective/successful influence of perpetual contracts opening or closing via their respective side. i.e longs closing, longs, opening, shorts closing, or shorts opening. Realistically, we want to be considering which side of perpetual contracts are having a successful effect on the market to potentially avoid counter-trend trading, or to take advantage of it.
IMPORTANT: In order for this indicator to work properly/accurately you must be observing a Binance Perpetual future chart. The indicator detects which perpetual future symbol you're observing/trading and changes its comparative metrics accordingly. If you're observing some other chart, it will either be inaccurate or default to BTC open interest metrics. Avoid this error.
Depending on which direction price moves respective to which direction open interest moves, one can determine which side of the contracts are being opened or closed.
Due to Bitcoin having relative correlation to the other digital assets, it's own independent signals have been includes.
Signals include the four obvious participants for the observed asset, longs opening and closing for BTC, and important potential reversals for both the long side and short side of the observed chart, i.e longs opening into longs closing or shorts closing into shorts opening .
Filters for these signals include a standard RSI 50 midline bias, and a setting to filter out sequential signals, respective of observed asset or Bitcoin.
Alerts have not yet been included but will be included in an update.

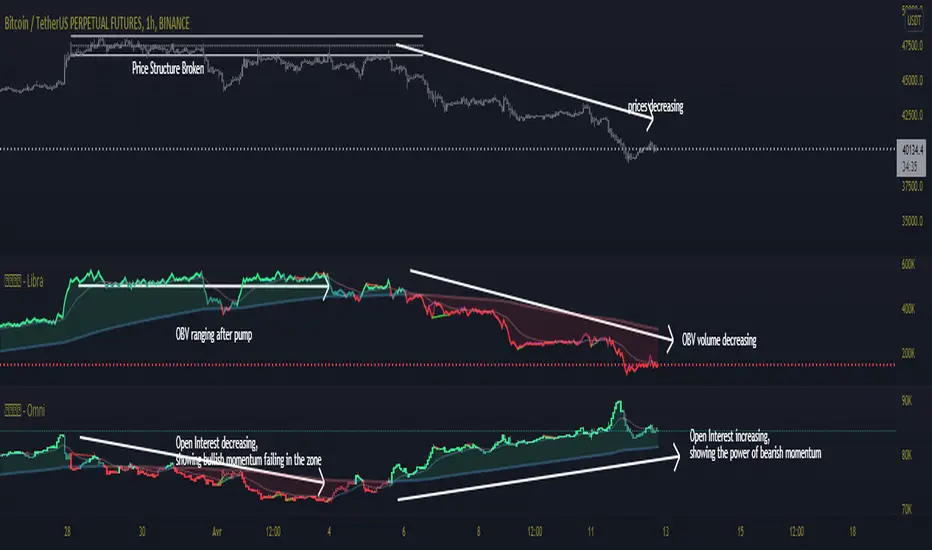
OPAL - OmniHi, here is my Open Interest script for Market Activity analysis & chop spotting.
This indicator include : Open Interest, 6 EMAs based on OI, Regular and Hidden divergences with double pivot confirmation
OI Colors is gradient : momentums with power will turn to lighter colors, momentums without power will turn to darker colors
1) OI : Open Interest
Open interest is a measure of the Money Flow into a market.
Increasing open interest shows money coming into the market.
Decreasing open interest shows money flowing out of the market.
Calculation :
Open interest is a measure of market activity.
It's sometimes confused with volumes but it's different : OI moves on new contracts, while Volume moves on new trades/
For example, if a trader holds 100 contracts and sells it to another, OI will not change,
because there is no addition of new contracts in the market, but volume will change because 100 contracts have ben transferred.
2) EMAs & Cloud :
A bunch of 6 EMAs adapted on open interest, the last of the 6 EMAs ( EMA 6) forms a colored cloud with the OI Line
EMA 1 is the first filter for OI colors
EMA6 is the last filter for OI colors
3) Multi Divergences :
Divergence detection based on 2 pivot levels verification (taken from OPAL - Newton)
Plots Regular and Hidden Divergences
Filtered with EMA 6
4) Alerts:
Set alerts on Divergences, regular, hidden, or both
Set alerts on EMA1/EMA6 Crosses
Set alerts on OBV fast Crosses with EMA 1
Set alerts on OBV slow Crosses with EMA 6
This might help you to see when market activity is increasing or decreasing to anticipate volatility in your waves.
This is not a bounded indicator like RSI or stoch's
Stick with the trends : when market activity is rising on your side)
Everything is customizable, all the settings are unlocked
Wishing you success !
<o/
Here is the other indicator used on the chart, using the same template, based on On Balance Volumes:
[Nekonyam] Auto Select Currency Binance Open InterestDisplays open interest in crypto currencies.
It automatically changes the open interest displayed according to the virtual currency displayed on the chart.
It works even if you are viewing an exchange other than Binance.
It shows open interest according to the base currency, so it works with BTCEUR and other currencies.
ETHBTC, for example, shows the open interest in ETH.
If you are viewing a currency that does not provide open interest from Binance to TradingView, it will not work.
It will not work if ETFs, CME futures, etc. are displayed. (such as GBTC or BTC1!)
仮想通貨のオープンインタレストを表示します。
チャートに表示している仮想通貨に合わせて自動で表示するオープンインタレストを変えます。
バイナンス以外の取引所を表示していても使えます。
ベース通貨に合わせてオープンインタレストを表示しているので、BTCEURなどでも使えます。
ETHBTCなどはETHのオープンインタレストが表示されます。
BinanceからTradingViewにオープンインタレストが提供されていない通貨を表示している場合は使えません。
ETFやCME先物などを表示している場合は使えません。(GBTCやBTC1!など)

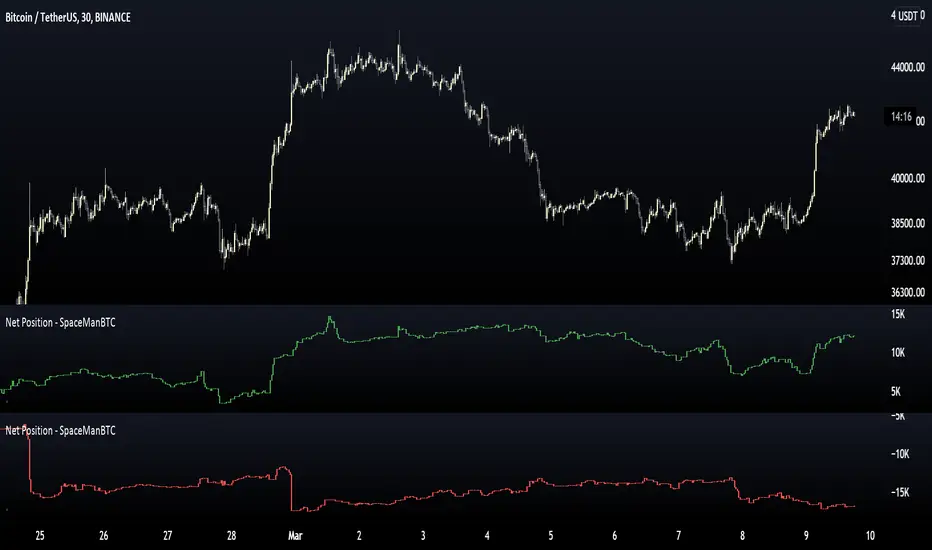
Net Position - SpaceManBTCNet Position - SpaceManBTC
Provides traders with the positioning of existing participants.
Net Longs
Net Shorts
The indicator can be used to spot large positions occuring, e.g. large long positions, and how they can influence the market such as long positions opening towards a swing high can be seen, price moving away from said positions can lead to longs being squeezed when moving away.
The use can show when trend is strong, e.g. long positions opening in can be viewed as larger players getting involved in what is potentially an uptrend. The alternative use for playing against the market can be to consider opening longs when other long traders have been stopped out/short positions are opening freshly in the attempt to play to their liquidations.
Open Interest Auto SpaceManBTCOpen Interest Auto SpaceManBTC
This is an extension to the script, it aims to provide the data in a less hands on way by providing the basis for automatic calculation on which symbol the data is being pulled from.
Changelog:
Automatic Data retrieval on a percoin basis.
Ability to hide or show symbol.
Coloring choices for the user.

OI+BC CryptoIndicator shows change of Open Interest and colors bars if OI is rising(green), based on Bitfinex data.
Colored bars can tell you if there were real buys or sells in bar. There are several crypto assets.
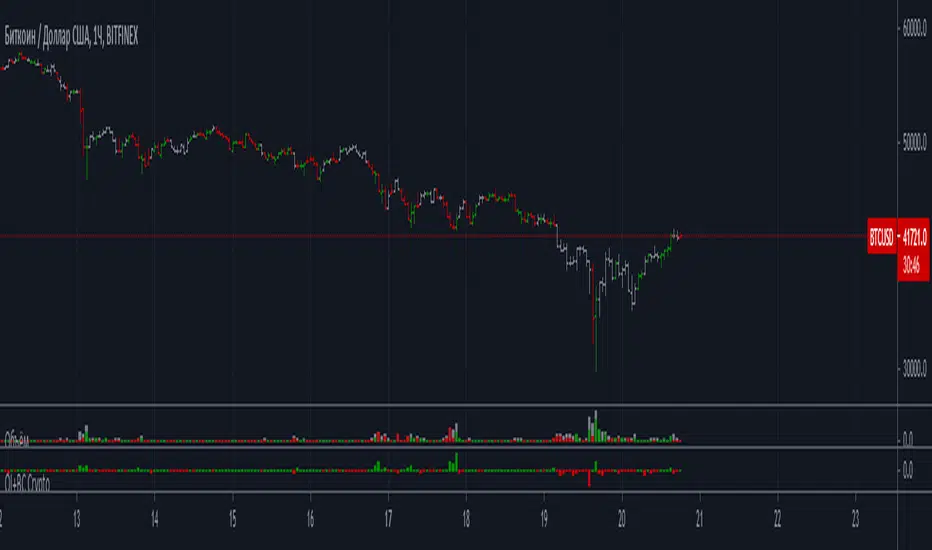
OI CryptoIndicator shows change of Open Interest based on Bitfinex data. There are several crypto assets

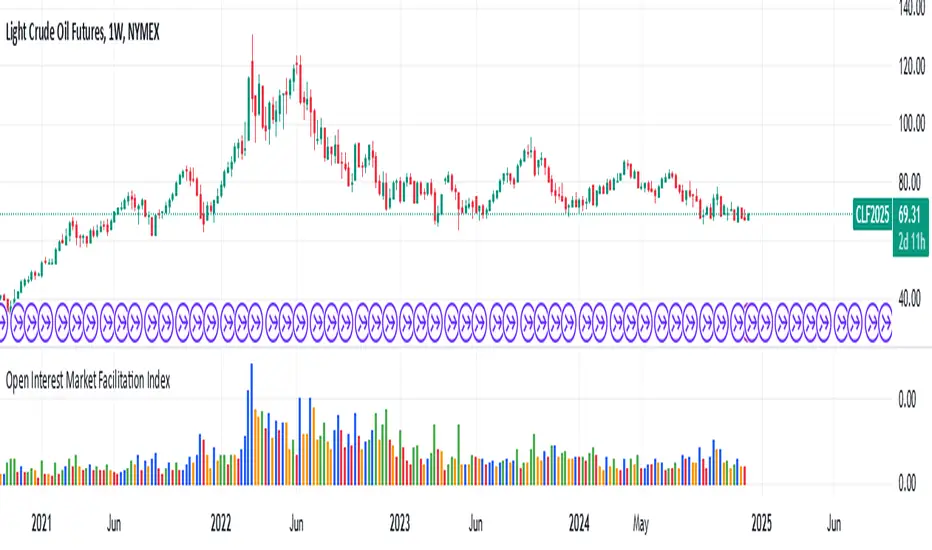
Open Interest Market Facilitation IndexOriginal script from ChartChampions :
Let's start.
This script was created by using Open Interest instead of Volume in the Market Facilitation Index.
Thus, it can make a difference in the Future and CFD Markets.
If your financial instrument is not from these markets, that is, if Open Interest is not used, you can choose Volume.
You can set "FUTURES" and "OTHERS" from the menu.
If you use the Open Interest (FUTURES) option in the menu on 1W bars and defined Future markets, it will not repaint.
This is the best use for Open Interests, as data is extracted from Quandl and CFTC COT reports are published once a week.
Color Change Rules :
In my version :
Green Bars = Green
Fade Bars = Orange
Fake Bars = Blue
Squat Bars = Red
To show the difference in the presentation, both the Futures option using Open Interest and the Others option using Volume were published to compare.
You can observe the difference.
Best regards.
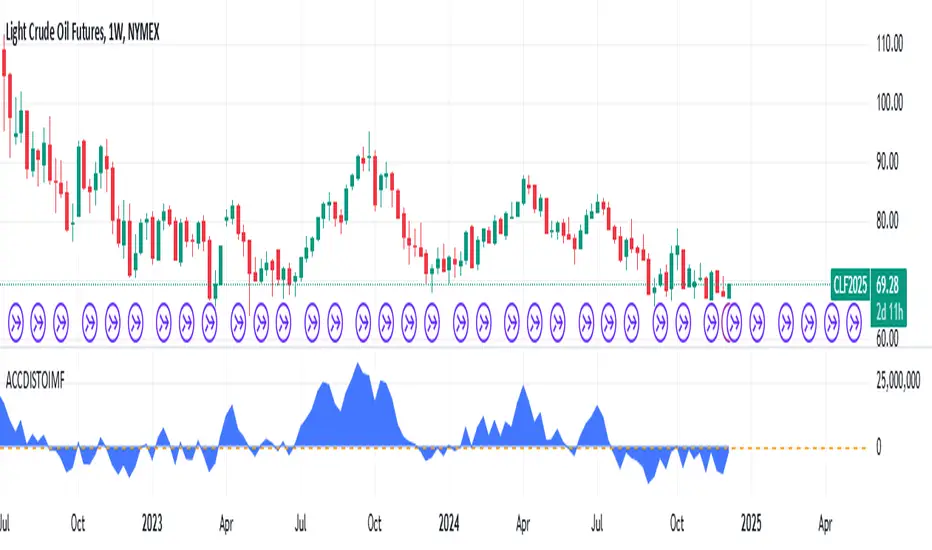
Accumulation/Distribution Open Interest Money Flow Hi, this script is the version of Accumulation / Distribution Money Flow (ADMF) that uses Open Interes ts in the required markets instead of Volume.
Can be set from the menu. (Futures/Others)
NOTE: I only modified this script.
The original script belongs to cl8DH.
Original of the script:
I think it will make a difference in the future and commodity markets.
Since the system uses CFTC data, use only for 1W timeframe.
With my best regards..
Open Interest Stochastic Money Flow IndexThis is the improved version of Stochastic Money Flow Index script that uses Open Interest instead of volume in Future markets.
I think it will make a difference especially in Future and CFD markets.
Since the system will pull data from Quandl, CFTC reports may cause repaint when disclosed.
So if you use it during the weekly time frame (1W), it will definitely not repaint.
You can also use the volume by selecting "Others" from the menu.This option applies to each instrument, you can use it on any financial instrument with or without COT data.
Bitcoin is included in the "Futures" option.
In Futures, you can observe the difference of Open Interest's success by comparing, since it counts exchanges between the two parties singularly, it reacts more firmly to speculative movements.
This script also includes alerts and bar color options, you can use from the menu.
It is also suitable for mutable variables.This script was freed from the integer loads.You can modify it in any adaptive or fractional period.
I hope it will help your analyzes, regards .

Herrick Payoff IndexThe Herrick Payoff Index is designed to show the amount of money flowing into or out of a futures contract. The Index uses open interest during its calculations, therefore, the security being analyzed must contain open interest.
The Herrick Payoff Index was developed by John Herrick.When the Herrick Payoff Index is above zero, it shows that money is flowing into the futures contract (which is bullish). When the Index is below zero, it shows that money is flowing out of the futures contract (which is bearish).
The interpretation of the Herrick Payoff Index involves looking for divergences between the Index and prices.
