High/Low/Open/Close Daily, Weekly, Monthly Line
I wrote this for the purpose of saving time while marking up charts by automating the process of drawing and labeling lines at areas of interest on larger
timeframes while still having the option to change the style and size of the lines and labels to adjust for any timeframe and avoid a messy chart.
I also used this as an exercise in menu organization giving users every imaginable option and producing clean readable code.
- This indicator draws a line on the Daily, Weekly, and Monthly bar at the High, Low, Open and Close of each bar as price
tends to react when revisiting these areas.
- Each set of bars has an optional identifying label with its own color set that can be shown with or without the lines
price value, and has drop down menus for size and style of each set of labels.
- Each set of lines has inputs for line/text color, line width and style, and can be hidden if the user doesn't have the need for any particular timeframe.
- Lines and Labels with delete when a new line is created.
- I recommend going into Chart Settings/Status Line and turning off indicator arguments OR moving the script to the top
of the indicator list to avoid an obstructed chart view with this indicators arguments. When Pine allows, I will update it to hide them.
Contains some public domain code from T.V. manuals and tutorial for creating drop down input menus for options.
/ ~For My Pal Jittery~
~ Who likes his clean chart and custom colors~
Buka

Order Block and Daily Levels VTRENDThe Order Block and Daily Levels is my first script designed to add context with order blocks to how i trade.
I have included a volume weighted band in green, as it's use is core to my trading style. I have often found however, there needs to be more clarify in structure which some of my previous scripts did not provide, so i have coded up some custom order blocks, which can be altered along the lines of how sensitive they are.
There is also a high time frame volume average line to combine the green volume weighted band to identify a bullish or bearish trend.
The other key change I am experimenting with, is trading off the daily levels, this is reflected here with a change is barcolor, above or below the daily level and a 'cross' symbol.
Included are 'chance of reversal' diamonds.
You can see here with the trend, volume and structure information given, there is a clearer idea of where price might head to next. Combine this with yur own levels too.
This can be useful on low time frames too.
So far I have experimented with this script on the 4/2/1 hour and 25 / 5 minutes

Wurucututu's Daily/Weekly/Monthly HLOCThis script draws the High/Low range for a daily, weekly, or monthly periods. By default is set to weekly.
Also it draws the open and close for each period, painting it in red if open greater than close, and green otherwise.
You can forward shift ranges to see how current price action interacts with ranges from past periods. By default this is set to zero.
For instance, here is the interaction of current week with previous week range (i.e. a 1 week shift forward).
And here is a 7 month shift forward.

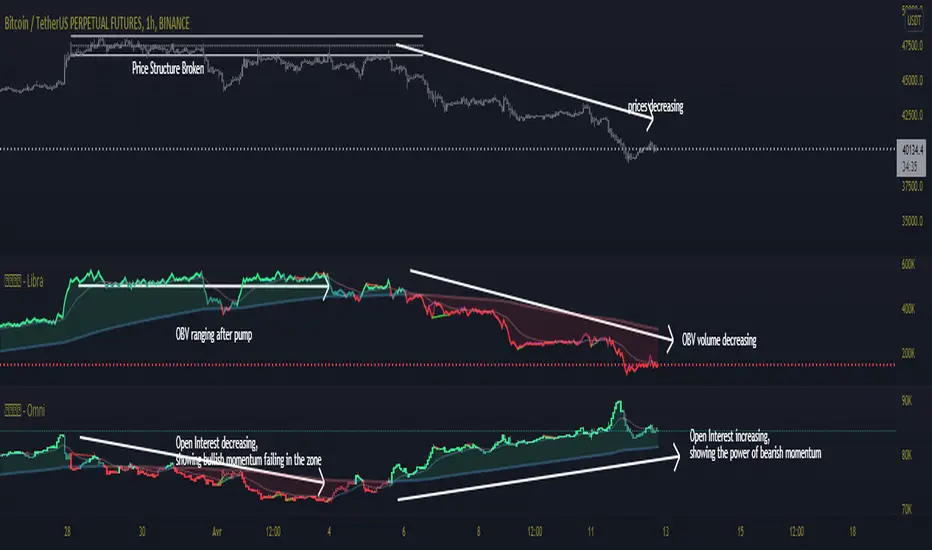
OPAL - OmniHi, here is my Open Interest script for Market Activity analysis & chop spotting.
This indicator include : Open Interest, 6 EMAs based on OI, Regular and Hidden divergences with double pivot confirmation
OI Colors is gradient : momentums with power will turn to lighter colors, momentums without power will turn to darker colors
1) OI : Open Interest
Open interest is a measure of the Money Flow into a market.
Increasing open interest shows money coming into the market.
Decreasing open interest shows money flowing out of the market.
Calculation :
Open interest is a measure of market activity.
It's sometimes confused with volumes but it's different : OI moves on new contracts, while Volume moves on new trades/
For example, if a trader holds 100 contracts and sells it to another, OI will not change,
because there is no addition of new contracts in the market, but volume will change because 100 contracts have ben transferred.
2) EMAs & Cloud :
A bunch of 6 EMAs adapted on open interest, the last of the 6 EMAs ( EMA 6) forms a colored cloud with the OI Line
EMA 1 is the first filter for OI colors
EMA6 is the last filter for OI colors
3) Multi Divergences :
Divergence detection based on 2 pivot levels verification (taken from OPAL - Newton)
Plots Regular and Hidden Divergences
Filtered with EMA 6
4) Alerts:
Set alerts on Divergences, regular, hidden, or both
Set alerts on EMA1/EMA6 Crosses
Set alerts on OBV fast Crosses with EMA 1
Set alerts on OBV slow Crosses with EMA 6
This might help you to see when market activity is increasing or decreasing to anticipate volatility in your waves.
This is not a bounded indicator like RSI or stoch's
Stick with the trends : when market activity is rising on your side)
Everything is customizable, all the settings are unlocked
Wishing you success !
<o/
Here is the other indicator used on the chart, using the same template, based on On Balance Volumes:
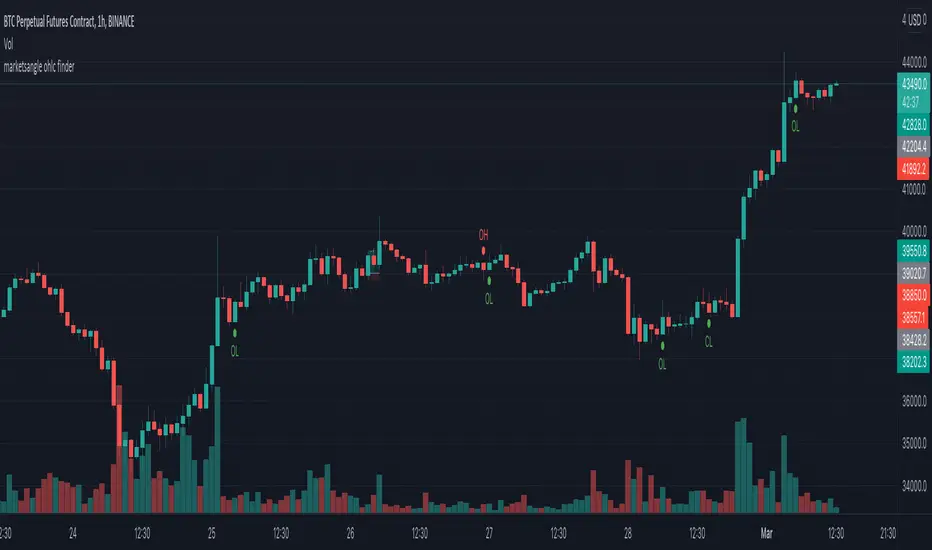
marketsangle ohlc finderThis Indicator helps you to identify open=low, open=high, close=low and close=high candles. You can use it anytime frame you want.
open=low => Shows Strong Buying Force
open=high => Shows Strong Selling Force
close=low => Shows Strong Selling Force
close=high => Shows Strong Buying Force
For best results use it with a combination of other indicators or oscillators.
[BFR] Naked LevelsDetects significant naked levels(Levels that have not been touched since the candle closed) and draws them on chart. These provide excellent profit targets and often reversal levels.
Roadmap:
✅ Candle open
☑ Point of control
☑ Multiple timeframes
☑ Something else? Leave a comment.
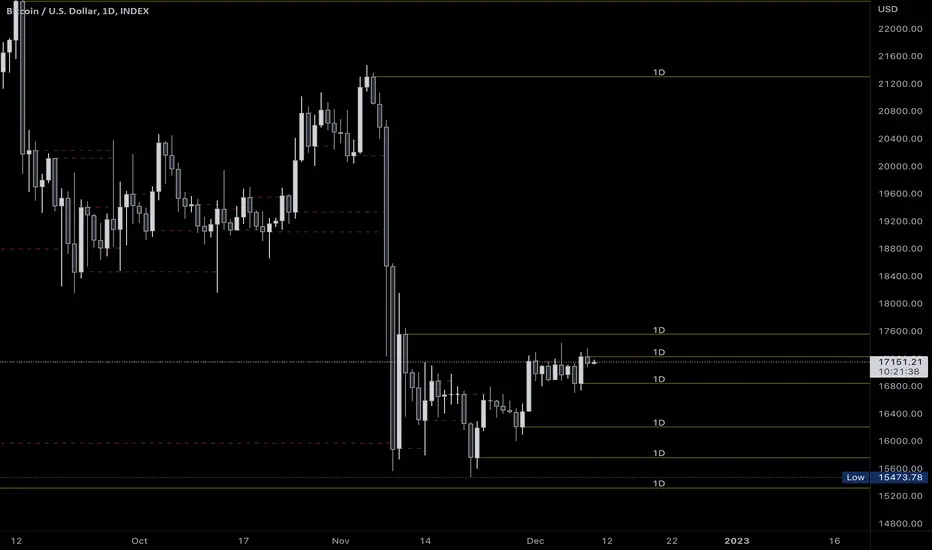
Key Levels (Time Frames - Weekly,Monthly,Quarterly,Yearly)This indicator plots the 4h, Daily, Weekly, Monthly, Quarterly, Yearly Open High, Low and Mids.
You can watch how these institutional trading levels work as support and resistance.
Most Important you can add alerts to these levels with a few clicks.
Just add/remove unnecessary levels for scaling problems.
For any error/suggestion/improvement just let me know.

Percentage Levels by TimeframePlots the positive and negative percentage levels from a selection of timeframes and sources for any ticker. You can use this within a pullback trading system. For example, if you historically look at the average pullback of large cap stocks and ETF's, you can use this indicator to plot the levels it could pullback to for an entry to go long. It can be used as potential targets when trading a ticker short. Another use for this is to backtest the set percentage targets using TradingView's bar replay feature to see how ETF's and large cap stocks have reacted at these levels. Note: This is intended to be used at timeframes equal to higher than the chart's as it may cause re-painting issues.
Currently percentage levels are statically set to 1, 3, 5, 10, 15, 20, 25, and 30% levels above and below the chosen source (open, high, low, close). You can also display the data based on timeframes from Daily (1D) all the way up to Yearly (12M)
*Not financial advice but in my opinion the current percentage levels set (see above) are best used for ETF's and Large Cap Stocks.
Jan 2
Release Notes: Added the ability to select the historical bars to look back when plotting levels
Jan 2
Release Notes: To get a better display or proper resolution on your charts, change the view settings to "Scale Price Chart Only"
Jan 2
Release Notes: To add % labels for this indicator on the price axis, change your chart settings to include "Indicator Name Label" & "Indicator Last Value". You can find this under the Label section after hitting the gear icon in the bottom right of your chart.
Jan 2
Release Notes: Added: Custom Line Plot Extension Settings. Ideally both values should be equal to display optimal extended lines. To return to a base setting: '1' = Historical Lookback & '0' = Offset Lines. Also note this is dependent on the timeframe you are viewing on the chart.
Jan 2
Release Notes: Removed indicator from example chart that was not needed.
Jan 2
Release Notes: Updated some comments in the Pine Script
Jan 2
Release Notes: Update: Added commentary and instructions in the indicator settings to address recommended line plot settings for Stocks/ETF's vs Futures
Jan 2
Release Notes: Changed title from "Calculation Method" to "Calculation Source"
Jan 4 2021
Normal use of security() dictates that it only be used at timeframes equal to or higher than the chart's as it may cause re-painting

Plot Real Open and Close - SamXI built this indicator as a personal request from a friend. He often trades using Heiken Ashi charts, but wanted a way to easily cross-reference real-price open and close values for the same timeframe on the same chart (as HA candles are by design lagging, they can take a few periods to catch up to a large move). This can also be used to help guide support and resistance zones using real-price data points should you so choose.
There are 2 major ways to configure this indicator to display real-price open and close:
As a Bar or Hollow Candle style chart overlay
As on-chart shapes (allowing individual control over which data to show - open, close, or both)

DailyDeviationLibrary "DailyDeviation"
Helps in determining the relative deviation from the open of the day compared to the high or low values.
hlcDeltaArrays(daysPrior, maxDeviation, spec, res) Retuns a set of arrays representing the daily deviation of price for a given number of days.
Parameters:
daysPrior : Number of days back to get the close from.
maxDeviation : Maximum deviation before a value is considered an outlier. A value of 0 will not filter results.
spec : session.regular (default), session.extended or other time spec.
res : The resolution (default = '1440').
Returns: Where OH = Open vs High, OL = Open vs Low, and OC = Open vs Close
fromOpen(daysPrior, maxDeviation, comparison, spec, res) Retuns a value representing the deviation from the open (to the high or low) of the current day given number of days to measure from.
Parameters:
daysPrior : Number of days back to get the close from.
maxDeviation : Maximum deviation before a value is considered an outlier. A value of 0 will not filter results.
comparison : The value use in comparison to the current open for the day.
spec : session.regular (default), session.extended or other time spec.
res : The resolution (default = '1440').
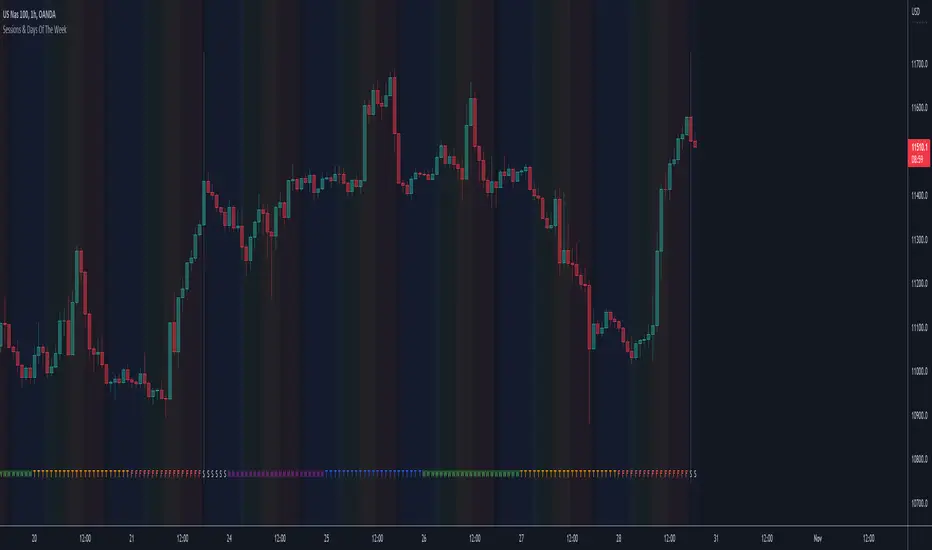
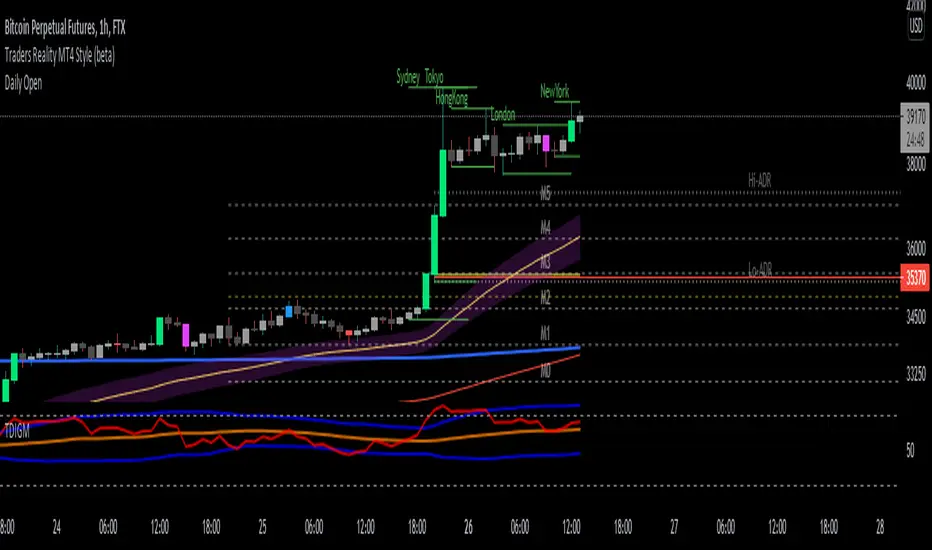
Sessions & Days Of The WeekTraders tend to focus their energy on specific sessions or time periods. This indicator will plot the days of the week, and also highlight the following sessions: Frankfurt (2:00am - 11:00am EST), London (3:00am - 12:00pm EST), New York (8:00am - 5:00pm EST), Sydney (5:00pm - 2:00am EST), Tokyo (7:00pm - 4:00am EST).
It’s important to be aware that Session Open and Close times will vary based on the time of year, as countries shift over to daylight savings time.
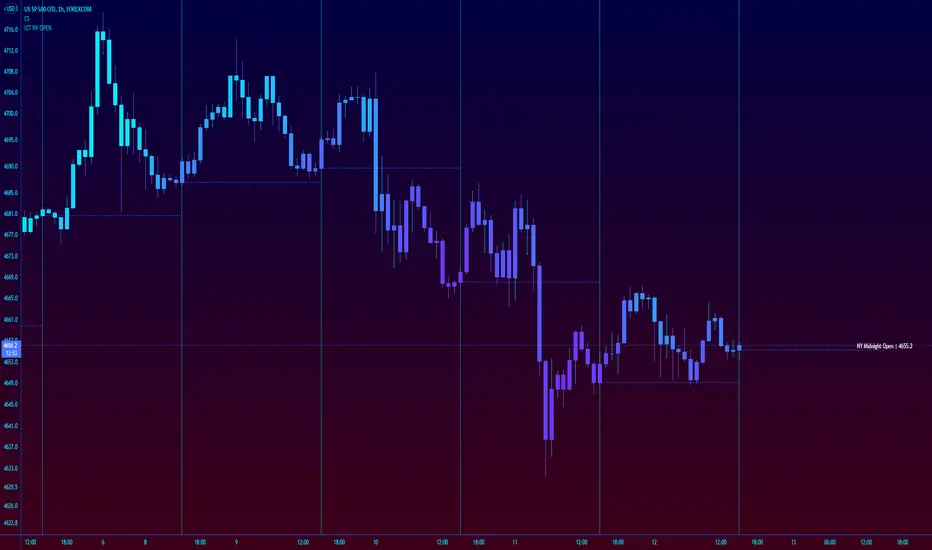
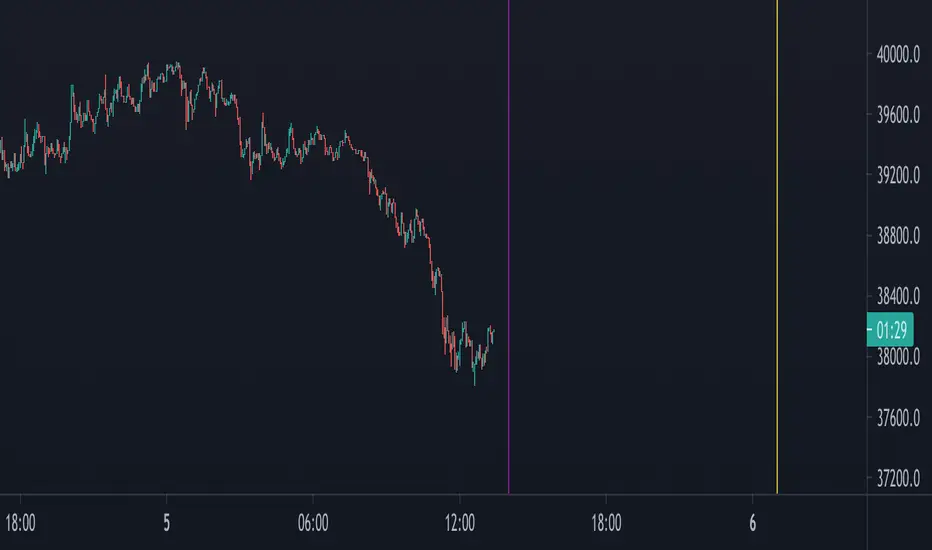
ICT New York NY Midnight Open and DividerThis simple indicator plots out ICT's New York midnight open price and a vertical divider at that time.
12am NY time is a key level to watch for daytrading and intraday scalping, often providing entry levels and orderblocks.
The session time may need to be adjusted for different exchanges, but the default is for most of forex.
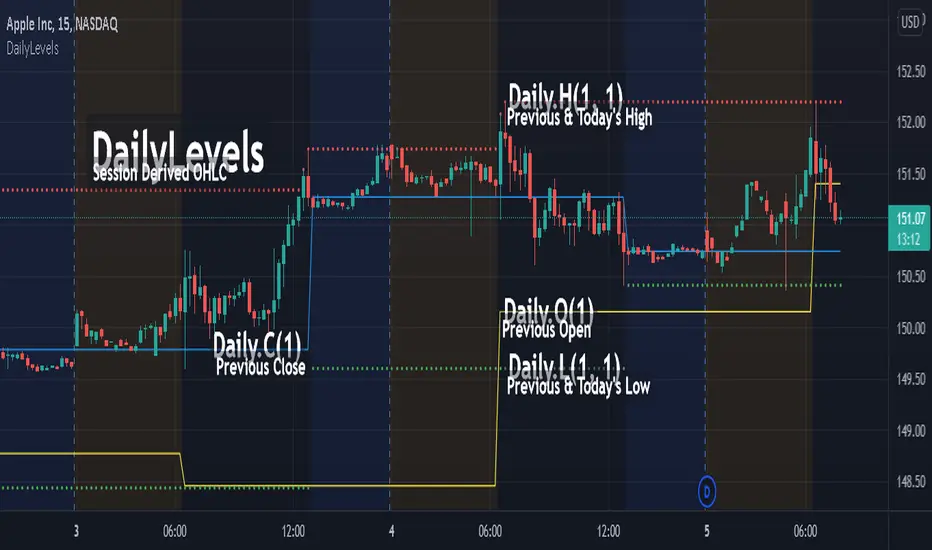
DailyLevelsLibrary "DailyLevels"
Functions for acquiring daily timeframe data by number of prior days.
openD(daysPrior, spec, res) Gets the open for the number of days prior.
Parameters:
daysPrior : Number of days back to get the open from.
spec : session.regular (default), session.extended or other time spec.
res : The resolution (default = '1440').
Returns: The open for the number of days prior.
highD(daysPrior, extraForward, spec, res) Gets the highest value for the number of days prior.
Parameters:
daysPrior : Number of days back to get the high from.
extraForward : Number of extra days forward to include.
spec : session.regular (default), session.extended or other time spec.
res : The resolution (default = '1440').
Returns: The high for the number of days prior.
lowD(daysPrior, extraForward, spec, res) Gets the lowest value for the number of days prior.
Parameters:
daysPrior : Number of days back to get the low from.
extraForward : Number of extra days forward to include.
spec : session.regular (default), session.extended or other time spec.
res : The resolution (default = '1440').
Returns: The low for the number of days prior.
closeD(daysPrior, spec, res) Gets the close for the number of days prior.
Parameters:
daysPrior : Number of days back to get the open from. 0 produces the current close
spec : session.regular (default), session.extended or other time spec.
res : The resolution (default = '1440').
Returns: The close for the number of days prior.
hlc3D(daysPrior, extraForward, spec, res) Gets the HLC3 value for the number of days prior.
Parameters:
daysPrior : Number of days back to get the HLC3 from.
extraForward : Number of extra days forward to include. Determines the closing value.
spec : session.regular (default), session.extended or other time spec.
res : The resolution (default = '1440').
Returns: The HLC3 for the number of days prior.
Market Sessions Open/Close LevelsThis indicator displays the market open and close price levels for the main trading sessions (Sydney, Tokyo, Frankfurt, London and New York). The Daily Line changes color depending on if price is trading above or below the level. Feel free to add or replace levels depending on your trading style and trading times.

OHLC - H.D.W.MThis indicatos plots Open and Close of the Curernt and Previous Day, Week or Month. It also shows the Highs and Lows of the Hourly, Daily, Weekly and Monthly Timeframes.

Daily lines (UTC)This is a simple script to add highlighted lines on the daily open.
It uses UTC as timezone.

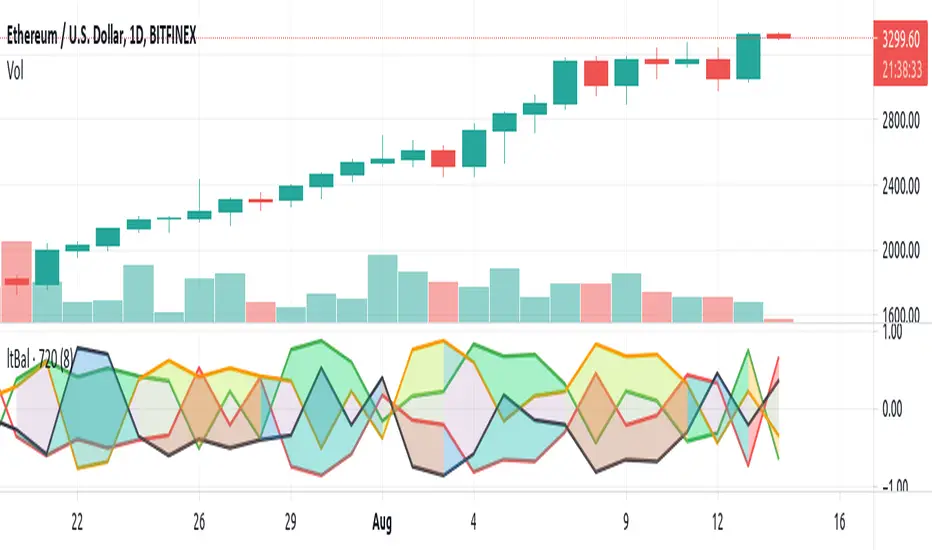
Light BalanceThe script is simple, going for a color scheme logic which tenderly avoids rigorous signals processing.
For the script to remain simple, logical derivatives are also out; as such, there are no secondary relations built off of primary ones. And it also ignores (unless you do this yourself) the logic in a varying order of lines.
Coloring has been done according to a limited set of relations between the four (4) plotted lines.
Quite a bit of information is capture, as you'll see when looking at line order, crossings, and transparency transitions and their patterns.
The approach makes the relations ones which can be learned over time; you become the algorithm to sort out signals. Ha ha. I know that sounds like a cop out doesn't it. Did I mention it's a simple script?
One thing you might want to play with right away are fills having red and green, and lime and fuchsia. It would be cool to reduce it all down to two (2) colors, but all the boolean relations might have to be listed, and it also may not be possible to cumulatively combine transparency overlays of the same value. Visually, that approach may not result to awaken a useful feature anyway. Also, fill() has its limitations in that it cannot be in a local scope; this includes function wrapped calls to fill(), or calls made using branching logic statements if/elseif, iff(), and var = (cond) ? t_val/exp : f_val/exp. So, to my knowledge, a fill() can not be made to be logically on/off.
Please, enjoy getting some use out of it.
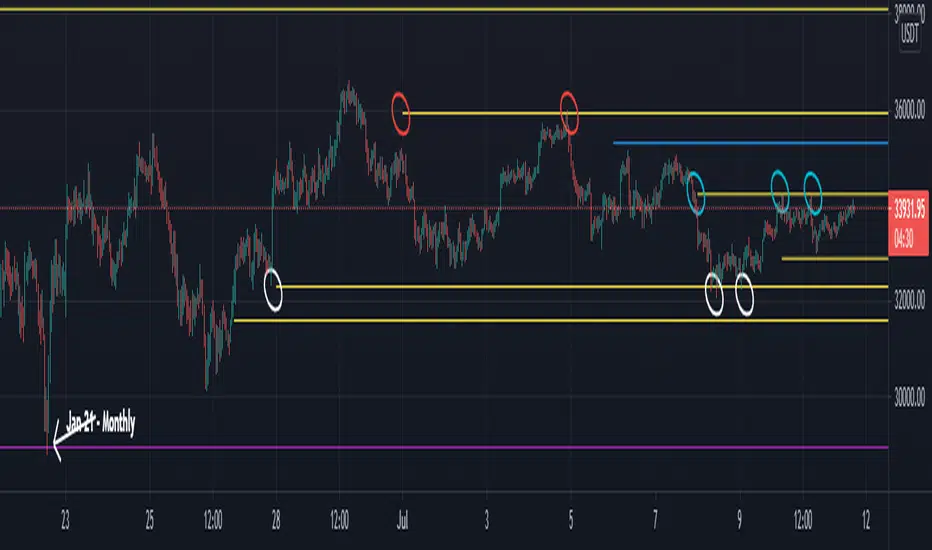
MTF Key Levels - Support and ResistanceThis indicator shows how to Multi Time Frame (MTF) interpret levels:
Watch how price acts around these levels and how they can act as support/resistance and can be used as great confluence levels for your technical analysis.
This indicator displays:
VWAP Levels
Daily / Weekly / Monthly / Yearly
Within the chart above I have marked out how displaying these VWAP levels can provide support and resistance levels to be aware of.
Daily – Weekly - Monthly – Yearly Levels
O = Open / H = High / L = Low
pO = Previous Open / pH = Previous High / pL = Previous Low / pEQ = Previous Equlibrium
Having previous Low/High levels makes you aware of Swing Failure Patterns (SFP). Also the daily/weekly/monthly opening and previous opening can assist with the trend.
Daily Open: Gives you an idea who is in control for the day. This level very often acts as strong support or resistance.
Weekly Open: Indicates where the price is within the higher timeframe.
Monthly Open & Yearly Levels: Overview of direction for the whole month without looking at a monthly chart and Yearly chart
Line Options
Within the line options you can choose to have a clean chart and display a “short line”. These line length can be adjusted by the user.
Line just to the right.
Line across the screen.
Disclaimer: The Monthly and Yealy VWAP will only show on higher timeframes this is due to restriction of how many candles can be shown on the chart. The candles displayed need to go back to either the start of the month of year to be able to calculate their VWAPs.

Next Session OpenThis script simply displays the next market open time with a vertical line.
Market open may be subject to special treatment as a trader (higher volatility, different move aspects, etc)
To make it possible to adjust to your trading style, this script allows you to configure:
Session open hours in UTC
Vertical line colors
Enable or disable lines
The line style
Daily Open Horizontal LineThis script draws a horizontal line that starts in the daily open (00:00 UTC)
Basically I did this since lots of times price come back down/up to the daily open and then bounces, meaning we can take trades based on this.
Hope you enjoy it.
PD: Took the code from infernix, all the credits to him, I know shit about coding.
Infernix TDV Profile: tradingview.com/u/infernixx
Naked - Daily Weekly MonthlyUser request for Naked Daily Weekly Monthly Opens.
This indicator plots the Daily Weekly Opens (the day after day after creation), they then will stay on the chart until a candle close is completed on the other side of the plot.
In the above chart picture you can see how previous monthly and daily opens have acted as support and resistance.
Thanks go to:
StackOverFlow Bjorn Mistiaen
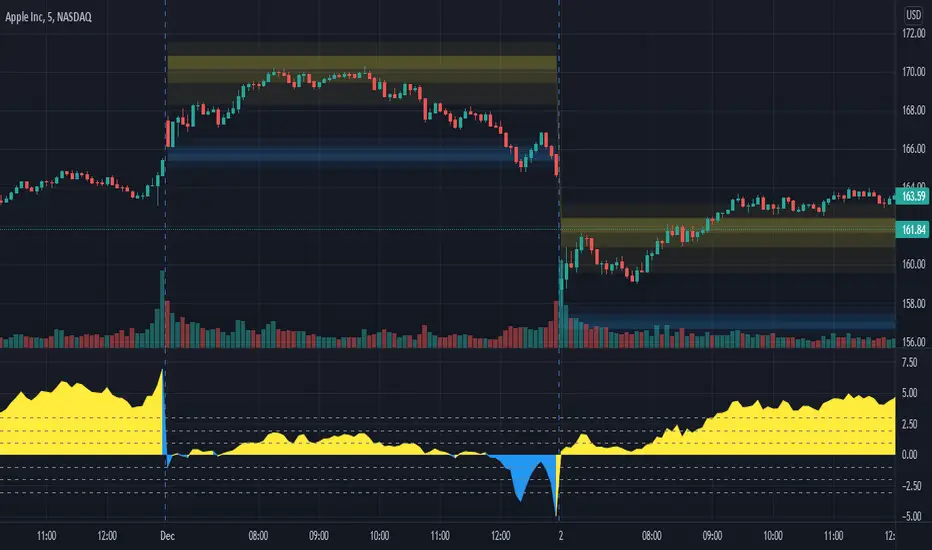
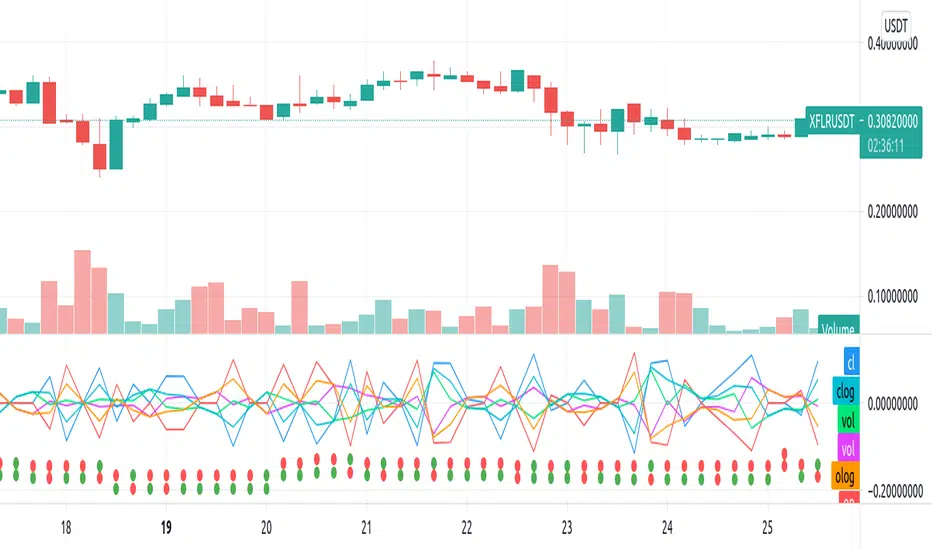
Repulsion: Price & Volume 1Repulsion: Price & Volume 1
www.quantamagazine.org
Proof of concept using the above link and comparisons of price and volume, and one of a series stemming from the so-called Repulsion Engine, now also open sourced, and other indicators from the workbench.
Traffic lights are not accurate.
Like it if you use it, drop a line if you update it -- or if you have comments about how to improve it.
Open Close Cross Strategy plus ExplorerOpen Close Cross Strategy plus Explorer
V 1.0
There is a code that can control sensitivity. try to change 'ATR Multiplier' menu
There is a code for prevent 'repaint'. If you want it check 'Forces Non-Repainting' menu
thanks to
PMax Explorer STRATEGY & SCREENER KivancOzbilgic
Open Close Cross Strategy R5 revised by JustUncleL JustUncleL
