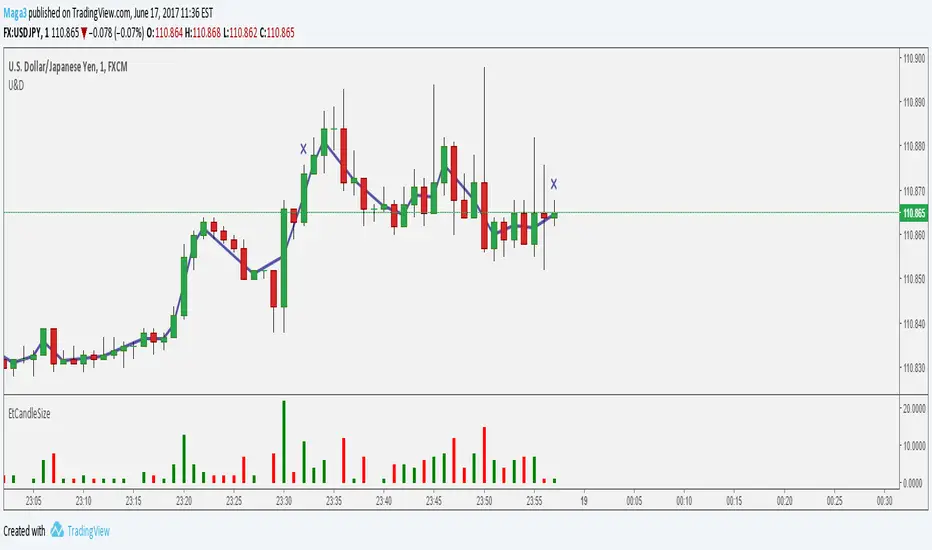
OC indicatorIndicator to show previous open and close of a certain time frame.
Available timeframe :
H1
H4
Daily
Weekly
Monthly
You can disable previous option to show actual data but result will be 'weird' as it works on futur data (non closed candles).
When plotted, circle show open and cross show close. Color dependson the TF.
Buka


Opening Range Breakout - ORBThe opening range is simply the high and low of a given period after the market opens. This period is generally the first 30 minutes or the first hour of trading.
During this period, you want to identify the high and low of the day. In addition, you will also want to account for the pre-market highs and lows, as these levels will often act like a magnet on price action after the bell rings.
Since the opening bell is associated with big trading volumes and volatility, this time of the session provides many trading opportunities. In this manner, traders use the opening range to set entry points on the chart and to forecast the price action for the day.

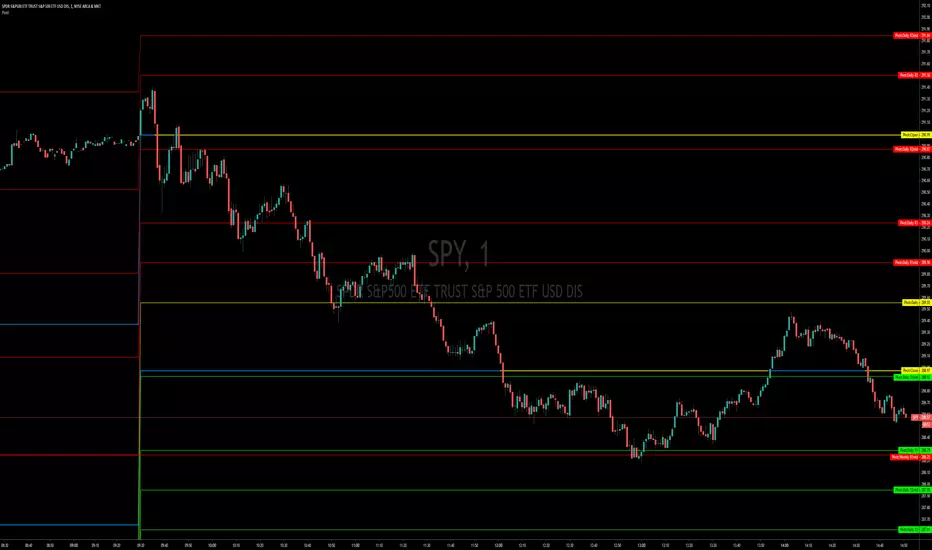
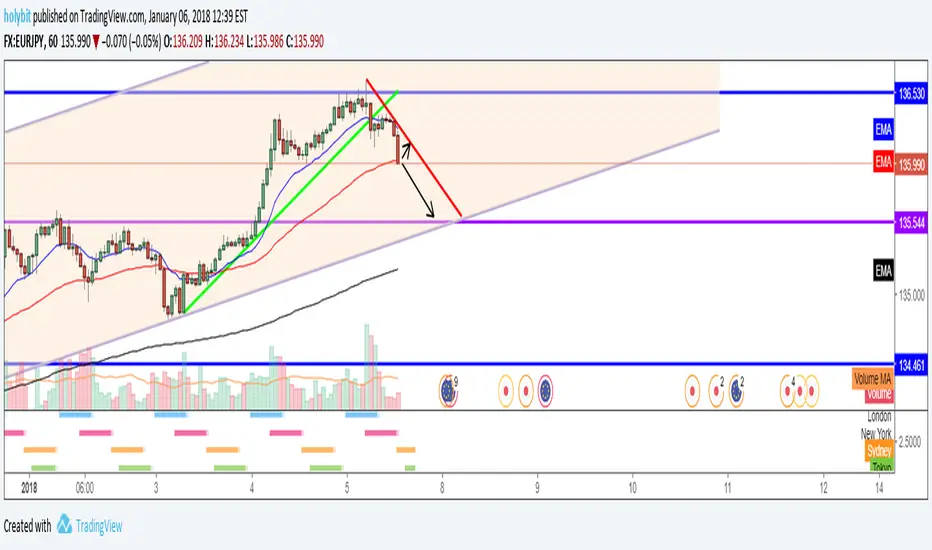
Pivot Points, Daily, Weekly, Open and Close lines What is a Pivot Point?
A pivot point is a technical analysis indicator, or calculations, used to determine the overall trend of the market over different time frames. The pivot point itself is simply the average of the high, low and closing prices from the previous trading day. On the subsequent day, trading above the pivot point is thought to indicate ongoing bullish sentiment, while trading below the pivot point indicates bearish sentiment.
The pivot point is the basis for the indicator, but it also includes other support and resistance levels that are projected based on the pivot point calculation. All these levels help traders see where the price could experience support or resistance. Similarly, if the price moves through these levels it lets the trader know the price is trending in that direction.
When the price of an asset is trading above the pivot point, it indicates the day is bullish or positive.
When the price of an asset is trading below the pivot point, it indicates the day is bearish or negative.
The indicator typically includes four additional levels: S1, S2, R1, and R2. These stand for support one and two, and resistance one and two.
Support and resistance one and two may cause reversals, but they may also be used to confirm the trend. For example, if the price is falling and moves below S1, it helps confirm the downtrend and indicate a possible continuation to S2.
This Script includes the Mid Pivot Points, Open and Close levels
Year Open Price LevelAn utility tool that plots a dynamic level using the opening price of each year on the chart.
Allows to highlight the change in the price relative to this level.


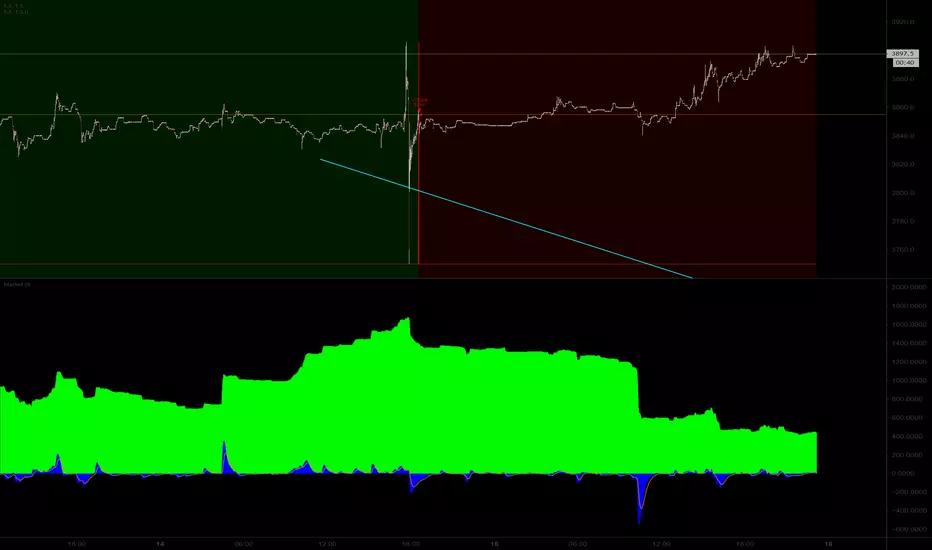
CryptoManic: Bitfinex Open interest LongsThis is the last indicator that I am publishing maybe for a looong time.
There are few similar indicators even open source out there.
This reads two indices from bitfinex, long and short of BTCUSD (default). then calculates the main Open Interest from the data.
Why did I closed the source? lets just say the open source versions, are a liiiitle wrong in their calculations !
Remember, this works On ANY exchange or broker that provides long/short indices for an instrument (you need both long and short from same broker / exchange).
But the access is public, use it and have fun.
The blue histogram is one of my personal momentum calculations for the open interest. Not sure if it can be used on anything but it's there.
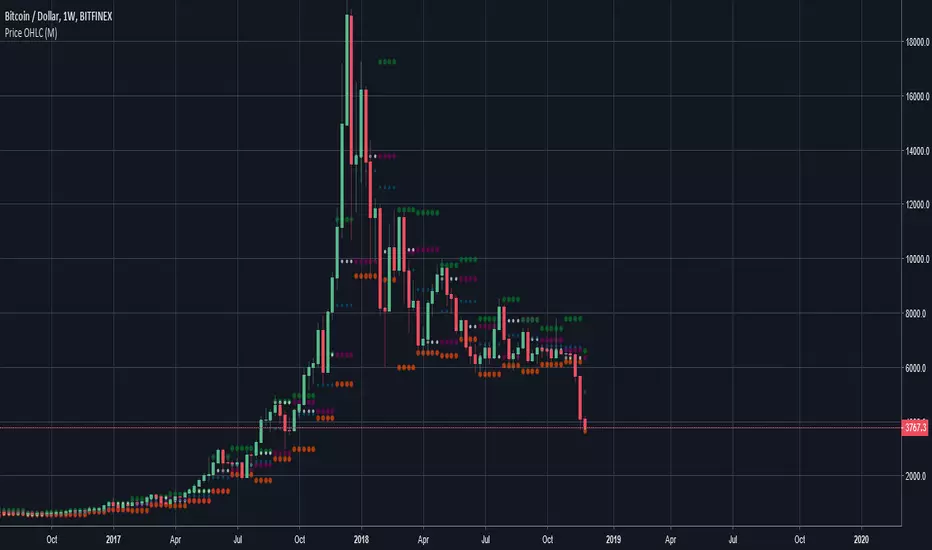
Range: OHLC vs Previous OHLCThis will plot your choice of OHLC (or any of the averaging choices) of the current candle compared to the previous candle.
For example if you choose "high" for the input and set the chart to daily, you'll see the currently daily high vs the previous daily high.
Green candle represent a higher high and the length of the candle represents how much higher.
Red candles represent a lower high than the previous day and the length is by how much lower.
This indicator is pretty straight forward, look for me to build on this with something a little more elaborate in the near future.

Bitfinex Sentiment Index [Long-Short]BSI provides two attractive graphs that breakdown the long (green area) and short (red area) positions ratio for the all Bitfinex margin cryptocurrency pairs only .
It is a quantitative measure of the bullishness or bearishness that can be used as a trading rule or in a trading system entries or exits. Included slow stochastic oscillator.


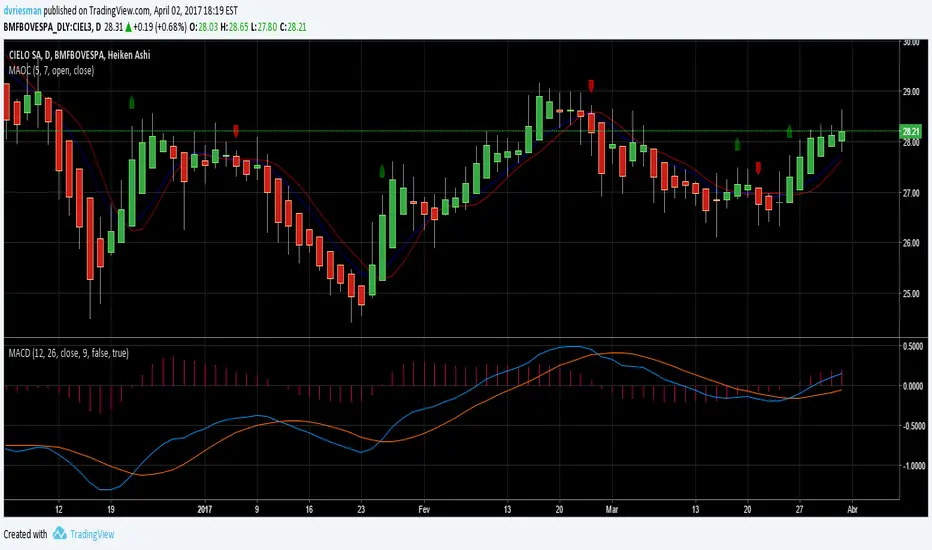
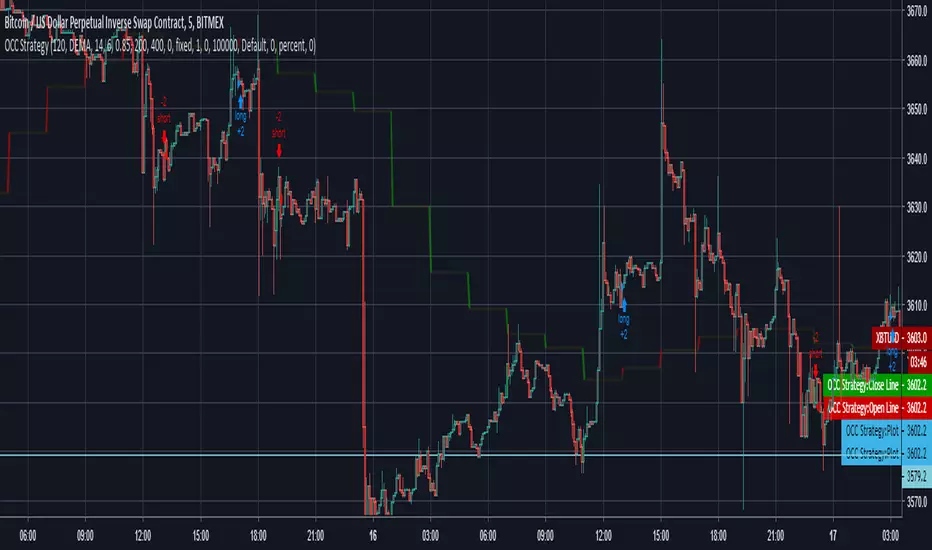
Open Close Cross Strategy // Real Back Test // Not goodI changed close series because, close series doing repaint.
I changed the near series with the previous open series .
but can use for sup and resistance
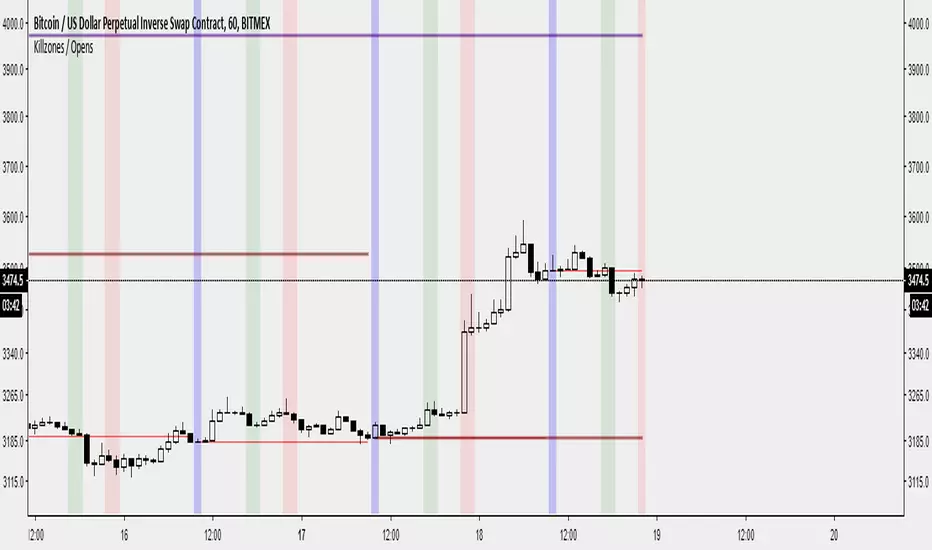
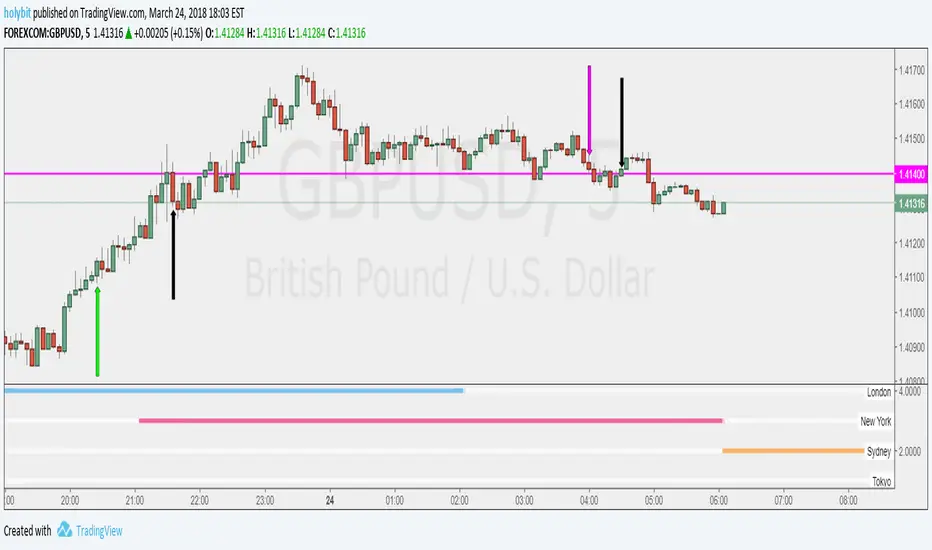
Killzones / Daily Open / Weekly Open / Monthly Open by @bartbtcI've created an indicator that :
- Displays the previous day's, week's, month's open on the current period's price action.
- Displays a vertical bar at the daily open. (The first 30-60 minutes from the daily open is commonly where the high/low of the day is made)
- Displays London/NY opens as vertical bars (london close is an option, but I have disabled it by default. I have removed Asia as I believe it is not useful - deal with it!)
Features:
- Displays daily data/killzones only on timeframes lower than 60minutes (you can modify this in the settings as you wish)
- Displays weekly open only on timeframes lower than weekly
- Displays monthly open only on timeframes lower than monthly
Let me know on Twitter on @bartbtc if there's any issues or if you have any other features you think might be useful.
MWD_XO_OPENSCreated by TraderX0 & Stingray
Helps you plot the Monthly, Weekly, and Daily Opens quickly on your chart; Open the options menu to adjust colors and toggle time-frames(M/W/D) on/off.

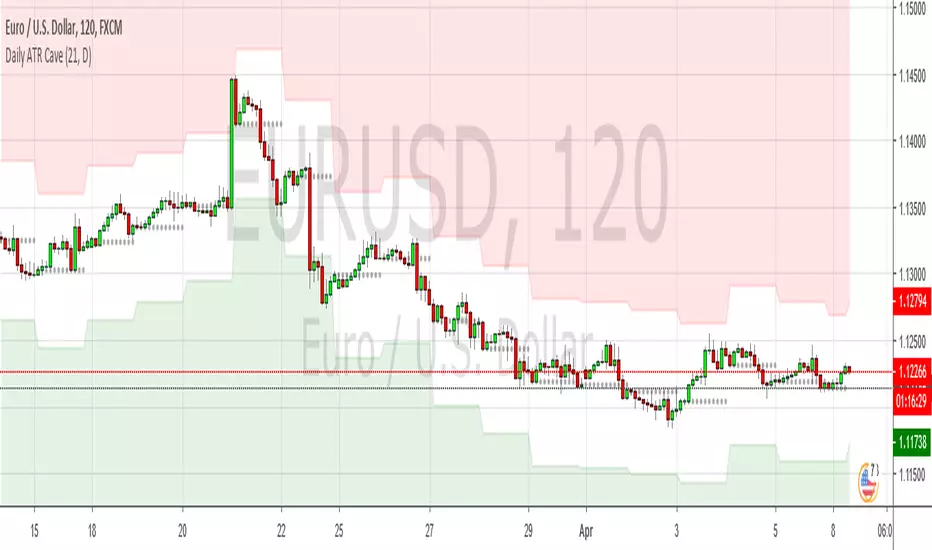
Daily ATR CaveSimilar to the RSI Cave idea, this plots daily Average True Range values on lower timeframes, as well as the daily open level, which is show as a grey dotted line. Basically a simple way to visualise basic mean reversion stuff
Price Open/High/Low/CloseAnother indicator that shows Open, High, Low, Close on multiple timeframes.
It can be used to discover possible support/resistance areas on lower timeframes.
Other indicators may do the same thing but just added some custom timeframes
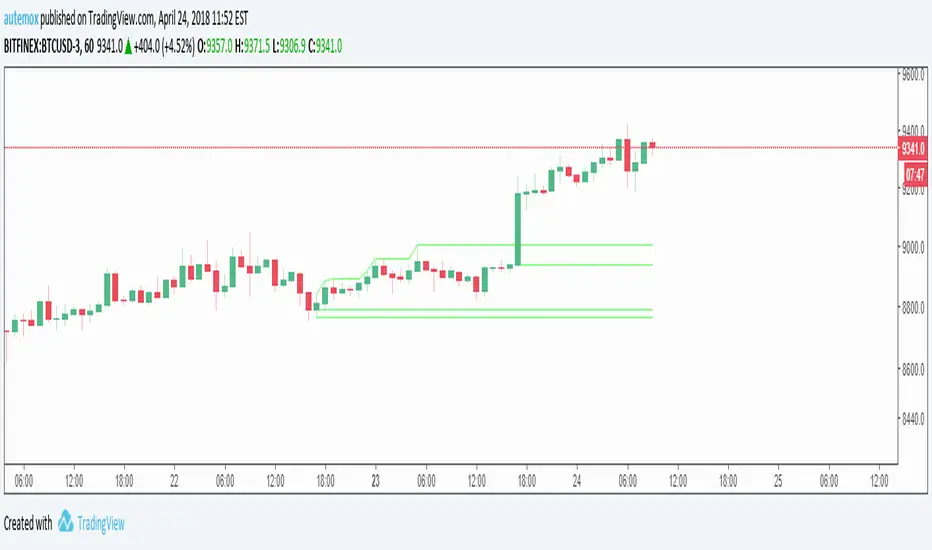
Yesterday Line: Lines at Yesterday's Open, Close, High, and Lowcreated by AutemOx
twitter: @joyrider5
reddit: /u/joyrider5
This creates lines at yesterdays open, close, high, and low. It is pretty amazing use of the timenow and dayofweek variables if I say so myself 8)
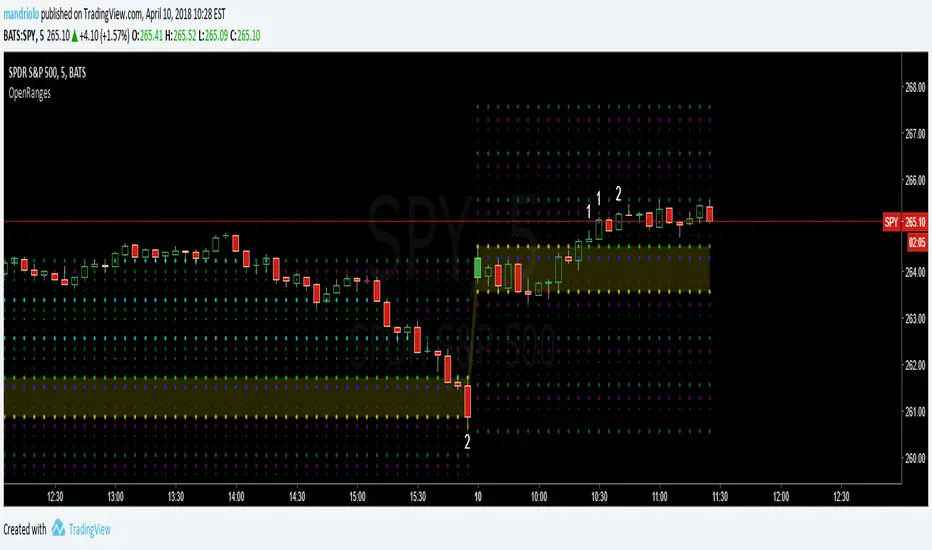
Opening-RangesThis indicator will give you expansion levels of the opening range ( I recommend/use 15 min opening range) to trade futures and stocks. There are two colors used, the Fuchsia(Magenta) colored dots are the opening range added and subtracted from opening price. The Aqua(Cyan) colored dots are the opening range stacked. Like blocks. They are both respected during the day. But not as much as longer time frame fib levels.
Market Hours PSTI modified following script for PST time users.
And also, it has only major 4 time zones (London/NewYork/Sydney/Tokyo), and supports 4H/1H/30M/15M/5M scales.
Gazzaahh~ TechFXC :-b
Previous Daily Open/High/Low/CloseThis indicator plots the previous day's open, high, low and close levels on the chart
Published by Luke (DisciplinedTrader.co.uk)

MTF Previous Open/Close/RangeThis indicator will simply plot on your chart the Daily/Weekly/Monthly previous candle levels.
The "Auto" mode will allow automatic adjustment of timeframe displayed according to your chart.
Otherwise you can select manually.
Indicator plots the open/close and colors the high-low range area in the background.
Hope this simple indicator will help you !
You can check my indicators via my TradingView's Profile : @PRO_Indicators