Dynamic Pivot Point [MarkitTick]Title: Dynamic Pivot Point MarkitTick
Concept
Unlike traditional Pivot Points, which plot static horizontal levels based on the previous period's High, Low, and Close, this script introduces a dynamic element by applying an Exponential Moving Average (EMA) to the calculated pivot levels. This approach allows the Support and Resistance zones to adapt more fluidly to recent price action, reducing the jagged steps often seen in standard multi-timeframe pivot indicators.
How It Works
The script operates in two distinct phases of calculation:
1. Data Extraction and Core Math:
The indicator first requests the High, Low, and Close data from a user-defined timeframe (e.g., Daily, Weekly). Using this data, it calculates the standard Pivot Point (P) alongside three levels of Support (S1, S2, S3) and three levels of Resistance (R1, R2, R3) using standard geometric formulas:
Pivot = (High + Low + Close) / 3
R1 = 2 * Pivot - Low
S1 = 2 * Pivot - High
(Subsequent levels follow standard Floor Pivot logic).
2. Dynamic Smoothing:
Instead of plotting these raw values directly, the script processes each calculated level (P, S1-S3, R1-R3) through an Exponential Moving Average (EMA). The length of this EMA is controlled by the Pivot Length input. This smoothing process filters out minor volatility and creates curved, dynamic trajectories for the pivot levels rather than static straight lines.
How to Use
Traders can use this tool to identify dynamic areas of interest where price may react.
The White Line represents the Central Pivot. Price action relative to this line helps determine the immediate bias (above for bullish, below for bearish).
Green Lines (Support 1, 2, 3) indicate potential demand zones where price may bounce during a downtrend.
Red Lines (Resistance 1, 2, 3) indicate potential supply zones where price may reject during an uptrend.
Because the levels are smoothed, they can also act as dynamic trend followers, similar to moving averages, but derived from pivot geometry.
Settings
Show Pivot Points: Toggles the visibility of the plot lines on the chart.
Pivot Length: Defines the lookback period for the EMA smoothing applied to the pivot levels. A higher number results in smoother, slower-reacting lines.
Timeframe: Determines the timeframe used for the underlying High/Low/Close data (e.g., selecting "D" calculates pivots based on Daily data while viewing a lower timeframe chart).
Disclaimer This tool is for educational and technical analysis purposes only. Breakouts can fail (fake-outs), and past geometric patterns do not guarantee future price action. Always manage risk and use this tool in conjunction with other forms of analysis.
Penunjuk dan strategi

GK Zero-Lag Major BOS TrendGK ZERO-LAG Major BOS Trend
is a technical indicator designed to highlight breaks of structure BOS
in the direction of the prevailing trend
The script uses a zero-lag trend filter combined with confirmed structural high/low breaks to reduce noise and avoid minor or premature prints.
Print labels are only printed after candle close, ensuring stable, and confirmed prints
The indicator is designed to help traders identify trend continuation and structural shifts,
making it suitable as a confirmed tool across multiple markets and timeframes.
Best used on higher timeframes 5/15/30Min 2/3/4Hour
also resistance and support lines
Disclaimer
this indicator is provided for educational purposes only

Z-Score & StatsThis is an advanced indicator that measures price deviation from its mean using statistical z-scores, combined with multiple analytical features for trading signals.
Core Functionality-
Z-Score Calculation Engine:
The indicator uses a custom standardization function that calculates how many standard deviations the current price is from its rolling mean. Unlike simple moving averages, this provides a normalized view of price extremes. The calculation maintains a sliding window of data points, efficiently updating mean and variance values as new data arrives while removing old data points. This approach handles missing values gracefully and uses sample variance (rather than population variance) for more accurate statistical measurements.
Statistical Zones & Visual Framework:
The indicator creates a visual representation of statistical probability zones:
±1 Standard Deviation: Encompasses about 68% of normal price behavior (green zone)
±2 Standard Deviations: Covers approximately 95% of price movements (orange zone)
±3 Standard Deviations: Represents 99.7% probability range (red zone)
±3.5 and ±4 Thresholds: Extreme outlier levels that trigger special alerts
The z-score line changes color dynamically based on which zone it occupies, making it easy to identify the current market extremity at a glance.
Advanced Features:
Volume Contraction Analysis
The script monitors volume patterns to identify periods of reduced trading activity. It compares current volume against a moving average and flags when volume drops below a specified threshold (default 70%). Volume contraction often precedes significant price moves and is factored into the optimal entry detection system.
Momentum-Based Direction Model:
Rather than just showing current z-score levels, the indicator projects where the z-score is likely to move based on recent momentum. It calculates the rate of change in the z-score and extrapolates forward for a specified number of bars. This creates a directional arrow that indicates whether conditions are bullish (negative z-score with upward momentum) or bearish (positive z-score with downward momentum).
Divergence Detection System:
The script automatically identifies four types of divergences between price action and z-score behavior :-
Regular Bullish Divergence: Price makes lower lows while z-score makes higher lows, suggesting weakening downward pressure
Regular Bearish Divergence: Price makes higher highs while z-score makes lower highs, indicating exhaustion in the uptrend
Hidden Bullish Divergence: Price makes higher lows while z-score makes lower lows, confirming trend continuation in an uptrend
Hidden Bearish Divergence: Price makes lower highs while z-score makes higher highs, confirming downtrend continuation
The system uses pivot detection with configurable lookback periods and distance requirements, then draws connecting lines and labels directly on the chart when divergences occur.
Yearly Statistics Tracking:
The indicator maintains historical records of maximum z-score deviations over yearly periods (configurable bar count). This provides context by showing whether current extremes are unusual compared to typical annual ranges. The average yearly maximum helps traders understand if the current market is exhibiting normal volatility or exceptional conditions.
Mean Reversion Probability:
Based on the current z-score magnitude, the indicator calculates and displays the statistical probability that price will revert toward the mean. Higher absolute z-scores indicate stronger mean reversion probabilities, ranging from 38% at ±0.5 standard deviations to 99.7% at ±3 standard deviations.
Comprehensive Statistics Table:
A customizable on-chart table displays real-time statistics including:
Current z-score value with directional indicator
Predicted z-score based on momentum
Current year's maximum absolute z-score
Historical average yearly maximum
Mean reversion probability percentage
Zone status classification (Normal, Moderate, High, Extreme)
Directional bias (Bullish, Bearish, Neutral)
Active divergence status
Volume contraction status with ratio
Optimal setup detection (combining extreme z-scores with volume contraction)
Optimal Entry Setup Detection:
The most sophisticated feature identifies high-probability trading setups by combining multiple factors. An "Optimal Long" signal triggers when z-score reaches -3.5 or below AND volume is contracted. An "Optimal Short" signal appears when z-score exceeds +3.5 AND volume is contracted. This combination suggests extreme price deviation occurring on low volume, often preceding strong reversals.
Alert System:
The script includes a unified alert mechanism that triggers when z-score crosses specific thresholds:
Crossing above/below ±3.5 standard deviations (extreme levels)
Crossing above/below ±4 standard deviations (critical levels)
Alerts fire once per bar with confirmation (previous bar must be on opposite side of threshold) to avoid false signals.
Practical Application:
This indicator is designed for mean reversion traders who seek statistically significant price extremes. The combination of z-score measurement, volume analysis, momentum projection, and divergence detection creates a multi-layered confirmation system. Traders can use extreme z-scores as potential reversal zones, while the direction model and divergence signals help time entries more precisely. The volume contraction filter adds an additional layer of confluence, identifying moments when reduced participation may precede explosive moves back toward the mean.
Chart Attached: NSE GMR Airports, EoD 12/12/25
DISCLAIMER: This information is provided for educational purposes only and should not be considered financial, investment, or trading advice.Happy Trading

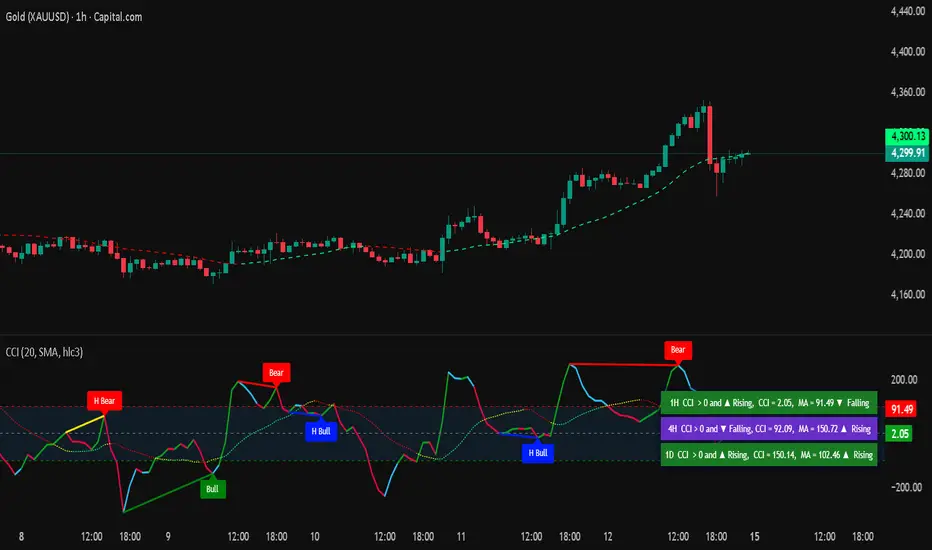
Commodity Channel IndexThe Commodity Channel Index (CCI) is a technical indicator that measures the strength of the momentum in the market, it is calculated using a Moving average (default 20 SMA, users can change the legth and the type of the MA from dashboard) using formula: cci = (src - ma) / (0.015 * ta.dev(src, ccilength)).
When CCI is under -100 that indicates a strong downtrend, and above +100 level a strong uptrend, above 0 level a bullish trend start and bellow 0 level bearish momentum.
Crossing back above -100 and bellow + 100 levels not means it is a reversal of the trend, could be just a pullback or a bounce before trend continuation.
The indicator display on the main chart a color coded moving average with the length and type selected by users for CCI calculation.
The CCI Moving average and the CCI lines in oscillator are both color coded :
1. CCI and MA both red = > Bearish trend
2. CCI and MA both green = > Bullish trend
3. MA color turn yellow or the CCI turn blue that means a possible consolidation will be next or trend change.
4 type of Divergences are detected by the script Bullish, Bearish, Hidden Bullish and Hidden bearish divergences, users can setup alarms for them, by default the divergences ae not displayed, users need to select them to be displayed on the oscillator.
A table displaying the vurrent timeframe and 2 higher timeframes of the stats of CCI and its MA.
There are 13 alerts that users can setup akarms:
Alert for Regular Bullish Divergence
Alert for Hidden Bullish Divergence
Alert for Regular Bearish Divergence
Alert for Hidden Bearish Divergence
Alert for CCI Back Above -100
Alert for CCI Back Bellow 100
Alert for CCI Extreme Overbought
Alert for CCI Extreme Oversold
Alert for trend change by CCI MA => Moving Average Color turned to yellow, that means sideways or possible trend change
Alert for CCI Crossing Above CCI MA
Alert for CCI Crossing Bellow CCI MA
Alert for cci Crossing Above 0
Alert for CCI Crossing Bellow 0
QQQ Overlay on NQ/NDX by @DashingBixbyEnhanced version of PtGambler's for drawing QQQ levels over NQ/NDX.

Day Trading MA Crossover IndicatorDay Trading MA Crossover Indicator Overview The Day Trading MA Crossover Indicator is a simple yet effective tool designed for day traders to identify potential buy and sell opportunities based on moving average crossovers. It plots two customizable moving averages on your chart and generates clear visual signals when they cross, helping you spot trend reversals or continuations in fast-paced markets.This indicator is ideal for intraday trading on lower timeframes (e.g., 5-min, 15-min charts) but can be adapted for swing trading or higher timeframes. It's built with flexibility in mind, allowing you to tweak the MA lengths and types to suit your strategy.Key FeaturesMoving Average Crossovers: Generates "BUY" signals when the fast MA crosses above the slow MA (potential bullish entry) and "SELL" signals when it crosses below (potential bearish entry or exit).
Visual Signals: Green "BUY" labels below bars for long entries and red "SELL" labels above bars for short entries or exits. Optional subtle background coloring highlights signals for quick spotting.
Customizable Parameters:Fast MA Length (default: 9): Period for the shorter moving average.
Slow MA Length (default: 21): Period for the longer moving average.
MA Type (default: EMA): Choose between SMA (Simple), EMA (Exponential), or WMA (Weighted) for different smoothing behaviors.
Overlay Mode: Plots directly on your price chart without cluttering separate panes.
Lightweight and Efficient: Minimal computation for real-time performance on TradingView.
How It WorksMoving Averages Calculation: The indicator computes two MAs based on your selected type and lengths using closing prices.
Signal Detection: A buy signal triggers on an upward crossover (fast MA > slow MA), indicating potential momentum shift to the upside. A sell signal triggers on a downward crossunder (fast MA < slow MA), signaling possible downside momentum.
Visual Aids: Signals appear as labeled shapes with optional background tints to emphasize key bars.
Usage TipsFor Day Trading: Apply on volatile instruments like forex pairs, stocks, or crypto. Combine with support/resistance levels or other indicators (e.g., RSI for overbought/oversold confirmation) to filter false signals in ranging markets.
Backtesting: Test on historical data to optimize MA lengths for your asset—shorter periods for aggressive trading, longer for smoother trends.
Risk Management: Always use stop-losses and position sizing. Signals are not foolproof and work best in trending conditions.
Customization: Adjust inputs via the indicator settings panel after adding it to your chart.
Example SetupOn a 5-min EUR/USD chart: Use EMA (9/21) for quick crossovers. Look for buy signals above key support with increasing volume.
Avoid choppy markets where frequent false crossovers ("whipsaws") can occur.
This indicator is provided for educational and informational purposes only. It is not financial advice, and past performance does not guarantee future results. Trading involves risk; consult a professional advisor before using any strategy. If you have feedback or suggestions for improvements, feel free to comment!

TRV & nTRV - Trimmed Range VolatilityGrid bots require stable volatility measurement - ATR becomes misleading when gaps and sudden spikes distort the average. TRV (Trimmed Range Volatility) is an advanced version of ATR: it filters outliers at the extremes (highest and lowest ranges) and remains unaffected by gaps. This provides real-time, accurate volatility measurement for grid bot setup.Grid bots require stable volatility measurement - ATR becomes misleading when gaps and sudden spikes distort the average. TRV (Trimmed Range Volatility) is an advanced version of ATR: it filters outliers at the extremes (highest and lowest ranges) and remains unaffected by gaps. This provides real-time, accurate volatility measurement for grid bot setup.
Why We Developed TRV?
When a gap or sudden spike occurs in the morning, this extreme movement affects standard ATR calculations for an extended period. Even if the price moves sideways for the rest of the day, ATR remains elevated. This causes grid bots to operate with unnecessarily wide spacing and execute fewer trades.
TRV Advantages:
✅ Unaffected by Gaps: Opening gaps don't distort the calculation
✅ Extreme Point Elimination: Filters the largest and smallest outlier candles
✅ Real-Time Accuracy: Shows current market volatility
✅ Grid Bot Optimization: Enables tighter and more efficient grid spacing
✅ Comparison Capability: Compare different stocks and timeframes with nTRV
Grid Bot Usage:
The TRV value is used directly to calculate the number of grid lines:
(Resistance - Support) / TRV = Number of Grid Lines
Example:
Resistance: $110
Support: $90
TRV: $2
Grid Count: (110-90)/2 = 10 grid lines
Features:
Two Filtering Modes: Manual (enter number) or Percentage-Based (automatic ratio)
Four Indicators in One: nTRV, TRV, ATR, and nATR all displayed on the same panel
nTRV: Normalized value (percentage-based, for stock comparison)
TRV: Absolute value (currency-based, for grid calculation)
ATR & nATR Included: Standard ATR and nATR for direct comparison with TRV
Comprehensive Analysis: Compare filtered (TRV) vs unfiltered (ATR) volatility side-by-side
Default: 10% top, 10% bottom outlier elimination
Conclusion:
TRV is an advanced version of ATR specifically designed for grid bot traders. By filtering outlier movements, it provides more stable and reliable volatility measurement. The indicator includes both TRV (filtered) and ATR (unfiltered) on the same chart, giving traders a comprehensive view to make informed decisions. This dual-display approach enables more efficient grid strategies and increased trading frequency.

Pre-Market Gap %Helps identify Pre Market Gap %. If Blue line is above the green dotted line, this indicates the stock is gapping up as its >1%. If the Blue line is below the dotted Red then this indicates the stock will gap down on open.

Liquidity Sentiment Profile | LUPENIndicator Guide: Liquidity Sentiment Profile (LSP).
What is the LSP?
The Liquidity Sentiment Profile (LSP) is a "Next-Generation" oscillator designed to look beyond simple price action. While standard indicators (like RSI or MACD) primarily focus on where a candle closes, the LSP analyzes the micro-structure of the entire candle—specifically the relationship between the candle's Body, its Wicks (Shadows), and the Volume.
The Core Philosophy:
Wicks tell the truth: A long lower wick indicates that sellers pushed the price down, but buyers aggressively absorbed that liquidity and pushed it back up.
That is hidden bullish strength.
Volume validates intent: A price move with low volume is noise. A price move (or wick rejection) with high volume is a commitment by institutional players.
The LSP calculates a "Sentiment Score" between -100 and +100 based on these factors.
How to Read the Visuals
The Colors (Intensity)
color: Light Green - Bullish Acceleration. Buyers are in control, and momentum is increasing. This is the ideal time to be in a Long trade.
color: Dark Green - Bullish Deceleration. Buyers are still in control (price is likely rising), but the momentum is fading. This is a warning sign to tighten stop-losses or take profits.
color: Light Red - Bearish Acceleration. Sellers are dominating, and panic is increasing. This is the ideal time to be Short.
color: Dark Red - Bearish Deceleration. Sellers are still in control, but the downward pressure is exhausted. Be careful with new short positions.
The Lines & Fills
The Main Line: The actual LSP sentiment value.
The Yellow Signal Line: A smoothed average of the sentiment.
The Core Fill: The colored area between the Main Line and the Signal Line. When this area "glows", the trend is strong. When it dims (Dark), the trend is weak. Bearish Deceleration. Sellers are still in control, but the downward pressure is exhausted. Be careful with new short positions.
The Lines & Fills
The Main Line: The actual LSP sentiment value.
The Yellow Signal Line: A smoothed average of the sentiment.
The Core Fill: The colored area between the Main Line and the Signal Line. When this area "glows" (Neon), the trend is strong. When it dims (Dark), the trend is weak.
How to Use It (Trading Strategies)
Strategy A: The "Power Cross" (Trend Entry)
Use this for entering trends when the market wakes up.
Long Entry: Wait for the LSP line to cross ABOVE the Yellow Signal Line.
Confirmation: The fill color must turn Neon Green.
Short Entry: Wait for the LSP line to cross BELOW the Yellow Signal Line.
Confirmation: The fill color must turn Neon Red.
Strategy B: The "Absorption" Play (Reversals)
This is where the LSP shines. It detects when liquidity is being absorbed before price turns.
Bullish Absorption: The Price makes a Lower Low, but the LSP makes a Higher Low. This happens because the LSP detects the Volume on the Lower Wicks (buyers absorbing selling pressure). This is a high-probability reversal signal.
Bearish Absorption: The Price makes a Higher High, but the LSP makes a Lower High. The volume on the Upper Wicks suggests sellers are absorbing the buy orders.
Strategy C: The "Dimming" Exit (Risk Management)
Don't wait for the price to crash to exit a trade.
If you are in a Long trade (Neon Green) and the color instantly shifts to Dark Green, it means the "fuel" is running out. Consider taking partial profits or moving your Stop Loss to break even.
Standard oscillators (like RSI) often give false signals during strong trends (showing "Overbought" while price keeps going up). The LSP avoids this because it weights Volume and Wicks. If price goes up and volume increases, the LSP stays Neon Green, telling you the move is genuine, not just overextended.

Absorption BubblesSUMMARY
This indicator visualizes absorption events by plotting bubbles on candle wicks where volume activity suggests one side of the market is absorbing the other’s pressure. Instead of raw volume, the script normalizes activity against a rolling standard deviation defined by the Lookback Period. Bubbles appear on upper or lower wicks depending on whether buyers or sellers are absorbing pressure. The goal is to highlight whether aggressive orders are being accepted or absorbed at key price points.
METHODOLOGY
Absorption occurs when one side of the market absorbs aggressive orders from the other, preventing continuation. The script measures normalized volume against a user‑defined threshold to filter out weaker signals.
Green bubbles on upper wicks → Selling absorption (buyers push price up, sellers absorb the buying).
Red bubbles on lower wicks → Buying absorption (sellers push price down, buyers absorb the selling).
Red‑colored bars highlight candles where large volume is concentrated inside the body, signifying aggressive selling activity.
Green‑colored bars highlight candles where large volume is concentrated inside the body, signifying aggressive buying activity.
The Lookback Period controls how many bars are used to calculate the rolling standard deviation of volume, letting traders adjust sensitivity to recent vs. longer‑term activity. Optional significant volume lines extend forward, marking areas where absorption was strongest.
FUNCTIONS
Normalized volume detection using rolling standard deviation
Adjustable Lookback Period for volume normalization
Dynamic bubble plotting on candle wicks (size scales with absorption strength)
Separate visualization for buying vs. selling absorption
Alerts for buying absorption, selling absorption, or any absorption event (only at bar close)
Bar coloring when large absorption occurs inside candle bodies
APPLICATION
Setup: Add the script to any chart and timeframe. Adjust the Absorption Threshold to filter out weaker bubbles and the Lookback Period to control how volume normalization is calculated. Red bubbles highlight buying absorption, often signalling potential price pivots - price can often go upwards from this. Green bubbles mark selling absorption, reflecting resistance to upward moves - price may go downwards from this.
Interpretation:
Green bubbles on upper wicks = sellers absorbing buying pressure.
Red bubbles on lower wicks = buyers absorbing selling pressure.
Larger bubbles = stronger absorption relative to recent volume.
Settings & Use:
Raising the Absorption Threshold filters out smaller bubbles, leaving only significant absorption events.
Changing the Lookback Period alters how “normal” volume is defined — shorter periods make the script more sensitive, longer periods smooth out noise.
Alerts can be set for buying absorption, selling absorption, or any absorption event, and they only trigger at bar close to avoid noise.

VX-Time Quadrant Overlay (Quarterly Cycles) by Ikaru-s-The Time Quadrant Overlay is a purely time-based visualization tool designed to structure market time into repeating quarterly cycles across multiple timeframes.
It does not generate trade signals, entries, or bias.
Its sole purpose is to provide time context, so price action can be interpreted within a clear cyclical framework.
What this indicator does
The indicator divides time into four repeating quarters (Q1–Q4) and displays them simultaneously across different time horizons, such as:
Weekly
Daily (6-hour quarters)
90-minute cycles
Micro cycles (within 90-minute structure)
Each row represents a different time cycle, allowing traders to see time alignment, transitions, and overlaps at a glance.
Quarter Structure
Each cycle follows the same repeating sequence:
Q1 – Early phase
Q2 – Expansion / “True Open” phase
Q3 – Continuation
Q4 – Late phase / Transition
The quarters are visualized using color-coded boxes, making it easy to see:
where the market currently is in time
when a new quarter begins
when multiple cycles align or diverge
Quarter Start Marker
An optional Quarter Start Marker (vertical dashed line) can be enabled to highlight the start of a selected quarter (default: Q2).
This is intended as a time reference, not a signal:
useful for planning
useful for contextualizing reactions to levels
useful for session and cycle awareness
How to use it (practical)
This tool is best used to:
provide time structure to existing analysis
plan around upcoming time transitions
contextualize reactions to levels or areas
understand where price is acting within a cycle
It works well alongside:
discretionary price action
session-based trading
futures and index markets
any methodology that respects time as a variable
Customization
The indicator is fully customizable:
Enable / disable individual cycles
Adjust box transparency and history depth
Toggle labels and pane labels
Enable / disable quarter start markers
Select which quarter to highlight
This allows the tool to remain clean on higher timeframes and detailed on lower ones.
Important Notes
This is a visual framework, not a strategy.
No claims of predictive power are made.
Time structure does not replace risk management or execution logic.
The indicator is designed to adapt across markets, but interpretation remains discretionary.
Final Thoughts
Time is often treated as secondary to price.
This tool exists to make time visible, structured, and easy to work with — nothing more, nothing less.

FVG pointsFVGs ( fair value gaps) are imbalances that indicate displacement and are useful for reversal strategies that require displacement after a liquidity sweep
This indicator shows the size of the gap in points/dollars which can help determine momentum and strength in reversals, as does a failure or inversion (iFVG) of these gap if they fail to act as support or resistance to price. As stops are often placed on the other side of a fair value gap from entry, the indicator helps give traders an idea of stop loss size for calculating position size.
Fvg gaps below a certain points size can be considered to be weaker, larger gaps show stronger momentum. The indicator allows a minimum point size to be set so that FVGs below this minimum value will be shown without a points value.
Points value is also shown for inverted FVGs (iFVGs) by a change in colour and length of box.
By default, multiple gaps are combined together and the point value of the gap is shown, this can be toggled off in the settings to show the values of the individual gaps.
Settings:
Lookback - how many candles to look for FVGs and iFVGs
Change length of the FVG box
Change settings to decide the minimum size of gap to label
colours of boxes and labels
Option to show individual gaps or combined gaps

Volume Orderblock Breakout v3.6this is indicator that shows long short siganl and tp lines can be checked.
you can get profit by this forever.
we can win over whales
keep going don't give up!!!

VolumeTradingView made the default "Volume" script and I found it very bland because it only displayed volume.
This script is more than just about volume. It also includes:
- A comparison between price increase between the last candle of the post-market hours and first candle of the pre-market hours.
- Relative volume label of that sequence.
- Explicit pre-market, RTH, and post-market hours labels.

3SPC Three Candle Price Action Setup3SPC (Three Candle Price Action Setup) is an open-source indicator designed to detect
a simple and clearly defined three-candle price action pattern.
The logic is based on the following structure:
• The first two candles move in the same direction (bullish or bearish).
• The third candle interacts with the real bodies of both previous candles,
which may indicate a short-term liquidity sweep or price reaction.
• A bullish setup is confirmed when price holds above the open of the first candle.
• A bearish setup is confirmed when price holds below the open of the first candle.
This script does not use oscillators or lagging indicators.
It is intended as a visual aid for discretionary traders and should be used
together with market context, risk management and higher timeframe analysis.
The script is published as open-source for educational and transparency purposes.
UI Labels Translation:
- نمایش ستاپ صعودی: Show bullish setups
- نمایش ستاپ نزولی: Show bearish setups

INSTITUTIONAL VOLUME PROFILE + FIBONACCI + ENHANCED SIGNALS🎯 INSTITUTIONAL VOLUME PROFILE + FIBONACCI + ENHANCED SIGNALS
A professional-grade indicator combining Volume Profile analysis, Fibonacci retracements, Anchored VWAP, and intelligent signal filtering to identify high-probability institutional positioning and trade setups.
📊 CORE FEATURES
▸ Volume Profile with POC (Point of Control)
- Visualizes where institutional volume accumulated
- Identifies High Volume Nodes (HVN) as key support/resistance
- Shows Value Area (70% volume zone) for market equilibrium
▸ Dynamic Fibonacci Levels
- Auto-detects swing high/low for retracement levels
- Golden Pocket (0.618-0.65) highlight zone
- Bull/bear direction recognition
▸ Anchored VWAP
- Anchored to swing range start
- Institutional mean reversion baseline
- Real-time trend bias indicator
▸ Graded Signal System (A+/B/C)
- A+ Signals: High probability setups (VWAP cross + POC alignment)
- B Signals: Above-average quality (VWAP cross above POC)
- C Signals: Lower probability (counter-trend setups)
🎮 DISPLAY MODES
⚡ TRADING LIVE MODE
- Clean chart showing only A+ signals
- Minimal visual noise for active trading
- Perfect for intraday execution
📈 FULL OVERVIEW MODE
- Complete analysis with all zones visible
- Volume Profile + Fibonacci + Value Area
- All signal grades displayed
- Statistics dashboard
🔬 ADVANCED SIGNAL FILTERS
✓ Volume Confirmation
- Requires above-average volume on signals
- Filters out weak institutional participation
- Configurable volume multiple (default 1.2x)
✓ Momentum Filter
- Ensures price momentum aligns with signal direction
- Prevents counter-trend entries
- Configurable lookback period
✓ SR Proximity Upgrade ⭐ GAME CHANGER
- Automatically upgrades B/C signals to A+ when near key levels
- Detects proximity to POC and HVN zones
- Combines technical confluence for best setups
🔔 SMART ALERTS
▸ Configurable alerts for A+, B, or C signals
▸ Real-time notifications to your device
▸ No need to watch charts constantly
▸ "Once per bar close" prevents repainting
💡 HOW TO USE
FOR DAY TRADING:
1. Switch to "Trading Live" mode
2. Enable only A+ alerts
3. Set filters: Volume 1.5x, Momentum ON, Proximity 0.3%
4. Trade only A+ signals at key levels
FOR SWING TRADING:
1. Use "Full Overview" mode
2. Analyze Value Area and Fibonacci confluence
3. Set filters: Volume 1.2x, Momentum ON, Proximity 0.8%
4. Enter on A+ signals with multi-timeframe confirmation
FOR ANALYSIS:
1. Full Overview mode with all visuals enabled
2. Disable filters to see all raw signals
3. Study how institutions positioned at key zones
4. Plan trades around POC and Value Area
⚙️ RECOMMENDED SETTINGS
5-15 MIN CHARTS (Scalping):
- Lookback: 200-300 bars
- Volume: 1.5x, Momentum: 5 bars, Proximity: 0.3%
- Trading Live mode + A+ alerts only
1 HOUR CHARTS (Intraday):
- Lookback: 300 bars
- Volume: 1.3x, Momentum: 3 bars, Proximity: 0.5%
- Full Overview or Trading Live
4 HOUR CHARTS (Swing):
- Lookback: 300-500 bars
- Volume: 1.2x, Momentum: 3 bars, Proximity: 0.8%
- Full Overview mode
DAILY CHARTS (Position):
- Lookback: 300-500 bars
- Volume: 1.1x, Momentum: 2 bars, Proximity: 1.0%
- Full Overview mode
📈 KEY CONCEPTS
POC (Point of Control): Price level with highest volume - acts as magnet
Value Area: Zone containing 70% of volume - equilibrium range
HVN: High Volume Nodes - institutional accumulation zones
AVWAP: Anchored VWAP - institutional average entry price
Golden Pocket: 0.618-0.65 Fib zone - highest probability reversal area
🎯 TRADING STRATEGY TIPS
1. Wait for A+ signals - quality over quantity
2. Best setups occur at POC or Value Area boundaries
3. Use multiple timeframes for confirmation
4. Combine with your own risk management rules
5. Signals are high probability, not guaranteed - always use stops


GARCH Volume Volatility [MarkitTick]Title: GARCH Volume Volatility
Description
Overview
The GARCH Volume Volatility (GV) indicator is a sophisticated quantitative tool designed to analyze the rate of change in market participation. While the vast majority of technical indicators focus on Price Volatility (how much price moves), this script focuses on Volume Volatility (how unstable the participation is).
Market volume is rarely distributed evenly; it tends to cluster. Periods of high activity are often followed by more high activity, and periods of calm tend to persist. This behavior is known as "heteroskedasticity." This script utilizes an Exponentially Weighted Moving Average (EWMA) model—a core component of Generalized Autoregressive Conditional Heteroskedasticity (GARCH) frameworks—to model these changing variance regimes.
By isolating volume volatility from raw volume data, this tool helps traders distinguish between sustainable liquidity flows and erratic, unsustainable volume shocks that often precede market reversals or breakouts.
Methodology and Calculations
1. Logarithmic vs. Percentage Returns
The foundation of this indicator is the calculation of "Volume Returns"—the period-over-period change in volume.
- The script defaults to Logarithmic Returns. In financial statistics, log returns are preferred because they normalize data that can vary wildly in magnitude (such as cryptocurrency volume spikes), providing a more symmetric view of changes.
- Users can opt for standard percentage changes if they prefer a linear approach.
2. Variance Proxy (Squared Returns)
To measure volatility, the direction of the volume change (up or down) matters less than the magnitude. The script squares the returns to create a "Variance Proxy." This ensures that a massive drop in volume is treated with the same statistical weight as a massive spike in volume—both represent a significant change in the volatility of participation.
3. GARCH-Style Smoothing (EWMA)
Standard Moving Averages (SMA) treat all data points in the lookback period equally. However, volatility is dynamic. This script uses an EWMA model with a tunable "Lambda" (Decay Factor).
- The Recursive Formula: The current calculation relies on a weighted average of the current variance and the previous period's smoothed variance.
- Memory Effect: This allows the indicator to "remember" recent volatility shocks while gradually letting their influence fade. This mimics the GARCH process of conditional variance.
4. Dynamic Statistical Thresholds
The final output is the Volatility (square root of variance). To make this data actionable, the script calculates a dynamic upper and lower limit based on the standard deviation (Z-Score) of the volatility itself over a user-defined lookback period.
How to Use
The indicator plots a histogram that categorizes the market into four distinct volatility regimes:
1. High Volatility (Red Histogram)
Trigger: Volatility > High Band (Upper Standard Deviation).
Interpretation: This signals an extreme anomaly in volume stability. This is not just "high volume," but "erratic volume behavior." This often occurs at:
- Capitulation bottoms (panic selling).
- Euphoric tops (blow-off tops).
- Major news events or earnings releases.
2. Elevated Volatility (Maroon Histogram)
Trigger: Volatility > Mean Average.
Interpretation: The market is in an active state. Participation is changing rapidly, but within statistically normal bounds. This is common during healthy, trending moves where new participants are entering the market steadily.
3. Normal/Low Volatility (Green Histogram)
Trigger: Volatility is within the lower bands.
Interpretation: The market volume is stable. There are no sudden shocks in participation. This is typical of consolidation phases or "creeping" trends where the price drifts without significant volume conviction.
4. Extremely Low Volatility (Bright Green/Transparent)
Trigger: Volatility < Low Band.
Interpretation: The "calm before the storm." When volume volatility collapses to near-zero, it implies that the market has reached a state of equilibrium or disinterest. Historically, volatility is cyclical; periods of extreme compression often lead to violent expansion.
Settings and Configuration
Core Settings
- Use EWMA: When checked (Default), uses the recursive GARCH-style calculation. If unchecked, it reverts to a simple SMA of variance, which is less sensitive to recent shocks but more stable.
- Log Returns: Uses natural log for calculations. Highly recommended for assets with exponential growth or large volume ranges.
- Length: The baseline period for the calculation.
- Threshold Lookback: The number of bars used to calculate the Mean and Standard Deviation bands.
- EWMA Lambda: The decay factor (0.0 to 1.0). A value of 0.94 is standard for risk metrics.
-- Higher Lambda (e.g., 0.98): The indicator reacts slower and is smoother (long memory).
-- Lower Lambda (e.g., 0.80): The indicator reacts very fast to new data (short memory).
Visuals
- Show Thresholds: Toggles the visibility of the statistical bands on the chart.
- High Band (StdDev): The multiplier for the upper warning zone. Default is 1.5 deviations. Increasing this to 2.0 or 3.0 will filter for only the most extreme events.
Disclaimer This tool is for educational and technical analysis purposes only. Breakouts can fail (fake-outs), and past geometric patterns do not guarantee future price action. Always manage risk and use this tool in conjunction with other forms of analysis.

Selected Times V3-EnDoes the stock drop every Wednesday? Do March months always move similarly? Does the 1st week of the month behave differently?
Do you ever say "it always makes this move in these months"? Don't you want to see more clearly whether it actually makes this move or not? Don't you want to see and test periodically repeating price patterns?
1. Problem
Some stocks or crypto assets exhibit systematic behaviors on certain days, weeks, or months. But it's hard to see - everything is mixed together on the chart. This indicator isolates the days/weeks/months you want and shows only them. Hides everything else.
2. How It Works
Three-layer filter: Day (Monday, Tuesday...), Week (1st, 2nd, 3rd week of the month), Month (January, February...). Select what you want, let the rest disappear. Example: Show only Thursdays of March-June-September. Or compare every 1st week of the month. View as candlestick, line, or column chart.
3. What's It Good For?
Test "end-of-month effect". Find "day-of-the-week anomaly". Analyze crypto volatility by days. See seasonality in commodities. Discover patterns specific to your own strategy. Past data doesn't guarantee the future but provides statistical advantage.

SUPERTREND VALIDADO ADX EMAS VWAP # Modular Trading System - SuperTrend + ADX + Multi-Filter Confirmation
## Overview
Professional modular trading system designed for trend-following strategies on 4H timeframes. Features a clean, mobile-optimized interface with customizable filters and real-time status monitoring.
## Core Features
### Validated Components (Backtested)
- **SuperTrend (ATR 10, Multiplier 3.0)**: Primary trend direction filter with visual fill
- **ADX >23**: Trend strength confirmation (14-period)
- Proven performance: 52.11% win rate, 3.162 profit factor over 4 years
### Additional Filters (Optional)
- **DI Spread >9**: Directional movement confirmation
- **Volume > EMA20**: Volume confirmation above 20-period average
- **EMA System**: 7/21/50 with dynamic coloring
- **VWAP**: Daily volume-weighted average price
### Visual Elements
- **SuperTrend Line**: Green (bullish) / Red (bearish) with background fill
- **EMA 7**: Yellow when ADX >23, White when ADX ≤23
- **EMA 21**: Green (price above) / Red (price below)
- **EMA 50**: Blue reference line
- **VWAP**: Orange line
- **PDH/PDL**: Previous day high/low levels
- **EMA Cross Signals**: Small dots marking 7/21 crossovers
### Smart Money Concepts
- Automatic Previous Day High (PDH) / Previous Day Low (PDL) tracking
- Horizontal lines extending from current price
- Clear labeling for support/resistance levels
## Status Dashboard
Compact 2-column table (top-right) shows:
```
FILTERS | STATUS
1. ADX >23 | 47.6 OK / 18.2 NO
2. DI Spread >9 | Bullish / Bearish
3. SuperTrend | Bullish / Bearish
4. Volume >EMA20 | 1.25x OK / 0.14x NO
─────────────────────────────
SIGNAL | BUY / SELL / WAIT
```
Color-coded backgrounds:
- Green: Condition met
- Red: Condition not met
- Yellow: Waiting for confirmation
## Signal Logic
### Entry Conditions
**LONG**: All active filters must align
- SuperTrend bullish (green)
- ADX >23
- DI+ > DI- (if DI Spread enabled)
- Volume > EMA20 (if Volume enabled)
- Price > EMA21 and EMA7 > EMA21 (if EMAs enabled)
**SHORT**: All active filters must align
- SuperTrend bearish (red)
- ADX >23
- DI- > DI+ (if DI Spread enabled)
- Volume > EMA20 (if Volume enabled)
- Price < EMA21 and EMA7 < EMA21 (if EMAs enabled)
### Exit Conditions
- SuperTrend direction change
- Clear "EXIT" markers on chart
### Position Management
- One position per trend (no pyramiding)
- Prevents multiple entries in same direction
- "WAIT" status when conditions partially met
## Settings & Customization
### Filters (Enable/Disable)
**Core Filters:**
- ✓ SuperTrend (VALIDATED)
- ✓ ADX >23 (VALIDATED)
**Additional Filters:**
- ⚠️ DI Spread >9 (EXPERIMENTAL)
- ⚠️ Volume > EMA20 (EXPERIMENTAL)
- ⚠️ EMAs 7/21/50 (EXPERIMENTAL)
**Visual:**
- Show EMA 7/21 Crosses (dots)
### Parameters
**SuperTrend:**
- ATR Period: 10 (default)
- ATR Multiplier: 3.0 (default)
**ADX/DI:**
- ADX Length: 14 (default)
- ADX Threshold: 23 (default)
- DI Spread Threshold: 9 (default)
**Volume:**
- Volume EMA: 20 (default)
**EMAs:**
- Fast EMA: 7 (default)
- Medium EMA: 21 (default)
- Slow EMA: 50 (default)
## Alerts
Pre-configured alerts for:
- Long Signal (BUY - Entry confirmed)
- Short Signal (SELL - Entry confirmed)
- Exit Long (EXIT LONG - SuperTrend changed)
- Exit Short (EXIT SHORT - SuperTrend changed)
- EMA Cross Up (EMA 7 crossed above EMA 21)
- EMA Cross Down (EMA 7 crossed below EMA 21)
## Best Practices
### Recommended Setup (Validated System)
```
Enable ONLY:
- SuperTrend: ON
- ADX >23: ON
- All other filters: OFF
```
### Testing New Filters
1. Enable experimental filters
2. Backtest thoroughly before live trading
3. Compare performance metrics
4. Validate with demo account first
### Timeframe
- Optimized for: 4H charts
- Tested on: Bitcoin/USDT
- Works on: Any trending instrument
## Risk Management
This indicator provides entry/exit signals but does NOT include:
- Stop loss levels
- Take profit targets
- Position sizing
Always use proper risk management:
- Maximum 1-2% risk per trade
- Use stop losses
- Follow your trading plan
## Performance Notes
**Validated Backtest Results (SuperTrend + ADX only):**
- Win Rate: 52.11%
- Profit Factor: 3.162
- Return: +45.46% (4 years)
- Tested Period: 2020-2024
- Instrument: BTC/USDT 4H
**Important:** Adding additional filters changes the system. Results may vary. Always backtest your specific configuration before live trading.
## Mobile Optimization
- Compact table design
- Clear color coding
- Minimal chart clutter
- Large signal text
- Optimized for small screens
## Use Cases
✅ **Ideal for:**
- Trend-following strategies
- Swing trading (4H timeframe)
- Clear market conditions
- Systematic traders
❌ **NOT ideal for:**
- Scalping (too slow)
- Range-bound markets
- Counter-trend strategies
- Lateral/choppy conditions
## Credits & Methodology
Based on proven technical analysis principles:
- SuperTrend (volatility-based trend following)
- ADX (trend strength measurement)
- Directional Indicators (DI+/DI-)
- Volume analysis
- EMA systems
**Designed for:** Disciplined execution over frequent trading
**Philosophy:** Quality setups > Quantity of trades
## Disclaimer
This indicator is for educational purposes only. Past performance does not guarantee future results. Always:
- Test on demo account first
- Use proper risk management
- Never risk more than you can afford to lose
- Consult a financial advisor
Trading involves substantial risk. This tool does not constitute financial advice.
---
## Version History
**v2.0 (Current)**
- Modular filter system
- 2-column compact status table
- EMA 7 dynamic coloring (yellow when ADX >23)
- EMA 50 + VWAP added
- PDH/PDL levels
- EMA cross markers
- Improved signal logic
- One position per trend
- Multiple alert conditions
---
**For support, updates, or feedback, contact the developer.**

Liquidity Buy SignalLiquidity Buy Signal is an indicator designed to detect BUY entries based on liquidity (swing lows) combined with a bullish reversal candle pattern. It automatically marks recent swing-low zones/levels, tracks the transition from solid → dashed when a level gets broken, and then confirms a signal when price sweeps/cuts the correct level and a bullish candle pattern appears.
OANDA:EURUSD
BUY signal (green triangle) triggers when:
A bullish reversal candle pattern (based on a set of rules) is detected, and
The Liquidity chain conditions are satisfied using the most recent swing lows:
Price crosses the level with the lower wick, or
The level is within the lower 30% range of the previous candle (n-1), and
The level does not pass through the bodies of older candles (filtered by lookback).
Key settings:
Pivot Lookback: controls swing-low detection sensitivity.
Swing Area: Wick Extremity / Full Range for zone definition.
Filter lookback older bodies: filters out levels that intersect older candle bodies (skips n-2).
Style: toggle Swing Low display + zone/line colors.
Alerts:
Includes a built-in alertcondition for BUY signals (useful for notifications/webhooks).
This indicator is especially well-suited for identifying potential bottoms in a downtrend.
Note: This tool provides trading signals and should be combined with context (trend/HTF/volume/risk management) before entering trades. Not financial advice.

FxNeel SessionAll types of ICT session you can draw here. Like Asia, London, NY, New Close, CBDR, Asia Kill zone and also Silverbullet Time zone.

Trend Break Targets [MarkitTick]Trend Break Targets
Trend Break Targets is a technical analysis tool designed to assist traders in identifying trendline breakouts and projecting potential price targets based on market geometry. Unlike fully automated indicators that guess trendlines, this tool provides you with precise control by allowing you to manually Pivot Point the trendline to specific points in time, while automating the complex math of target projection and structure mapping.
Theoretical Basis & Concepts
This indicator is grounded in classic technical analysis principles found in foundational trading literature. It automates the following methodology:
Drawing a trend line between two key points to represent dynamic support or resistance.
Identifying a breakout when the price closes above or below this line, potentially signaling a change in trend.
Calculating a price target by measuring the vertical distance between the breakout line and the last high/low (pivot), then projecting that same distance in the direction of the breakout.
This concept is based on methods and "Measured Move" theories explained in classic books such as "Technical Analysis of Stock Trends" by Edwards & Magee, "Technical Analysis of the Financial Markets" by John Murphy, and in Thomas Bulkowski's Price Pattern Studies.
How It Works
Pivot Pointed Trendline Construction The script draws a trendline between two user-defined points in time (Start Date and End Date). It calculates the slope between these points and extends the line infinitely to the right, allowing you to define the exact structure (e.g., a resistance trendline on a wedge).
Breakout Detection The script monitors the "Price Source" (High, Low, or Close) relative to the extended trendline.
A Bullish Breakout (BC) occurs when the Close crosses above a bearish trendline.
A Bearish Breakout (BC) occurs when the Close crosses below a bullish trendline.
Dynamic Target Projection (The Math) Upon a confirmed breakout, the script automatically calculates three distinct targets by identifying the most significant "Swing Point" (Pivot) prior to the breakout.
Distance (D): The vertical distance between the Trendline and the Pivot Price at the specific bar where the pivot occurred.
Target 1 (T1): The Breakout Price +/- (Distance × 1.0). This represents a classic 1:1 measured move.
Target 2 (T2): The Breakout Price +/- (Distance × 1.618). Based on the Golden Ratio extension.
Target 3 (T3): The Breakout Price +/- (Distance × 2.618).
Market Structure (CHOCH) The script includes an optional Change of Character (CHOCH) module. This runs independently of the trendline logic, identifying local Swing Highs and Swing Lows based on the "Swing Detection Length." It plots dashed lines and labels to visualize immediate shifts in market structure.
How to Use This Tool
This is an interactive tool that requires user input to define the setup.
Identify a Setup: Locate a clear trend, wedge, or flag pattern on your chart.
Set Pivot Points: Go to the Indicator Settings. Input the exact Start Date and End Date corresponding to the two main touches of your trendline.
Monitor for Breakout: The script will extend the line. Wait for a "BC" label to appear.
Trade Management: Once "BC" prints, the T1, T2, and T3 lines will instantly render. These can be used as potential take-profit zones or areas to tighten stop-losses.
Settings & Configuration
Indicator Settings
Start/End Date: The timestamp Pivot Points for your trendline.
Price Source: Determines what price (High or Low) Pivot Points the line and triggers the breakout.
Pivot Left/Right: Adjusts the sensitivity for finding the "Pivot Before Break" used for target calculations.
Extend Target Line: How far forward the target lines are drawn.
Visual Style
Colors: Fully customizable colors for the Trendline, Breakout Labels, and each Target level (T1, T2, T3).
Gold Bullish Reversal
This analysis dissects a confirmed bullish reversal on Gold using a custom Trend Break system. The setup identifies a transition from a bearish corrective phase to bullish momentum, validated by a structural break and a geometric target projection.
Trend Identification (The Pivot Points) The descending white trendline serves as the primary dynamic resistance, defining the bearish correction.
Pivot Points: The line is drawn connecting two significant swing highs, marked by Label 1 and Label 2.
Logic: These points represent the "lower highs" characteristic of the previous downtrend. As long as price remained below this trajectory, the bearish bias was intact.
The Trigger: Breakout & Confirmation The transition occurs at the candle marked BC (Breakout Candle).
Breakout Criteria: The indicator logic dictates that a signal is only valid when the bar closes above the trendline. This filters out intraday wicks and ensures genuine buyer commitment.
CHOCH Confluence: Immediately following the breakout, a CHOCH (Change of Character) label appears. This signals a shift in market structure, indicating that the internal lower-high/lower-low sequence has been violated, adding probability to the reversal.
Target Projection: The Measured Move The vertical green lines (T1, T2) represent profit objectives derived from the depth of the prior move. The logic calculates the distance between the breakout line and the lowest pivot prior to the break.
T1 (Standard Target): This is a 1:1 projection of the pre-breakout volatility. We see price action initially stalling near this level, confirming it as a zone of interest.
T2 (Golden Ratio Extension): The second target is calculated as the initial distance multiplied by 1.618 (Fibonacci Golden Ratio). The chart shows the price rallying aggressively through T1 to tap the T2 zone, often considered an exhaustion or major take-profit level in harmonic extensions.
Conclusion Gold has successfully invalidated the 4-hour bearish trendline. The confluence of a confirmed close above resistance (BC) and a structural shift (CHOCH) provided a high-probability long setup. The price has now fulfilled the T2 (1.618) extension, suggesting traders should watch for consolidation or a reaction at this key Fibonacci resistance level.
Bearish Trendline Breakdown
The image displays a Bearish Trendline Breakdown on the Gold (XAUUSD) 4-hour chart. The indicator is actually functioning in "Low" mode here (connecting swing lows to form support), which triggers the bearish logic found in the code. Here is the step-by-step breakdown:
The Setup: Pivot Points & Trendline
Visual: The Blue Labels "1" and "2" connected by a white diagonal line.
Code Logic: These are the user-defined start and end points.
Pivot Point 1 (startDate): The starting pivot of the trendline.
Pivot Point 2 (endDate): The ending pivot.
Trendline: The code draws a line between these two points and extends it to the right (extend.right). In this specific image, the line acts as a Support Trendline.
The Trigger: Break Candle (BC)
Visual: The Red Label "BC" appearing just below the white trendline.
Code Logic: This is the execution signal. The code detects a "Down Break" (dnBreak) because the Price Source was likely set to "Low" and the candle's Close was lower than the Trendline Price at that specific bar (close < currLinePrice). This confirms the support level has been breached.
The Projection: Targets (T1 & T2)
Visual: The Green Labels "T1" and "T2" with dotted horizontal lines projected downward.
Code Logic: These are profit targets based on a "Measured Move."
Pivot Calculation: The script looks back for a recent "Pivot High" (the peak before the crash) to calculate the volatility/distance (dist) between that peak and the trendline.
T1 (Conservative): The price is projected downward by 1x that distance (currLinePrice - dist).
T2 (Extended): The price is projected downward by 1.618x that distance (Golden Ratio extension).
Market Context: CHOCH
Visual: The small Red/Orange "CHOCH" labels appearing above the price action.
Code Logic: This is a secondary confirmation system running independently of the trendline. It detects a Change of Character (structural shift). The red labels indicate a "Bearish CHOCH," meaning the price broke below a significant prior swing low (last_swing_low). This supports the bearish bias of the trendline break.
Disclaimer This tool is for educational and technical analysis purposes only. Breakouts can fail (fake-outs), and past geometric patterns do not guarantee future price action. Always manage risk and use this tool in conjunction with other forms of analysis.
