RSI Divergence (Double Peak Only)RSI Divergence (Double Peak Only)RSI Divergence (Double Peak Only)RSI Divergence (Double Peak Only)RSI Divergence (Double Peak Only)RSI Divergence (Double Peak Only)RSI Divergence (Double Peak Only)RSI Divergence (Double Peak Only)RSI Divergence (Double Peak Only)RSI Divergence (Double Peak Only)RSI Divergence (Double Peak Only)RSI Divergence (Double Peak Only)
Penunjuk dan strategi

MTF EMA with Smoothing OptionsThis indicator plots a smoothed Exponential Moving Average (EMA) from a higher or custom timeframe onto your current chart — perfect for blending multi-timeframe context into your intraday or swing trading strategy.
Features:
Custom Timeframe Selection: View a 1H, 4H, Daily (or any) EMA on lower timeframes.
Smooth Display: Option to remove stepped or jagged EMAs — clean interpolation for visual clarity.
Custom EMA Length & Source: Fully configurable length and input (close, open, hl2, etc.).
Dynamic Coloring: Line color shifts automatically:
Green (or your choice) if price is above the EMA
Red (or your choice) if price is below the EMA
Use Cases:
Visualize higher-timeframe trend on intraday charts
Confirm trend alignment across multiple timeframes
Combine with breakouts, pullbacks, or structure shifts

High-Low Moving Average AreaThe High Low Moving Average Area is a custom indicator crafted by Todi Chrisavero, designed to enhance price action analysis by shading the area between moving averages of high and low prices. Instead of displaying a single moving average line, this tool forms a dynamic price zone, helping traders visualize market structure, trend strength, and potential support/resistance levels more intuitively.

KEY MARKET SESSION EU/US RANGE LEVELS - KLT🔹 KEY MARKET SESSION EU/US RANGE LEVELS - KLT
This indicator highlights critical trading levels during the European and U.S. sessions, with Overbought (OB) and Oversold (OS) markers derived from each session's price range.
It’s designed to support traders in identifying key zones of interest and historical price reactions across sessions.
✳️ Features
🕒 Session Recognition
European Session (EU): 08:00 to 14:00 UTC
United States Session (US): 14:30 to 21:00 UTC
The indicator automatically detects the current session and updates levels in real time.
📈 Overbought / Oversold (OB/OS) Levels
Helps identify potential reversal or reaction zones.
🔁 Previous Session OB/OS Crosses
OB/OS levels from the previous session are plotted as white crosses during the opposite session:
EU OB/OS shown during the US session
US OB/OS shown during the EU session
These levels act as potential price targets or reaction areas based on prior session behavior.
🎨 Session-Based Color Coding
EU Session
High/Low: Orange / Fuchsia
OB/OS: Orange / Lime
Previous OB/OS: White crosses during the US session
US Session
High/Low: Aqua / Teal
OB/OS: Aqua / Lime
Previous OB/OS: White crosses during the EU session
🧠 How to Use
Use the OB/OS levels to gauge potential turning points or extended moves.
Watch for previous session crosses to spot historically relevant zones that may attract price.
Monitor extended High/Low lines as potential magnets for price continuation.
🛠 Additional Notes
No repainting; levels are session-locked and tracked in real time.
Optimized for intraday strategies, scalping, and session-based planning.
Works best on assets with clear session behavior (e.g., forex, indices, major commodities).
⚠️ Disclaimer
This tool is intended for educational purposes. Always manage risk appropriately and use confluence with other analysis tools.
🔐 Copyright © KEY LEVELS TRADING

QQE MOD Elite (RSI Simple Signal)QQE MOD Elite (RSI Simple Signal)
📊 Overview
A clean, minimal version of the QQE concept that smooths RSI data and only highlights overbought and oversold extremes. Designed for traders who want to track exhaustion zones without clutter or noise.
⚙️ How It Works
• Calculates a smoothed RSI using an EMA
• Line color is neutral by default (white)
• Turns aqua above Overbought (70)
• Turns fuchsia below Oversold (30)
• OB/OS boundaries marked with dashed gray lines
• Optional light gray fill between 30–70 zone
🎯 Inputs
• RSI Length
• QQE Smoothing
• Overbought Level
• Oversold Level
✅ Benefits
• Simple, intuitive visual cue for momentum extremes
• Zero noise in neutral or trending zones
• Keeps charts clean and focused
• Fast-read confirmation for fade or exit conditions
• Works well with trend, volume, or crossover overlays
📈 Use Cases
• Spot potential pullback or fade areas
• Confirm exhaustion before exit
• Companion tool for swing or intraday setups
• Useful OB/OS visualization layer for minimal systems
⚠️ Notes
• Not a trade signal generator
• OB/OS thresholds are adjustable based on asset or timeframe
• Best used as a visual companion—not standalone strategy

Dax 8:15am School run Target Lines V2 (lower TF) Taken from Tom Hougaard basic School run break out strategy. enabling me target exit points. Works best on a 7m break out i find. Close within range and close trade and usually an Anti.

Dr. Jones TSI DivergenceSimple TSI indicator with signal line. Publishing for my trading group to be able to utilize. It's really cool.

TUFAN Hacim / Fiyat SkoruCalculates long, mid, and short-term volume averages along with volume volatility.
Scores volume strength based on volume trend slope and price changes.
Adjusts the score based on the relationship between price and its 50, 100, and 150-day moving averages.
Combines and normalizes these factors into a final volume/price score.
Triggers an alert when the score is 3 or higher and displays the score with color coding on the chart.

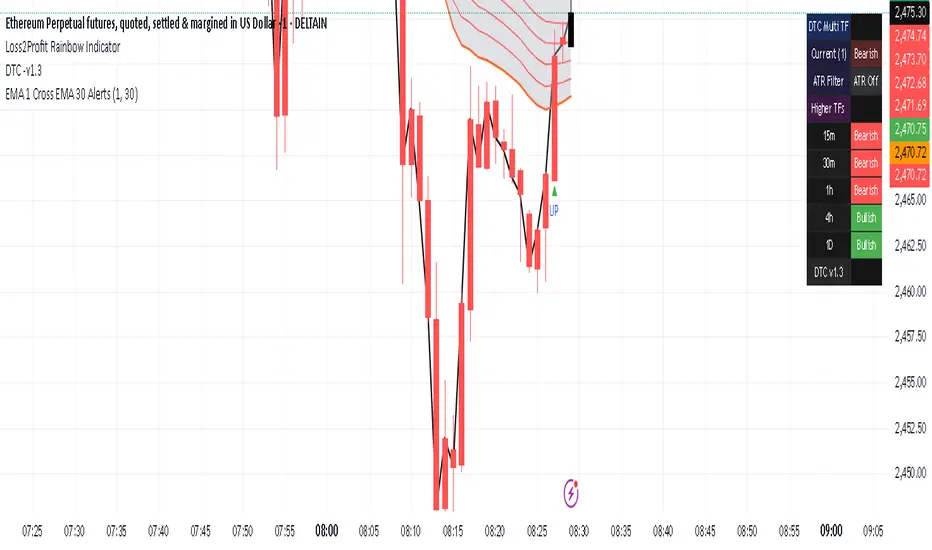
EMA 1 Cross EMA 30 Alertswith this indicator you can create alert for the ema 1 crossing ema 30 if the crossing is up word you can go for long trade. if the crossing is down word you can go for short trade
OBV with MA & Bollinger Bands by Marius1032OBV with MA & Bollinger Bands by Marius1032
This script adds customizable moving averages and Bollinger Bands to the classic OBV (On Balance Volume) indicator. It helps identify volume-driven momentum and trend strength.
Features:
OBV-based trend tracking
Optional smoothing: SMA, EMA, RMA, WMA, VWMA
Optional Bollinger Bands with SMA
Potential Combinations and Trading Strategies:
Breakouts: Look for price breakouts from the Bollinger Bands, and confirm with a rising OBV for an uptrend or falling OBV for a downtrend.
Trend Reversals: When the price touches a Bollinger Band, examine the OBV for divergence. A bullish divergence (price lower low, OBV higher low) near the lower band could signal a reversal.
Volume Confirmation: Use OBV to confirm the strength of the trend indicated by Bollinger Bands. For example, if the BBs indicate an uptrend and OBV is also rising, it reinforces the bullish signal.
1. On-Balance Volume (OBV):
Purpose: OBV is a momentum indicator that uses volume flow to predict price movements.
Calculation: Volume is added on up days and subtracted on down days.
Interpretation: Rising OBV suggests potential upward price movement. Falling OBV suggests potential lower prices.
Divergence: Divergence between OBV and price can signal potential trend reversals.
2. Moving Average (MA):
Purpose: Moving Averages smooth price fluctuations and help identify trends.
Combination with OBV: Pairing OBV with MAs helps confirm trends and identify potential reversals. A crossover of the OBV line and its MA can signal a trend reversal or continuation.
3. Bollinger Bands (BB):
Purpose: BBs measure market volatility and help identify potential breakouts and trend reversals.
Structure: They consist of a moving average (typically 20-period) and two standard deviation bands.
Combination with OBV: Combining BBs with OBV allows for a multifaceted approach to market analysis. For example, a stock hitting the lower BB with a rising OBV could indicate accumulation and a potential upward reversal.
Created by: Marius1032

GCM Price Based ColorIndicator Name:
GCM Price Based Color Indicator
Detailed Description:
The GCM Price Based Color Indicator is a unique tool designed to help traders spot potential "pump" events in the market. Unlike traditional Volume Rate of Change (VROC) indicators, this script is conditional: it calculates a VROC value only when both the average volume and the price are increasing. This focus helps filter out volume surges that don't accompany immediate price appreciation, highlighting more relevant "pump" signals.
Key Features & Calculation Logic:
Conditional Volume Rate of Change (VROC):
It first calculates a Simple Moving Average (SMA) of the volume over a user-defined length (lookback period).
It then checks two conditions:
Is the current SMA volume greater than the previous bar's SMA volume (i.e., volumeIncreasing)?
Is the current close price greater than the previous bar's close price (i.e., valueIncreasing)?
Only if both volume Increasing AND value Increasing are true, a VROC value is calculated as (current _ MA _ volume - previous _ MA _ volume) * (100 / previous _ MA _ volume). Otherwise, the VROC for that bar is 0.
Historical Normalization:
The raw VROC value is then normalized against its own historical maximum value observed since the indicator was applied. This scaling brings all VROC values into a common 0-100 range.
Why is this important? Normalization makes the indicator's readings comparable across different assets (e.g., high-volume vs. low-volume stocks/cryptos) and different timeframes, making it easier to interpret the strength of a "pump" relative to its own past.
Dynamic Plot Color (Price-Based):
The plot line's color itself provides an immediate visual cue about the current bar's price action:
Green: close is greater than close (price is up for the current bar).
Red: close is less than close (price is down for the current bar).
Grey: close is equal to close (price is flat for the current bar).
Important Note: The plot color reflects the price movement of the current bar, not the magnitude of the VROC Normalized value itself. This means you can have a high vrocNormalized value (indicating a strong conditional volume surge) but a red plot color if the very next bar's price closes lower, providing a multi-faceted view.
Thresholds & Alerts:
Two horizontal lines (small Pump Threshold and big Pump Threshold) are plotted to visually mark significant levels of normalized pump strength.
Customizable alerts can be set up to notify you when VROC Normalized reaches or exceeds these thresholds, helping you catch potential pump events in real-time.
How to Use It:
Identify Potential Pumps: Look for upward spikes in the VROC Normalized line. Higher spikes indicate stronger pump signals (i.e., a larger increase in average volume coinciding with an increasing price).
Monitor Thresholds: Pay attention when the VROC Normalized line crosses above your small Pump Threshold or big Pump Threshold. These are configurable levels to suit different assets and trading styles.
Observe Plot Color: The line color provides crucial context. A high VROC Normalized (strong pump signal) with a green line indicates current price momentum is still positive. If VROC Normalized is high but the line turns red, it might suggest the initial pump is losing steam or experiencing a pullback.
Combine with Other Tools: This indicator is best used in conjunction with other technical analysis tools (e.g., support/resistance, trend lines, other momentum indicators) for confirmation and a more holistic trading strategy.
Indicator Inputs:
Lookback period (1 - 4999) (default: 420): This length determines the period for the Simple Moving Average (SMA) of volume. A higher value will smooth the volume average more, reacting slower, while a lower value will make it more reactive. Adjust based on the timeframe and asset volatility.
Big Pump Threshold (0.01 - 99.99) (default: 10.0): The normalized VROC Normalized level that signifies a "Big Pump." When VROC Normalized reaches or exceeds this level, an alert can be triggered.
Small Pump Threshold (0.01 - 99.99) (default: 0.5): The normalized VROC Normalized level that signifies a "Small Pump." This is a lower threshold for earlier or less significant pump activity.
Alerts:
Small Pump: Triggers when VROC Normalized crosses above or equals the small Pump Threshold.
Big Pump: Triggers when VROC Normalized crosses above or equals the big Pump Threshold.
Best Practices & Considerations:
Timeframes: The indicator can be used on various timeframes, but its effectiveness may vary. Experiment to find what works best for your chosen asset and trading style.
Volatility: Highly volatile assets might require different threshold settings compared to less volatile ones.
Lag: Due to the use of a Simple Moving Average (SMA) for volume, there will be some inherent lag in the calculation.
Normalization Start: The historic Max for normalization starts with a default value of 10.0. For the very first bars, or if there hasn't been a significant VROC yet, the VROC Normalized might behave differently until a true historical maximum VROC establishes itself.
Not Financial Advice: This indicator is a tool for analysis and does not constitute financial advice. Always perform your own research and manage your risk.

Medico Weekly EMA12-26 Buy/Sell Trend with Bar ColorUsing EMA 12 and EMA 26 to create "buy" and "sell" signal. Best on timeframe weeky chart. Enjoy and Good luck.

Smart Reversal Signal (Stoch + RSI + EQH/EQL)Smart Reversal Signal combines Stochastic oscillator, RSI levels, and Equal High/Low detection to identify potential price reversal zones. It highlights buy signals when Stochastic crosses up in oversold conditions with RSI confirmation and Equal Low (EQL), and sell signals when Stochastic crosses down in overbought areas with Equal High (EQH), shown via background color alerts.

RSI Candlestick//@version=5
indicator("RSI Candlestick", overlay=false)
length = input(14, title="RSI Length")
rsi = ta.rsi(close, length)
// RSI를 캔들로 변환 (예: RSI의 시가, 고가, 저가, 종가 계산)
rsi_open = rsi // 이전 RSI 값
rsi_close = rsi // 현재 RSI 값
rsi_high = math.max(rsi, rsi_open) // 고가는 현재와 이전 중 큰 값
rsi_low = math.min(rsi, rsi_open) // 저가는 현재와 이전 중 작은 값
// 캔들 플롯
plotcandle(rsi_open, rsi_high, rsi_low, rsi_close, title="RSI Candles", color=rsi_close > rsi_open ? color.green : color.red)

Bollinger Bands with Buy/Sell SignalsWhen price crosses above the upper band → green “BUY” label appears below the bar
When price crosses below the lower band → red “SELL” label appears above the bar

10 EMA & 10 SMA Crossover with Dot/Cross ON ChartCombining 10MA an 10SMA is very powerful indicator, it give early indication of trend.
Tried to combine 10MA and 10SMA crossover on same chart with cross over indicator.
Back test it. It works well in trending market.
Tried to combine RSI, ADX and 10 MA combination on chart but could not make appropriate/effective Pine Script.
Your suggestion's are welcome to improve it further.


MA 3/20/200 mit Trendverlängerung📊 3-Line MA Pack – Clean Trend Tracking with Projection
Fast. Clear. No fluff.
This script shows:
🔴 MA 3 – short-term momentum
🟠 MA 20 – medium trend flow
🔵 MA 200 – long-term direction
All lines extend forward based on recent slope – automatically adjusted to your timeframe.
Perfect for traders who want to see the flow at a glance.
Plug it in. Read the trend. Trade smarter.
No noise – just structure.

ATR-Multiple from 50SMAThis indicator provides a nuanced view of price extension by calculating the distance between the current price and its 50-period Simple Moving Average. This distance is not measured in simple percentage terms but is quantified in multiples of the Average True Range (ATR), offering a volatility-adjusted perspective on how far an asset has moved from its mean.
The primary goal is to help traders identify potentially overextended conditions, which can often precede price consolidation or reversals. As a general guideline, when an asset's price stretches to multiples of 7 ATRs or more above its 50-day SMA, it often enters a zone where significant profit-taking may occur. By visualizing this extension, the indicator can serve as a powerful tool for gauging when to consider taking profits on existing long positions. Furthermore, it can act as a cautionary signal, helping traders avoid initiating new long positions in assets that are already significantly stretched and may be poised for a pullback.
Features
Volatility-Adjusted Extension
Measures the distance from the 50 SMA in terms of ATR multiples, providing a more standardized way to compare extension across different assets and time periods.
Daily Timeframe Consistency
By default, the indicator uses the daily SMA and ATR for its calculations, regardless of the chart's current timeframe. This ensures a consistent and meaningful measure of extension rooted in the daily trend.
Histogram Visualization
Displays the result as a clear histogram in a separate pane, making it easy to track the extension level over time and identify historical extremes.
Dynamic Color-Coding
The histogram bars are color-coded to visually highlight different levels of extension. The colors shift as the price moves further from the mean, providing an intuitive at-a-glance reading.
Key Threshold Markers
Includes pre-set horizontal lines at the 7 and 10 ATR multiples to clearly mark the zones of potential profit-taking and extreme extension, respectively.
Built-in Alerts
Comes with configurable alert conditions that can notify you when the price reaches the "profit-taking" threshold (7 ATRs) or the "extreme extension" threshold (10 ATRs).
Customization Options
MA & ATR Periods
You can adjust the length for the Simple Moving Average (default 50) and the Average True Range (default 14) to suit your specific analytical needs.
Timeframe Source
A toggle allows you to switch between always calculating using daily data (the default and recommended setting) or using the data from the current chart's timeframe.
Color Display Style
You can choose between a smooth color gradient that transitions elegantly with the extension level or a distinct, step-based color display for a clearer visual separation of the defined zones.
Full Color Scheme Control
Every visual element is fully customizable. You can change the colors for the regular extension, the "get ready," "profit-taking," and "extreme" levels, as well as the horizontal reference lines.

Dual-Timeframe EMA (Auto + Input Override)hi friends
so how to use this indiactor
two types of enteries
1.class buy the dip
consider bullish eg
when you get red signal, wait for a green signal to come after this soon
thats a long signal
prerequisite is weekly should have shown green signal(for bullish)
just switch to weekly and it will change the setting automatically for you
stop loss below the recent low
2.aggresive entry
bullish eg
where whenever price shows red entry, you consider this as a fake signal and go long immediately - I prefer this for very strong trends but not my type
since it becomes very tough to keep a proper stop loss
prerequisite weekly should be green

Price Difference IndicatorSimply calculate the difference between two products.
You can customize and set two different products.

Eliora Phase 4.2.2 – Precision Bloom Mode | DAX 5minPhase shifts and market cohesion using math. Sure! Let’s break down the **simple trading bot concept** for **TradingView** step by step, focusing on the logic, purpose, and key elements of the strategy. This bot uses a **trend-following strategy** combined with **risk management** to automate trades based on moving averages and the RSI indicator.
---
### **Trading Bot Concept:**
#### **Objective:**
The primary objective of this bot is to **identify trends** and **execute buy and sell orders** based on those trends, while also ensuring **risk management** through stop-loss and take-profit levels.
The bot uses two **core indicators**:
* **Exponential Moving Averages (EMAs)**: To identify the trend direction.
* **Relative Strength Index (RSI)**: To filter out overbought and oversold conditions, helping avoid entering trades during extreme market conditions.
---
### **Key Components:**
#### 1. **Exponential Moving Averages (EMA)**
* **50-period EMA** (Short-Term Trend): Tracks the price's movement in the recent past, offering more weight to recent prices. This helps the bot react quicker to short-term market shifts.
* **200-period EMA** (Long-Term Trend): Represents the broader market trend, helping the bot assess the overall market direction.
**Buy Signal**:
* A buy signal is triggered when the **50-period EMA crosses above** the **200-period EMA** (a **bullish crossover**), suggesting that the market is entering an uptrend.
**Sell Signal**:
* A sell signal is triggered when the **50-period EMA crosses below** the **200-period EMA** (a **bearish crossover**), indicating that the market might be reversing into a downtrend.
#### 2. **Relative Strength Index (RSI)**
* **RSI** is a momentum oscillator that measures the speed and change of price movements, indicating whether an asset is overbought or oversold.
* **Buy Condition**: The bot only takes buy trades if the **RSI is above 30**. This ensures that the market isn't in an **oversold** condition, which could indicate a potential reversal.
* **Sell Condition**: The bot will only take sell actions if the **RSI is below 70**, avoiding trades during **overbought** conditions where prices might be excessively high.
---
### **How the Bot Works:**
1. **Buy Signal Conditions:**
* The **50-period EMA** crosses **above** the **200-period EMA** (bullish crossover), indicating the potential start of an uptrend.
* The **RSI is above 30**, ensuring that the market isn’t oversold and a reversal isn’t imminent.
* If both of these conditions are true, the bot will **enter a long (buy) position**.
2. **Sell Signal Conditions:**
* The **50-period EMA** crosses **below** the **200-period EMA** (bearish crossover), signaling that the market might be transitioning into a downtrend.
* The **RSI is below 70**, meaning the market isn’t in an overbought state and the sell-off is not due to excessive bullish momentum.
* If both of these conditions are met, the bot will **exit** any long position (i.e., sell).
---
### **Risk Management:**
To protect against significant losses, the bot includes two essential features of **risk management**:
1. **Stop-Loss**:
* The bot will automatically **exit the trade if the price moves against it by 2%** (or another user-defined percentage). This minimizes potential losses in case the market moves unfavorably after entry.
2. **Take-Profit**:
* The bot will automatically **exit the trade once it reaches a profit of 5%** (or another user-defined percentage). This locks in profits if the market moves favorably.
---
### **Script Breakdown:**
Here’s the **key flow** of the Pine Script:
1. **Define Parameters**: The script begins by defining input values for the **EMA periods** and **RSI length**. It also defines the **RSI overbought (70)** and **RSI oversold (30)** levels.
2. **Calculate the EMAs and RSI**:
* The 50-period and 200-period **EMAs** are calculated using the `ta.ema()` function.
* The **RSI** is calculated using `ta.rsi()`, and it helps determine if the asset is overbought or oversold.
3. **Trading Conditions**:
* A buy signal is generated when the **short-term EMA crosses above** the **long-term EMA** and the RSI is **above 30**.
* A sell signal is triggered when the **short-term EMA crosses below** the **long-term EMA** and the RSI is **below 70**.
4. **Strategy Execution**:
* When the buy condition is met, the bot **enters a long position** using `strategy.entry()`.
* When the sell condition is met, the bot **closes the position** using `strategy.close()`.
5. **Risk Management**:
* The `strategy.exit()` function is used to set **stop-loss** and **take-profit** values. If the price moves **2% against** the trade, the bot will exit. If it moves **5% in favor**, it will lock in profits.
---
### **Visual Elements**:
1. **EMAs**:
* The **50-period EMA** is plotted in **green**.
* The **200-period EMA** is plotted in **red**.
2. **RSI**:
* The **RSI line** is plotted in **blue** on a separate pane below the main chart.
* Horizontal lines mark the **overbought** (70) and **oversold** (30) levels, helping visualize potential reversal zones.
3. **Buy and Sell Signals**:
* When the bot triggers a buy, a **green arrow** appears on the chart.
* When it triggers a sell, a **red arrow** appears on the chart.
---
### **How to Use the Bot on TradingView:**
1. **Go to TradingView** and open a chart of the asset you want to trade.
2. **Click on the "Pine Editor"** tab at the bottom.
3. **Paste the script** provided into the editor.
4. **Click "Add to Chart"** to see the strategy in action.
5. The bot will begin executing trades based on the logic described and display buy/sell signals directly on the chart.
---
### **Advantages of This Strategy**:
* **Trend-Following**: This bot is based on the classic moving average crossover strategy, which is effective in trending markets.
* **Simple and Clear**: The logic is easy to follow and understand, making it beginner-friendly.
* **Built-in Risk Management**: The stop-loss and take-profit functionality ensures that the bot limits potential losses and locks in profits automatically.
* **Customizable**: You can easily tweak the parameters (e.g., EMA periods, RSI levels, stop-loss, take-profit) to fit different timeframes or market conditions.
---
### **Limitations**:
* **Sideways Markets**: The bot might struggle in flat or sideways markets because moving average crossovers can produce false signals.
* **No Advanced Features**: It doesn’t incorporate more advanced strategies like **momentum indicators**, **news sentiment**, or **machine learning models** for decision-making.
---
### **In Conclusion:**
This is a **basic but effective trend-following trading bot** that you can deploy on TradingView with minimal effort. It provides a great foundation for traders who want to automate a simple strategy with **risk management**, while offering plenty of room for customization and improvement.
Let me know if you want to explore more complex features or strategies, or if you need help tweaking the bot for specific assets or markets!

Disguised Candles by The School of Dalal StreetDisguised Candles corrects one of the subtle visual distortions present in normal candlestick charts — the mismatch between the close of one candle and the open of the next.
On many instruments (especially at day/session breaks), the next candle’s open often jumps due to price gaps or data feed behavior. This can make reading the flow of price action harder than necessary.
Disguised Candles fixes this by plotting synthetic candles where the open of each candle is forced to match the close of the previous one — creating a visually continuous flow of price.
Real candles are made fully transparent, so only the "corrected" candles are visible.
This allows traders to:
Visualize price flow as a smooth path
Better spot true directional shifts and trends
Avoid distractions caused by technical gaps that are not meaningful to their strategy
🚀 Pure visual clarity. No noise from false opens.
How it works:
The open of each synthetic candle = close of previous real candle
High, Low, Close remain unchanged
Colors are based on Close vs Corrected Open
Real chart candles are hidden under a transparent overlay
Use this as a clean canvas for trend analysis or as a foundation for building new visual systems.
