Initial Balance Wave Map📊 Initial Balance Wave Map – Powered by VWAP Wave
The Initial Balance Wave Map is your visual roadmap for navigating the first hour of trading like a pro. Built to align with the VWAP Wave System, this indicator automatically plots the Initial Balance (IB) high and low, calculates real-time IB extensions, and layers in key midpoints and volume-based structure to map out high-probability zones for both reversals and breakouts. This upgraded indicator builds upon the open-source foundation by @noop-noop, with enhancements and user-facing labels tailored for Auction Market Theory, scalping, and structure-based trade setups.
🔍 Key Features:
✅ Automatically plots IB High/Low based on session times (customizable)
🔁 Displays +1x / +2x IB extensions and midpoints for precision targeting
📐 Integrated with VWAP Wave strategy: use with deviation bands for full context
🎯 Works across futures, forex, and crypto — universal structure map
🎨 Optional visual highlights for calculation window and labeling
💡 How to Use:
Fade setups: Look for price rejection at ±1x or ±2x IB extensions inside a balanced market.
Breakout setups: Combine IB breaks with VWAP Wave price discovery for high-momentum plays.
Return to value: When price rejects extension levels and rotates, target the IB midpoint or VWAP.
Whether you’re scalping futures like NQ & ES, swinging gold, or analyzing forex pairs, the Initial Balance Wave Map gives you the structural clarity to react instead of guess.
For more information, visit vwapwave.com and find the VWAP Wave System official published book on Amazon.com .
🙌 Credits:
This script builds upon the excellent open-source work by @noop-noop. Original script available here .
Penunjuk dan strategi


Chandelier Exit Oscillator [LuxAlgo]The Chandelier Exit Oscillator is a technical analysis tool that provides insights into potential trend reversals, momentum shifts, and trend continuation patterns, helping traders pinpoint optimal exit points for both long and short positions.
By calculating trailing stop levels based on a multiple of the Average True Range (ATR), the oscillator visually indicates when prices move above or below these critical stop levels.
This script uniquely combines the Chandelier Exit indicator with an oscillator format, equipping traders with a versatile tool that leverages ATR-based levels for enhanced trend analysis.
🔶 USAGE
Displaying the Chandelier Exit as an oscillator allows traders to gauge trend momentum and strength, recognize potential reversals, and refine their market insights.
The Timeframe option specifies the timeframe used for calculations, enabling multi-timeframe analysis and allowing traders to align the indicator’s signals with broader or narrower market trends.
The Chandelier Exit Oscillator allows users to select between a Regular or Normalized oscillator type. The Regular option displays raw oscillator values, while the Normalized version smooths values and scales them from 0 to 100.
The Chandelier Exit Overlay allows users to enable or disable the display of Chandelier Exit levels directly on the price chart. When enabled, this overlay plots trailing stop levels for both long and short positions, helping traders visually monitor potential exit points and trend boundaries alongside the price action.
The Trend-based Bar Color feature allows users to color the bars on the price chart according to the current trend direction. This visual differentiation aids in quicker decision-making and provides a clearer understanding of market dynamics.
🔶 SETTINGS
🔹 Chandelier Exit Settings
Timeframe: Sets the timeframe for calculations, allowing multi-timeframe analysis.
ATR Length: Defines the number of bars used for calculating the Average True Range (ATR), which helps in setting Chandelier Exit levels.
ATR Multiplier: Adjusts the sensitivity of the Chandelier Exit lines based on the ATR. Higher values make the indicator more conservative, while lower values make it more responsive.
🔹 Chandelier Exit Oscillator
Chandelier Exit Oscillator: Allows users to choose between a Regular or Normalized oscillator type. The Regular option displays raw oscillator values, while the Normalized version smooths values and scales them from 0 to 100.
Oscillator Smoothing: Controls the level of smoothing applied to the oscillator. Higher smoothing values filter out minor fluctuations.
🔹 Chandelier Exit Overlay
Chandelier Exit Overlay: Enables or disables the display of Chandelier Exit levels directly on the price chart.
Trend-based Bar Colors: Allows users to color bars based on trend direction, enhancing the visual analysis of market direction.
🔶 RELATED SCRIPTS
Market-Structure-Oscillator

Logarithmic Moving Average (LMA) [QuantAlgo]🟢 Overview
The Logarithmic Moving Average (LMA) uses advanced logarithmic weighting to create a dynamic trend-following indicator that prioritizes recent price action while maintaining statistical significance. Unlike traditional moving averages that use linear or exponential weights, this indicator employs logarithmic decay functions to create a more sophisticated price averaging system that adapts to market volatility and momentum conditions.
The indicator displays a smoothed signal line that oscillates around zero, with positive values indicating bullish momentum and negative values indicating bearish momentum. The signal incorporates trend quality assessment, momentum confirmation, and multiple filtering mechanisms to help traders and investors identify trend continuation and reversal opportunities across different timeframes and asset classes.
🟢 How It Works
The indicator's core innovation lies in its logarithmic weighting system, where weights are calculated using the formula: w = 1.0 / math.pow(math.log(i + steepness), 2) The steepness parameter controls how aggressively recent data is prioritized over historical data, creating a dynamic weight decay that can be fine-tuned for different trading styles. This logarithmic approach provides more nuanced weight distribution compared to exponential moving averages, offering better responsiveness while maintaining stability.
The LMA calculation combines multiple sophisticated components. First, it calculates the logarithmic weighted average of closing prices. Then it measures the slope of this average over a 10-period lookback: lmaSlope = (lma - lma ) / lma * 100 The system also incorporates trend quality assessment using R-squared correlation analysis of log-transformed prices, measuring how well the price data fits a linear trend model over the specified period.
The final signal generation uses the formula: signal = lmaSlope * (0.5 + rSquared * 0.5) which combines the LMA slope with trend quality weighting. When momentum confirmation is enabled, the indicator calculates annualized log-return momentum and applies a multiplier when the momentum direction aligns with the signal direction, strengthening confirmed signals while filtering out weak or counter-trend movements.
🟢 How to Use
1. Signal Interpretation and Threshold Zones
Positive Values (Above Zero): LMA slope indicating bullish momentum with upward price trajectory relative to logarithmic baseline
Negative Values (Below Zero): LMA slope indicating bearish momentum with downward price trajectory relative to logarithmic baseline
Zero Line Crosses: Signal transitions between bullish and bearish regimes, indicating potential trend changes
Long Entry Threshold Zone: Area above positive threshold (default 0.5) indicating confirmed bullish signals suitable for long positions
Short Entry Threshold Zone: Area below negative threshold (default -0.5) indicating confirmed bearish signals suitable for short positions
Extreme Values: Signals exceeding ±1.0 represent strong momentum conditions with higher probability of continuation
2. Momentum Confirmation and Visual Analysis
Signal Color Intensity: Gradient coloring shows signal strength, with brighter colors indicating stronger momentum
Bar Coloring: Optional price bar coloring matches signal direction for quick visual trend identification
Position Labels: Real-time position classification (Bullish/Bearish/Neutral) displayed on the latest bar
Momentum Weight Factor: When short-term log-return momentum aligns with LMA signal direction, the signal receives additional weight confirmation
Trend Quality Component: R-squared values weight the signal strength, with higher correlation indicating more reliable trend conditions
3. Examples: Preconfigured Settings
Default: Universally applicable configuration balanced for medium-term investing and general trading across multiple timeframes and asset classes.
Scalping: Highly responsive setup with shorter period and higher steepness for ultra-short-term trades on 1-15 minute charts, optimized for quick momentum shifts.
Swing Trading: Extended period with moderate steepness and increased smoothing for multi-day positions, designed to filter noise while capturing larger price swings on 1-4 hour and daily charts.
Trend Following: Maximum smoothing with lower steepness for established trend identification, generating fewer but more reliable signals optimal for daily and weekly timeframes.
Mean Reversion: Shorter period with high steepness for counter-trend strategies, more sensitive to extreme moves and reversal opportunities in ranging market conditions.

تنبؤ حركة الشارت (حجم وخطوط اتجاه)A forecast for the movement of the prices is helpful to add to the peviouse indicator

Volume bar range# Volume Bar Range (VBR) Indicator
## Overview
The Volume Bar Range indicator identifies key support and resistance levels based on high-volume price bars. It creates a visual range that represents significant price levels where the market has shown strong interest through volume confirmation.
## Features
### Visual Range Display
- **Blue/Aqua Area**: Shows the price range of the highest volume bar within the lookback period
- **Dynamic Color**: The fill color changes to indicate whether the range is stable (aqua) or newly updated (white)
- **Boundary Lines**: Invisible white lines mark the upper and lower boundaries of the range
### Trading Signals
- **BUY Signal**: Blue upward arrow appears when price breaks above the resistance level with volume confirmation
- **SELL Signal**: Black downward arrow appears when price breaks below the support level with volume confirmation
## How to Use
### Setup
1. Apply the indicator to any chart
2. The indicator automatically identifies the highest volume bar in the last 55 periods
3. The price range of this high-volume bar becomes your support/resistance zone
### Trading Strategy
- **Range Trading**: Trade within the identified support/resistance range
- **Breakout Trading**: Enter positions when price breaks above resistance (BUY) or below support (SELL)
- **Volume Confirmation**: Only take signals when current volume exceeds the 21-period average
### Signal Interpretation
- **BUY Signal**: Price closes above the resistance level with above-average volume
- **SELL Signal**: Price closes below the support level with above-average volume
- **No Signal**: Price remains within the range or volume is insufficient
## Key Parameters
- **Lookback Period**: 55 bars (automatically identifies the highest volume bar)
- **Volume MA**: 21-period simple moving average for volume confirmation
- **Signal Size**: Tiny markers to avoid chart clutter
## Best Practices
- Use on multiple timeframes for confirmation
- Combine with other technical indicators for stronger signals
- Pay attention to the color changes in the range area
- Consider market context and overall trend direction
## Ideal Markets
- Works well on liquid markets with consistent volume patterns
- Effective on stocks, forex, and crypto markets
- Best suited for swing trading and medium-term analysis
This indicator is particularly useful for traders who rely on volume analysis and want to identify key price levels where the market has shown significant interest.

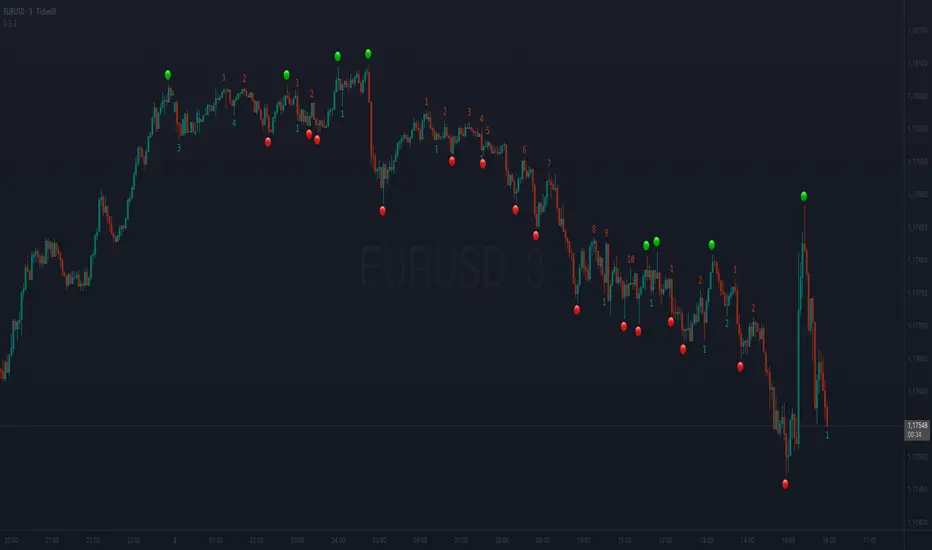
[eLm] 0-1-2# 📈 Market Structure Indicator – Counter System
This indicator dynamically analyzes price action to detect key market structure shifts and trend strength using four essential formations:
## 🔍 Detected Structures
- **Higher High (HH):** A candle forming a new high above recent peaks
- **Lower Low (LL):** A candle forming a new low below recent bottoms
- **Higher Low (HL):** A higher dip, indicating potential trend continuation
- **Lower High (LH):** A lower peak, signaling potential weakness
## 🧠 Structure Protection Logic
After a HH or LL is formed, if price does not breach that level within a user-defined number of candles, the level is considered **"protected."**
This provides insight into trend strength and market reaction.
## 🔢 HL / LH Counter System
- Each HL or LH increases a counter.
- A new HH or LL **resets** the corresponding counter to zero.
> This helps visualize how many consecutive HL or LH structures have occurred — useful for measuring trend momentum.
## 🎯 Use Cases
- Trend following and confirmation
- Early trend reversal detection
- Building structure-based trading strategies
- Understanding price behavior and market intent
---
> **Note:** This indicator does not provide financial advice. It is designed to support technical analysis with clear, structure-based visual signals.
AZ Dynamic Trend Indicator with Heikin-Ashi### Dynamic Trend Indicator with Heikin-Ashi (v2.7)
**Effortlessly identify trends and reversals** with this versatile tool combining multi-timeframe analysis, adaptive moving averages, and Heikin-Ashi smoothing. Here's what it offers:
#### 🔍 **Core Features**
1. **Dual Timeframe Analysis**:
- Track trends on higher timeframes (e.g., 1H/D) while viewing signals on your current chart.
- Toggle between **Heikin-Ashi** or standard candles for cleaner trend visualization.
2. **8 Customizable MAs**:
- Choose from **ALMA, HMA, SMA, SWMA, VWMA, WMA, ZLEMA, or EMA** with adjustable periods.
- Unique "Trend Strength" metric: `(MA_Close - MA_Open) / (MA_High - MA_Low)` highlights momentum direction.
3. **Smart Signals**:
- **Entry/Exit**: Triangles mark crossovers between MA Close/Open.
- **Reversal Alerts**: Detects counter-trend moves within a user-defined window (default: 3 bars) after signals.
- Color-coded plots: Bullish (🟢), Bearish (🔴), Reversal Bull (🔵), Reversal Bear (🟠).
#### 🎨 **Visual Customization**
- Toggle **High/Low MA lines**, **Close line**, and **fill colors**.
- Adjust colors for all elements to match your chart theme.
- Hide signals or reversal markers as needed.
#### ⚙️ **Practical Use**
- **Trend Following**: Use the MA Close/Open crossover with trend fill colors to confirm direction.
- **Reversal Trading**: Capitalize on pullbacks with reversal signals (e.g., after a bearish signal, watch for Bull Reversal markers).
- **Multi-Timeframe Confirmation**: Avoid false signals by aligning higher-timeframe trends with your entries.
*Ideal for swing traders and trend riders!*
**Note**: Adjust `MA Period`, `Reversal Window`, and `Trend Timeframe` for your strategy. Disable Heikin-Ashi in choppy markets for faster reactions.
---
*Code v2.7 updates: Optimized reversal logic, added ALMA/ZLEMA support, and enhanced visual controls.*

Omega Market Mood Meter [OmegaTools]The Omega Market Mood Meter is a precision-built sentiment oscillator that captures the market’s emotional intensity through a multi-layered RSI system. Designed for traders who seek to align with the market's true behavioral state, it blends momentum readings with a brand-new, rarely-seen innovation: the Sentiment-Weighted Moving Average (WMA-Ω)—a trend filter that dynamically adjusts to the market’s psychological tone.
🧠 Market Mood Oscillator
At its core, the Ω 3M oscillator aggregates three RSI-based components:
RSI(9) on close — captures short-term tension;
RSI(21) on HLC3 — balances medium-term positioning;
RSI(50) on HL2 — reflects long-term directional weight.
Each input is scaled and weighted to contribute to a final oscillator centered around zero, with ±50 and ±100 acting as key sentiment boundaries. When values exceed ±100, the market is likely reaching emotional extremes—zones that often precede reversals or require caution.
Visual features include:
Dynamic Background Highlighting: automatically emphasizes extreme sentiment zones.
Reference Lines: plotted at ±100, ±50, and 0 for fast sentiment interpretation.
🔥 WMA-Ω: Sentiment-Weighted Moving Average
The standout innovation of this tool is the Weighted Market Mood Moving Average, or WMA-Ω—a proprietary calculation that averages price using the absolute value of sentiment as its weighting force. This approach gives greater importance to price during periods of strong emotional conviction (either bullish or bearish), resulting in a context-aware trend filter that reacts only when sentiment truly matters.
This technique:
Filters noise during low-volatility or indecisive conditions;
Enhances reliability by reacting to meaningful sentiment surges;
Offers a more psychologically-adjusted trend baseline compared to traditional MAs.
Visually:
When price is above WMA-Ω, a semi-transparent bullish fill highlights underlying strength;
When below, a bearish fill reveals dominant downward sentiment.
This feature is unique among public TradingView tools and provides an edge in identifying trend quality with psychological context.
✅ How to Use
Extreme Sentiment Zones (±100): Use as contrarian warning zones or signal dampeners.
Crosses of WMA-Ω: Treat these as psychological trend confirmations; price above indicates structurally bullish sentiment and vice versa.
Range-bound Bias: Between ±50, sentiment may be indecisive; watch for breakout or alignment with WMA-Ω.
Advanced Confluence: Combine with other Omega tools (e.g., Ω Bias Forecaster, Ω IV Walls) for powerful regime-based strategies.
Omega Market Mood Meter is ideal for discretionary and systematic traders who want a clean, multi-timeframe sentiment readout and a cutting-edge weighted trend engine grounded in market psychology.


New MA Cross Strategy V6 By BRC Different MA added with resolution to improve performance using higher time frame

FinhedgesFinhedges is a professional-grade trend analysis tool designed for precision trading. Built for traders who demand clarity, accuracy, and reliability, this indicator empowers users with real-time market insights while maintaining a clean and user-friendly visual interface.
✅ Key Features:
📈 Advanced Trend Detection: Accurately identifies prevailing market trends to guide directional bias.
🟢🔴 Intelligent Signal System: Displays high-quality Buy and Sell signals optimized for both swing and intraday trading.
🧠 Smart Filtering Logic: Reduces noise and false signals for higher conviction entries.
📊 Customizable Trend Line: Visualizes trend direction clearly across all timeframes.
⏰ Built-in Alerts: Real-time notifications so you never miss a key opportunity.
📋 Optional Market Status Table: Provides a quick overview of trend and price data directly on the chart.

ZYTX GKDDThe ZYTX High-Sell Low-Buy Indicator Strategy is a trend-following indicator that integrates multiple indicator resonances. It demonstrates the perfect performance of an automated trading robot, truly achieving the high-sell low-buy strategy in trading.

Alt Market Index (Halving-Adjusted BTC Supply, EMA)
암호화폐 알트코인 시총 상위 125개를 모아서
나스닥 기반의 계산식을 활용한 알트코인지수125를 만들었습니다.
반감기에 따른 비트코인 하루 채굴량 갯수 추가까지 포함한 버전입니다.
일봉이 기준이 됩니다.
I created the Altcoin Index 125 by compiling the top 125 altcoins by market capitalization in the cryptocurrency market, using a calculation method based on the Nasdaq index.
This version also includes adjustments for Bitcoin’s halving events, reflecting changes in daily mining output. The index is based on daily candles.

ANDROMEDA - TrendSyncANDROMEDA - TrendSync
Pedro Canto - Portfolio Manager | CGA/CGE
OVERVIEW
Trend Sync is a multi-layered trend-following indicator designed to help traders identify high-probability trend continuation setups while avoiding low-quality entries caused by overbought or oversold market conditions.
This indicator combines the power of Moving Averages (MA), MACD , and a visual RSI-based filter to validate both trend direction and timing for entries. It's goal is simple: filter out noise and highlight only the most technically relevant buy and sell signals based on objective momentum and trend criteria.
---
WALKTHROUGH
This indicator is built for traders seeking to operate in the direction of established trends. It's core principle is to identify and validate current trend conditions, and then signal entry opportunities during pullbacks to key moving averages.
Trend identification is achieved through the alignment of two moving averages. When these MAs are crossed and angled in the same direction, they confirm that a trend is in progress. To double-confirm trend direction, the MACD histogram is used—only. When both the MAs and MACD are aligned in the same direction, then the trend is considered valid.
Once all trend criteria are met, a dynamic coloring system is activated to visually reinforce the trend across the candles and moving averages.
To avoid poor entries during market exhaustion, an RSI-based filter is used. This short-term RSI highlights overbought or oversold zones, helping traders filter trades in extreme price conditions.
Only when the trend is validated and price pulls back to one of the MAs will a buy/sell signal be triggered, aligning momentum, price action and timing into a single actionable setup.
This combination ensures that each component plays a specific role:
i) Moving Averages define the trend
ii) MACD validates it
iii) RSI filters noise
iv) Intrabar price action triggers entries
This synchronism helps improve decision-making and entry timing, especially for swing and intraday traders.
---
USE CASES
- Identifying trend continuation setups
- Filtering false signals during consolidation phases
- Avoiding trades in overbought or oversold zones
- Enhancing entry timing for both swing and intraday strategies
- Providing visual confirmation of trend strength and momentum alignment
---
KEY FEATURES
1. Dual Moving Average Setup
The indicator allows full customization of two moving averages (MA1 and MA2), supporting both EMA and SMA types. The slope of the longer MA (MA2) acts as an essential trend filter, ensuring signals are only generated when the market shows clear directional bias.
2. MACD Histogram Trend Confirmation
A classic MACD Histogram calculation is used to validate the momentum of the prevailing trend.
- Bullish Trend: Histogram > 0
- Bearish Trend: Histogram < 0
This step filters out counter-trend signals and ensures trades are aligned with momentum.
3. Intrabar Price Trigger
Unlike standard crossover systems, this indicator waits for intrabar price action to trigger entries:
- Buy Signal: Price crosses below one of the MAs during an uptrend (dip-buy logic)
- Sell Signal: Price crosses above one of the MAs during a downtrend (rally-sell logic)
This intrabar trigger improves entry timing and helps capture retracement-based opportunities.
4. RSI Visual Filter
A short-term RSI is plotted and color-coded to visually highlight overbought and oversold conditions, acting as a discretionary filter for users to avoid low-probability trades during exhaustion points.
5. Dynamic Coloring System
Bar Colors:
- Blue: Bullish trend
- Red: Bearish trend
- Orange: RSI Overbought/Oversold zones
MA Colors:
- Blue for bullish conditions
- Red for bearish conditions
- Gray for neutral/no-trend phases
6. Signal Markers and Alerts
Clear visual buy and sell markers are plotted directly on the chart.
Additionally, the indicator includes real-time alerts for both Buy and Sell signals, helping traders stay informed even when away from the screen.
---
INPUTS AND CUSTOMIZATION OPTIONS
- Moving Average Types: EMA or SMA for both MA1 and MA2.
- MACD Settings: Customizable fast, slow, and signal periods.
- RSI Settings: Source, length, and overbought/oversold levels fully adjustable.
- Color Customization: Adjust RSI zone colors to suit your chart theme.
---
DISCLAIMER
This indicator is a technical analysis tool designed for educational and informational purposes only. It should not be used as a standalone trading system. Always combine it with sound risk management, price action analysis, and, where applicable, fundamental context.
Past performance does not guarantee future results.

Turtle God Indicator (Đức Anh Trader)Description:
The Turtle God Indicator is a minimalist tool that provides quick visual feedback on the latest candle's momentum while remaining compliant with TradingView's visual guidelines.
🔹 The turtle appears only on the latest candle, keeping the chart clean and uncluttered.
🔹 Includes a 14-period Simple Moving Average (SMA) to help track trend direction.
🔹 Ideal for traders who want fun, subtle alerts without distracting overlays or indicators.
Inspired by Đức Anh Trader, this playful yet practical indicator is perfect for identifying momentum with a smile. 🐢

MEAN X VIBRATION(dynammic)This is a base example for using mean reversion in trading. the probability of sellers coming in on the 1.9-2.4 band is highly likely . use 1.2-0.9 as a smaller vibration.
key note universal laws are used in this. those who can see will see.


IU Fibonacci Levels For IntradayDESCRIPTION
This indicator draws intraday Fibonacci levels from the opening price of the day using percentage-based retracements. It helps traders identify potential intraday support and resistance zones derived from the day’s opening bias. The levels are dynamically calculated and displayed with optional labels and customizable colors, making it an effective tool for both breakout and mean-reversion intraday strategies.
USER INPUTS
Direction Of The Level
Choose whether to show Upside, Downside, or Both level sets based on your directional bias.
Show Labels of Levels
Option to enable or disable text labels displaying Fibonacci values and prices.
Individual Level Toggles & Colors
You can choose to show or hide each of the following Fibonacci levels and set their respective colors:
* 0.236
* 0.328
* 0.500
* 0.618
* 0.786
* 1.000
INDICATOR LOGIC
On the first bar of the session, the opening price is captured.
Fibonacci levels are then calculated above and below this open using percentage multipliers (for example, day\_open + (day\_open \* 0.236%) for the 0.236 level).
Depending on the selected direction, upside and/or downside levels are plotted.
Filled zones are drawn between levels to visually highlight key price zones.
Optionally, each level can be labeled with its Fibonacci value and price.
WHY IT IS UNIQUE
Unlike traditional swing-based Fibonacci retracements, this tool uses the day’s opening price as an anchor, specifically designed for intraday traders.
Allows traders to quickly visualize micro-support and resistance levels that adapt every day.
Highly customizable and easy to read, with filled level bands for better zone recognition.
Works independently of indicators like RSI, MACD, or moving averages – purely based on price action logic.
HOW USER CAN BENEFIT FROM IT
Spot precise intraday reversal zones or breakout regions.
Combine with price action or volume analysis for smarter entries.
Filter trades by choosing directional bias (Up Site, Down Site, or Both).
Set profit targets or stop-losses based on Fibonacci bands.
Works great for scalpers, day traders, and even short-term swing traders looking to align with opening price momentum.
Disclaimer
This indicator is not financial advice, it's for educational purposes only highlighting the power of coding( pine script) in TradingView, I am not a SEBI-registered advisor. Trading and investing involve risk, and you should consult with a qualified financial advisor before making any trading decisions. I do not guarantee profits or take responsibility for any losses you may incur.

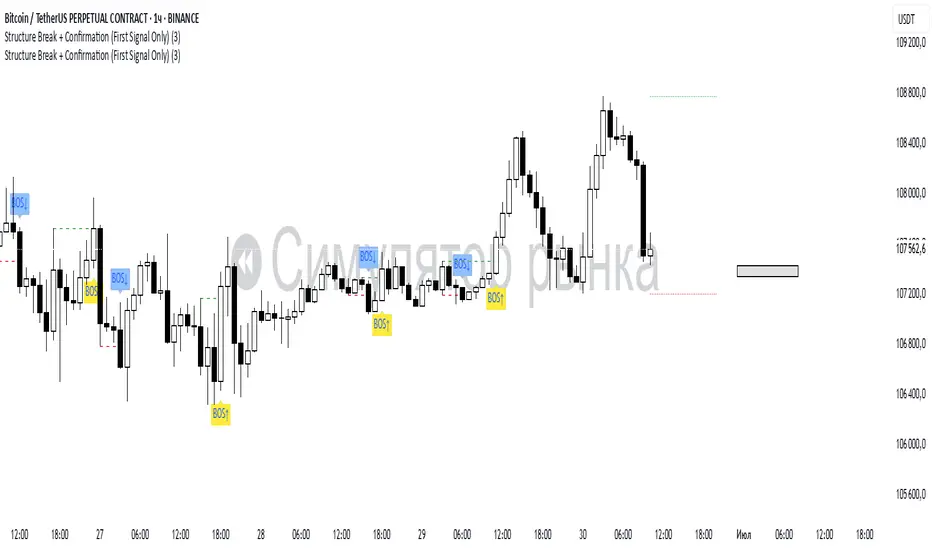
Structure Break + Confirmation (First Signal Only)Swing Detection:
A Swing High is detected when the high of the central candle (based on a lookback period) is greater than the highs of the candles before and after.
A Swing Low is detected when the low of the central candle is lower than the lows of the candles before and after.
Break of Structure (BOS):
A BOS Up is confirmed when a candle closes above the most recent swing high (with a body close).
A BOS Down is confirmed when a candle closes below the most recent swing low.
Confirmation (CONF):
A CONF Up is triggered when price makes a new high after a BOS Up.
A CONF Down is triggered when price makes a new low after a BOS Down.
Only the first confirmation after a BOS is plotted.
Visuals:
Cross marks (×) are plotted at swing points.
BOS signals are shown with green (up) and red (down) labels.
CONF signals are shown with lime (up) and orange (down) triangle markers.
Dotted lines are drawn at the levels of broken swing highs/lows.
Volume Exhaustion RSI Reversal StrategyKey Features:
Volume Logic:
1. Identifies two consecutive red bars (down periods) or green bars (up periods)
2. First down or up bars has the highest volume of the three
3. Volume decreases on the second down or up bars
4. Current (third) bar is green for up Reversal or red for down Reversal with higher volume than second bar
RSI Logic:
Uses standard 14-period RSI
Detects "V" shape pattern (decline, trough, rise)
Requires trough value <= 30 (oversold condition) or <= 70 (overbought condition)
Current bar shows RSI rising from trough
Execution:
Enters long/Short position when both volume and RSI conditions are met
Plots green "BUY/SELL" labels below the trigger candle
Visualization:
Green "BUY/SELL" labels appear below qualifying candles
Strategy positions shown in the strategy tester
How To Use:
Apply to any timeframe (works best on 5M-15M charts)
Combine with price action confirmation for example when candle 3 closes above candle 2 for "BUY" Or when Closes below for "SELL"
Ideal for oversold reversals in downtrends
Works best with volume-based assets
Note: The strategy enters at the close of the trigger candle. Always backtest before live trading and consider adding stop-loss protection.

Momentum CCI Trend Following StrategyMomentum CCI Trend Following Strategy
The Momentum CCI Trend Following Strategy leverages dual Commodity Channel Index (CCI) indicators to identify momentum-driven trends, offering both long and optional short trading capabilities. By combining a 50-period Long CCI for trend direction with a 5-period Short CCI for momentum signals, it provides clear entry and exit points for traders. The strategy supports two-way trading, allowing users to toggle short positions to capitalize on both bullish and bearish markets.
SETTINGS
Long CCI Period: Defines the period (default: 50) for the Long CCI, used to gauge the primary trend direction.
Short CCI Period : Sets the period (default: 5) for the Short CCI, used to detect momentum shifts.
Enable Short Order Book : A boolean toggle (default: false) to enable or disable short trading, allowing flexibility for long-only or two-way trading strategies.

15-Min ORB Indicator with Breakout Targets **What this indicator does:**
The 15-Min ORB (Opening Range Breakout) Indicator helps traders spot breakout trades by automatically detecting the high and low of the first 15 minutes after a session opens. It then monitors for breakouts above or below this range and plots dynamic take-profit levels based on your chosen multipliers.
**How it works:**
You set the start time for your session (hour and minute) in the settings.
The indicator marks the high and low during the first 15 minutes after your chosen open time, drawing lines on the chart and, if enabled, labels for these levels.
If price breaks above the 15-min high, a potential long breakout is identified; if it breaks below the low, a potential short breakout is detected.
Upon a breakout, the script calculates the distance from the entry (breakout) to the opposite side of the 15-min range and uses your input multipliers to project two take-profit levels (TP1/TP2).
All lines and labels (for the range and targets) can be individually toggled on or off in the settings.
Both the 15-min range and the targets can be styled (color, line style, label position).
**How to use it:**
Add the indicator to your chart.
Set the session start hour and minute to match your instrument’s open (e.g., 9:30 for US stocks or futures).
Use the settings to customize which levels and labels are shown, their appearance, and the target expansion multiples.
When price breaks out above or below the opening range, the script will plot TP1 and TP2 lines at your chosen risk/reward multiples, and label them if desired.
You can use the visual levels for trade entries, profit taking, or alerts.
**What makes it unique and useful:** >
Unlike many basic ORB indicators, this script not only marks the opening range but also tracks breakouts, auto-plots your profit targets based on range expansion, and gives you full control over display (styles, toggles, and label positions).
The TP targets are dynamic and can be set to any multiples, adapting to your risk/reward plan and breakout style.
Everything is customizable for your own session times, instrument, or trading approach.
**Typical uses:**
Intraday traders looking for clear breakout setups around the session open.
Automated R-multiple target planning for both long and short trades.
Visualizing volatility and measuring early price expansion.
