Price Acceleration Matrix [QuantAlgo]🟢 Overview
The Price Acceleration Matrix indicator is an advanced momentum analysis tool that measures the rate of change in price velocity across multiple timeframes simultaneously. It transforms raw price data into velocity measurements for each timeframe, then calculates the acceleration of these velocities to identify when momentum is building or deteriorating. By analyzing acceleration alignment across all three timeframes, the system can distinguish between strong directional moves (all timeframes accelerating in the same direction) and weak, choppy movements (mixed acceleration signals). This multi-timeframe acceleration matrix provides traders with early warning signals for momentum shifts, trend continuation and reversal opportunities across different timeframes and asset classes.
🟢 How It Works
The indicator employs a three-stage calculation process that transforms price data into actionable acceleration signals. First, it calculates velocity (rate of price change) for each of the three user-defined timeframes by measuring the percentage change in price over the specified lookback periods. These velocity calculations are normalized by their respective timeframe lengths to ensure fair comparison across different periods.
In the second stage, the system calculates acceleration by measuring the change in velocity from one bar to the next for each timeframe, effectively capturing the second derivative of price movement. This acceleration data reveals whether momentum is building (positive acceleration) or deteriorating (negative acceleration) at each timeframe level.
The final stage creates the acceleration matrix score by evaluating alignment across all three timeframes. When all timeframes show positive acceleration, the system averages them for maximum bullish signal strength. When all show negative acceleration, it averages them for maximum bearish signal strength. However, when acceleration signals are mixed across timeframes, the system applies a penalty by dividing the average by two, indicating consolidation or conflicting momentum forces. The resulting signal is then smoothed using an Exponential Moving Average and scaled to the -3 to +3 range using a user-defined threshold parameter.
🟢 How to Use
1. Signal Interpretation and Momentum Analysis
Positive Territory (Above Zero): Indicates accelerating upward momentum with bullish bias and favorable conditions for long positions
Negative Territory (Below Zero): Signals accelerating downward momentum with bearish bias and favorable conditions for short positions
Extreme Levels (±2 to ±3): Represent maximum acceleration alignment across all timeframes, indicating high-probability momentum continuation
Moderate Levels (±1 to ±2): Suggest building momentum with good timeframe alignment but less conviction than extreme readings
Near Zero (-0.5 to +0.5): Indicates mixed signals, consolidation, or momentum exhaustion requiring caution
2. Overbought/Oversold Zone Analysis
Above +2 (Overbought Zone): Markets showing extreme bullish acceleration may be due for profit-taking or short-term pullbacks
Below -2 (Oversold Zone): Markets showing extreme bearish acceleration may present reversal opportunities or bounce potential
Zone Exits: When acceleration retreats from extreme zones, it often signals momentum exhaustion and potential trend changes
🟢 Pro Tips for Trading
→ Early Momentum Detection: Watch for acceleration crossing above zero after periods of negative readings, as this often precedes major price movements by several bars, providing early entry opportunities before traditional indicators signal.
→ Momentum Exhaustion Signals: Exit or take profits when acceleration reaches extreme levels (±2.5 or higher) and begins to decline, even if price continues in the same direction, as momentum deterioration typically precedes price reversals.
→ Acceleration Divergence Strategy: Look for divergences between price highs/lows and acceleration peaks/troughs, as these often signal weakening momentum and potential reversal opportunities before they become apparent on price charts.
→ Threshold Optimization: Adjust the acceleration threshold based on asset volatility - higher thresholds (0.7-1.0) for volatile assets to reduce false signals, lower thresholds (0.3-0.5) for stable assets to maintain sensitivity.
→ Alert-Based Trading: Utilize the built-in alert system for bullish/bearish reversals (±2 level crosses) and trend changes (zero line crosses) to capture momentum shifts without constant chart monitoring, especially effective for swing trading approaches.
→ Risk Management Integration: Reduce position sizes when acceleration readings are weak (below ±1.0) and increase allocation when strong acceleration alignment occurs (above ±2.0), as signal strength correlates directly with probability of successful trades.
Pinescript

Markov Chain [3D] | FractalystWhat exactly is a Markov Chain?
This indicator uses a Markov Chain model to analyze, quantify, and visualize the transitions between market regimes (Bull, Bear, Neutral) on your chart. It dynamically detects these regimes in real-time, calculates transition probabilities, and displays them as animated 3D spheres and arrows, giving traders intuitive insight into current and future market conditions.
How does a Markov Chain work, and how should I read this spheres-and-arrows diagram?
Think of three weather modes: Sunny, Rainy, Cloudy.
Each sphere is one mode. The loop on a sphere means “stay the same next step” (e.g., Sunny again tomorrow).
The arrows leaving a sphere show where things usually go next if they change (e.g., Sunny moving to Cloudy).
Some paths matter more than others. A more prominent loop means the current mode tends to persist. A more prominent outgoing arrow means a change to that destination is the usual next step.
Direction isn’t symmetric: moving Sunny→Cloudy can behave differently than Cloudy→Sunny.
Now relabel the spheres to markets: Bull, Bear, Neutral.
Spheres: market regimes (uptrend, downtrend, range).
Self‑loop: tendency for the current regime to continue on the next bar.
Arrows: the most common next regime if a switch happens.
How to read: Start at the sphere that matches current bar state. If the loop stands out, expect continuation. If one outgoing path stands out, that switch is the typical next step. Opposite directions can differ (Bear→Neutral doesn’t have to match Neutral→Bear).
What states and transitions are shown?
The three market states visualized are:
Bullish (Bull): Upward or strong-market regime.
Bearish (Bear): Downward or weak-market regime.
Neutral: Sideways or range-bound regime.
Bidirectional animated arrows and probability labels show how likely the market is to move from one regime to another (e.g., Bull → Bear or Neutral → Bull).
How does the regime detection system work?
You can use either built-in price returns (based on adaptive Z-score normalization) or supply three custom indicators (such as volume, oscillators, etc.).
Values are statistically normalized (Z-scored) over a configurable lookback period.
The normalized outputs are classified into Bull, Bear, or Neutral zones.
If using three indicators, their regime signals are averaged and smoothed for robustness.
How are transition probabilities calculated?
On every confirmed bar, the algorithm tracks the sequence of detected market states, then builds a rolling window of transitions.
The code maintains a transition count matrix for all regime pairs (e.g., Bull → Bear).
Transition probabilities are extracted for each possible state change using Laplace smoothing for numerical stability, and frequently updated in real-time.
What is unique about the visualization?
3D animated spheres represent each regime and change visually when active.
Animated, bidirectional arrows reveal transition probabilities and allow you to see both dominant and less likely regime flows.
Particles (moving dots) animate along the arrows, enhancing the perception of regime flow direction and speed.
All elements dynamically update with each new price bar, providing a live market map in an intuitive, engaging format.
Can I use custom indicators for regime classification?
Yes! Enable the "Custom Indicators" switch and select any three chart series as inputs. These will be normalized and combined (each with equal weight), broadening the regime classification beyond just price-based movement.
What does the “Lookback Period” control?
Lookback Period (default: 100) sets how much historical data builds the probability matrix. Shorter periods adapt faster to regime changes but may be noisier. Longer periods are more stable but slower to adapt.
How is this different from a Hidden Markov Model (HMM)?
It sets the window for both regime detection and probability calculations. Lower values make the system more reactive, but potentially noisier. Higher values smooth estimates and make the system more robust.
How is this Markov Chain different from a Hidden Markov Model (HMM)?
Markov Chain (as here): All market regimes (Bull, Bear, Neutral) are directly observable on the chart. The transition matrix is built from actual detected regimes, keeping the model simple and interpretable.
Hidden Markov Model: The actual regimes are unobservable ("hidden") and must be inferred from market output or indicator "emissions" using statistical learning algorithms. HMMs are more complex, can capture more subtle structure, but are harder to visualize and require additional machine learning steps for training.
A standard Markov Chain models transitions between observable states using a simple transition matrix, while a Hidden Markov Model assumes the true states are hidden (latent) and must be inferred from observable “emissions” like price or volume data. In practical terms, a Markov Chain is transparent and easier to implement and interpret; an HMM is more expressive but requires statistical inference to estimate hidden states from data.
Markov Chain: states are observable; you directly count or estimate transition probabilities between visible states. This makes it simpler, faster, and easier to validate and tune.
HMM: states are hidden; you only observe emissions generated by those latent states. Learning involves machine learning/statistical algorithms (commonly Baum–Welch/EM for training and Viterbi for decoding) to infer both the transition dynamics and the most likely hidden state sequence from data.
How does the indicator avoid “repainting” or look-ahead bias?
All regime changes and matrix updates happen only on confirmed (closed) bars, so no future data is leaked, ensuring reliable real-time operation.
Are there practical tuning tips?
Tune the Lookback Period for your asset/timeframe: shorter for fast markets, longer for stability.
Use custom indicators if your asset has unique regime drivers.
Watch for rapid changes in transition probabilities as early warning of a possible regime shift.
Who is this indicator for?
Quants and quantitative researchers exploring probabilistic market modeling, especially those interested in regime-switching dynamics and Markov models.
Programmers and system developers who need a probabilistic regime filter for systematic and algorithmic backtesting:
The Markov Chain indicator is ideally suited for programmatic integration via its bias output (1 = Bull, 0 = Neutral, -1 = Bear).
Although the visualization is engaging, the core output is designed for automated, rules-based workflows—not for discretionary/manual trading decisions.
Developers can connect the indicator’s output directly to their Pine Script logic (using input.source()), allowing rapid and robust backtesting of regime-based strategies.
It acts as a plug-and-play regime filter: simply plug the bias output into your entry/exit logic, and you have a scientifically robust, probabilistically-derived signal for filtering, timing, position sizing, or risk regimes.
The MC's output is intentionally "trinary" (1/0/-1), focusing on clear regime states for unambiguous decision-making in code. If you require nuanced, multi-probability or soft-label state vectors, consider expanding the indicator or stacking it with a probability-weighted logic layer in your scripting.
Because it avoids subjectivity, this approach is optimal for systematic quants, algo developers building backtested, repeatable strategies based on probabilistic regime analysis.
What's the mathematical foundation behind this?
The mathematical foundation behind this Markov Chain indicator—and probabilistic regime detection in finance—draws from two principal models: the (standard) Markov Chain and the Hidden Markov Model (HMM).
How to use this indicator programmatically?
The Markov Chain indicator automatically exports a bias value (+1 for Bullish, -1 for Bearish, 0 for Neutral) as a plot visible in the Data Window. This allows you to integrate its regime signal into your own scripts and strategies for backtesting, automation, or live trading.
Step-by-Step Integration with Pine Script (input.source)
Add the Markov Chain indicator to your chart.
This must be done first, since your custom script will "pull" the bias signal from the indicator's plot.
In your strategy, create an input using input.source()
Example:
//@version=5
strategy("MC Bias Strategy Example")
mcBias = input.source(close, "MC Bias Source")
After saving, go to your script’s settings. For the “MC Bias Source” input, select the plot/output of the Markov Chain indicator (typically its bias plot).
Use the bias in your trading logic
Example (long only on Bull, flat otherwise):
if mcBias == 1
strategy.entry("Long", strategy.long)
else
strategy.close("Long")
For more advanced workflows, combine mcBias with additional filters or trailing stops.
How does this work behind-the-scenes?
TradingView’s input.source() lets you use any plot from another indicator as a real-time, “live” data feed in your own script (source).
The selected bias signal is available to your Pine code as a variable, enabling logical decisions based on regime (trend-following, mean-reversion, etc.).
This enables powerful strategy modularity : decouple regime detection from entry/exit logic, allowing fast experimentation without rewriting core signal code.
Integrating 45+ Indicators with Your Markov Chain — How & Why
The Enhanced Custom Indicators Export script exports a massive suite of over 45 technical indicators—ranging from classic momentum (RSI, MACD, Stochastic, etc.) to trend, volume, volatility, and oscillator tools—all pre-calculated, centered/scaled, and available as plots.
// Enhanced Custom Indicators Export - 45 Technical Indicators
// Comprehensive technical analysis suite for advanced market regime detection
//@version=6
indicator('Enhanced Custom Indicators Export | Fractalyst', shorttitle='Enhanced CI Export', overlay=false, scale=scale.right, max_labels_count=500, max_lines_count=500)
// |----- Input Parameters -----| //
momentum_group = "Momentum Indicators"
trend_group = "Trend Indicators"
volume_group = "Volume Indicators"
volatility_group = "Volatility Indicators"
oscillator_group = "Oscillator Indicators"
display_group = "Display Settings"
// Common lengths
length_14 = input.int(14, "Standard Length (14)", minval=1, maxval=100, group=momentum_group)
length_20 = input.int(20, "Medium Length (20)", minval=1, maxval=200, group=trend_group)
length_50 = input.int(50, "Long Length (50)", minval=1, maxval=200, group=trend_group)
// Display options
show_table = input.bool(true, "Show Values Table", group=display_group)
table_size = input.string("Small", "Table Size", options= , group=display_group)
// |----- MOMENTUM INDICATORS (15 indicators) -----| //
// 1. RSI (Relative Strength Index)
rsi_14 = ta.rsi(close, length_14)
rsi_centered = rsi_14 - 50
// 2. Stochastic Oscillator
stoch_k = ta.stoch(close, high, low, length_14)
stoch_d = ta.sma(stoch_k, 3)
stoch_centered = stoch_k - 50
// 3. Williams %R
williams_r = ta.stoch(close, high, low, length_14) - 100
// 4. MACD (Moving Average Convergence Divergence)
= ta.macd(close, 12, 26, 9)
// 5. Momentum (Rate of Change)
momentum = ta.mom(close, length_14)
momentum_pct = (momentum / close ) * 100
// 6. Rate of Change (ROC)
roc = ta.roc(close, length_14)
// 7. Commodity Channel Index (CCI)
cci = ta.cci(close, length_20)
// 8. Money Flow Index (MFI)
mfi = ta.mfi(close, length_14)
mfi_centered = mfi - 50
// 9. Awesome Oscillator (AO)
ao = ta.sma(hl2, 5) - ta.sma(hl2, 34)
// 10. Accelerator Oscillator (AC)
ac = ao - ta.sma(ao, 5)
// 11. Chande Momentum Oscillator (CMO)
cmo = ta.cmo(close, length_14)
// 12. Detrended Price Oscillator (DPO)
dpo = close - ta.sma(close, length_20)
// 13. Price Oscillator (PPO)
ppo = ta.sma(close, 12) - ta.sma(close, 26)
ppo_pct = (ppo / ta.sma(close, 26)) * 100
// 14. TRIX
trix_ema1 = ta.ema(close, length_14)
trix_ema2 = ta.ema(trix_ema1, length_14)
trix_ema3 = ta.ema(trix_ema2, length_14)
trix = ta.roc(trix_ema3, 1) * 10000
// 15. Klinger Oscillator
klinger = ta.ema(volume * (high + low + close) / 3, 34) - ta.ema(volume * (high + low + close) / 3, 55)
// 16. Fisher Transform
fisher_hl2 = 0.5 * (hl2 - ta.lowest(hl2, 10)) / (ta.highest(hl2, 10) - ta.lowest(hl2, 10)) - 0.25
fisher = 0.5 * math.log((1 + fisher_hl2) / (1 - fisher_hl2))
// 17. Stochastic RSI
stoch_rsi = ta.stoch(rsi_14, rsi_14, rsi_14, length_14)
stoch_rsi_centered = stoch_rsi - 50
// 18. Relative Vigor Index (RVI)
rvi_num = ta.swma(close - open)
rvi_den = ta.swma(high - low)
rvi = rvi_den != 0 ? rvi_num / rvi_den : 0
// 19. Balance of Power (BOP)
bop = (close - open) / (high - low)
// |----- TREND INDICATORS (10 indicators) -----| //
// 20. Simple Moving Average Momentum
sma_20 = ta.sma(close, length_20)
sma_momentum = ((close - sma_20) / sma_20) * 100
// 21. Exponential Moving Average Momentum
ema_20 = ta.ema(close, length_20)
ema_momentum = ((close - ema_20) / ema_20) * 100
// 22. Parabolic SAR
sar = ta.sar(0.02, 0.02, 0.2)
sar_trend = close > sar ? 1 : -1
// 23. Linear Regression Slope
lr_slope = ta.linreg(close, length_20, 0) - ta.linreg(close, length_20, 1)
// 24. Moving Average Convergence (MAC)
mac = ta.sma(close, 10) - ta.sma(close, 30)
// 25. Trend Intensity Index (TII)
tii_sum = 0.0
for i = 1 to length_20
tii_sum += close > close ? 1 : 0
tii = (tii_sum / length_20) * 100
// 26. Ichimoku Cloud Components
ichimoku_tenkan = (ta.highest(high, 9) + ta.lowest(low, 9)) / 2
ichimoku_kijun = (ta.highest(high, 26) + ta.lowest(low, 26)) / 2
ichimoku_signal = ichimoku_tenkan > ichimoku_kijun ? 1 : -1
// 27. MESA Adaptive Moving Average (MAMA)
mama_alpha = 2.0 / (length_20 + 1)
mama = ta.ema(close, length_20)
mama_momentum = ((close - mama) / mama) * 100
// 28. Zero Lag Exponential Moving Average (ZLEMA)
zlema_lag = math.round((length_20 - 1) / 2)
zlema_data = close + (close - close )
zlema = ta.ema(zlema_data, length_20)
zlema_momentum = ((close - zlema) / zlema) * 100
// |----- VOLUME INDICATORS (6 indicators) -----| //
// 29. On-Balance Volume (OBV)
obv = ta.obv
// 30. Volume Rate of Change (VROC)
vroc = ta.roc(volume, length_14)
// 31. Price Volume Trend (PVT)
pvt = ta.pvt
// 32. Negative Volume Index (NVI)
nvi = 0.0
nvi := volume < volume ? nvi + ((close - close ) / close ) * nvi : nvi
// 33. Positive Volume Index (PVI)
pvi = 0.0
pvi := volume > volume ? pvi + ((close - close ) / close ) * pvi : pvi
// 34. Volume Oscillator
vol_osc = ta.sma(volume, 5) - ta.sma(volume, 10)
// 35. Ease of Movement (EOM)
eom_distance = high - low
eom_box_height = volume / 1000000
eom = eom_box_height != 0 ? eom_distance / eom_box_height : 0
eom_sma = ta.sma(eom, length_14)
// 36. Force Index
force_index = volume * (close - close )
force_index_sma = ta.sma(force_index, length_14)
// |----- VOLATILITY INDICATORS (10 indicators) -----| //
// 37. Average True Range (ATR)
atr = ta.atr(length_14)
atr_pct = (atr / close) * 100
// 38. Bollinger Bands Position
bb_basis = ta.sma(close, length_20)
bb_dev = 2.0 * ta.stdev(close, length_20)
bb_upper = bb_basis + bb_dev
bb_lower = bb_basis - bb_dev
bb_position = bb_dev != 0 ? (close - bb_basis) / bb_dev : 0
bb_width = bb_dev != 0 ? (bb_upper - bb_lower) / bb_basis * 100 : 0
// 39. Keltner Channels Position
kc_basis = ta.ema(close, length_20)
kc_range = ta.ema(ta.tr, length_20)
kc_upper = kc_basis + (2.0 * kc_range)
kc_lower = kc_basis - (2.0 * kc_range)
kc_position = kc_range != 0 ? (close - kc_basis) / kc_range : 0
// 40. Donchian Channels Position
dc_upper = ta.highest(high, length_20)
dc_lower = ta.lowest(low, length_20)
dc_basis = (dc_upper + dc_lower) / 2
dc_position = (dc_upper - dc_lower) != 0 ? (close - dc_basis) / (dc_upper - dc_lower) : 0
// 41. Standard Deviation
std_dev = ta.stdev(close, length_20)
std_dev_pct = (std_dev / close) * 100
// 42. Relative Volatility Index (RVI)
rvi_up = ta.stdev(close > close ? close : 0, length_14)
rvi_down = ta.stdev(close < close ? close : 0, length_14)
rvi_total = rvi_up + rvi_down
rvi_volatility = rvi_total != 0 ? (rvi_up / rvi_total) * 100 : 50
// 43. Historical Volatility
hv_returns = math.log(close / close )
hv = ta.stdev(hv_returns, length_20) * math.sqrt(252) * 100
// 44. Garman-Klass Volatility
gk_vol = math.log(high/low) * math.log(high/low) - (2*math.log(2)-1) * math.log(close/open) * math.log(close/open)
gk_volatility = math.sqrt(ta.sma(gk_vol, length_20)) * 100
// 45. Parkinson Volatility
park_vol = math.log(high/low) * math.log(high/low)
parkinson = math.sqrt(ta.sma(park_vol, length_20) / (4 * math.log(2))) * 100
// 46. Rogers-Satchell Volatility
rs_vol = math.log(high/close) * math.log(high/open) + math.log(low/close) * math.log(low/open)
rogers_satchell = math.sqrt(ta.sma(rs_vol, length_20)) * 100
// |----- OSCILLATOR INDICATORS (5 indicators) -----| //
// 47. Elder Ray Index
elder_bull = high - ta.ema(close, 13)
elder_bear = low - ta.ema(close, 13)
elder_power = elder_bull + elder_bear
// 48. Schaff Trend Cycle (STC)
stc_macd = ta.ema(close, 23) - ta.ema(close, 50)
stc_k = ta.stoch(stc_macd, stc_macd, stc_macd, 10)
stc_d = ta.ema(stc_k, 3)
stc = ta.stoch(stc_d, stc_d, stc_d, 10)
// 49. Coppock Curve
coppock_roc1 = ta.roc(close, 14)
coppock_roc2 = ta.roc(close, 11)
coppock = ta.wma(coppock_roc1 + coppock_roc2, 10)
// 50. Know Sure Thing (KST)
kst_roc1 = ta.roc(close, 10)
kst_roc2 = ta.roc(close, 15)
kst_roc3 = ta.roc(close, 20)
kst_roc4 = ta.roc(close, 30)
kst = ta.sma(kst_roc1, 10) + 2*ta.sma(kst_roc2, 10) + 3*ta.sma(kst_roc3, 10) + 4*ta.sma(kst_roc4, 15)
// 51. Percentage Price Oscillator (PPO)
ppo_line = ((ta.ema(close, 12) - ta.ema(close, 26)) / ta.ema(close, 26)) * 100
ppo_signal = ta.ema(ppo_line, 9)
ppo_histogram = ppo_line - ppo_signal
// |----- PLOT MAIN INDICATORS -----| //
// Plot key momentum indicators
plot(rsi_centered, title="01_RSI_Centered", color=color.purple, linewidth=1)
plot(stoch_centered, title="02_Stoch_Centered", color=color.blue, linewidth=1)
plot(williams_r, title="03_Williams_R", color=color.red, linewidth=1)
plot(macd_histogram, title="04_MACD_Histogram", color=color.orange, linewidth=1)
plot(cci, title="05_CCI", color=color.green, linewidth=1)
// Plot trend indicators
plot(sma_momentum, title="06_SMA_Momentum", color=color.navy, linewidth=1)
plot(ema_momentum, title="07_EMA_Momentum", color=color.maroon, linewidth=1)
plot(sar_trend, title="08_SAR_Trend", color=color.teal, linewidth=1)
plot(lr_slope, title="09_LR_Slope", color=color.lime, linewidth=1)
plot(mac, title="10_MAC", color=color.fuchsia, linewidth=1)
// Plot volatility indicators
plot(atr_pct, title="11_ATR_Pct", color=color.yellow, linewidth=1)
plot(bb_position, title="12_BB_Position", color=color.aqua, linewidth=1)
plot(kc_position, title="13_KC_Position", color=color.olive, linewidth=1)
plot(std_dev_pct, title="14_StdDev_Pct", color=color.silver, linewidth=1)
plot(bb_width, title="15_BB_Width", color=color.gray, linewidth=1)
// Plot volume indicators
plot(vroc, title="16_VROC", color=color.blue, linewidth=1)
plot(eom_sma, title="17_EOM", color=color.red, linewidth=1)
plot(vol_osc, title="18_Vol_Osc", color=color.green, linewidth=1)
plot(force_index_sma, title="19_Force_Index", color=color.orange, linewidth=1)
plot(obv, title="20_OBV", color=color.purple, linewidth=1)
// Plot additional oscillators
plot(ao, title="21_Awesome_Osc", color=color.navy, linewidth=1)
plot(cmo, title="22_CMO", color=color.maroon, linewidth=1)
plot(dpo, title="23_DPO", color=color.teal, linewidth=1)
plot(trix, title="24_TRIX", color=color.lime, linewidth=1)
plot(fisher, title="25_Fisher", color=color.fuchsia, linewidth=1)
// Plot more momentum indicators
plot(mfi_centered, title="26_MFI_Centered", color=color.yellow, linewidth=1)
plot(ac, title="27_AC", color=color.aqua, linewidth=1)
plot(ppo_pct, title="28_PPO_Pct", color=color.olive, linewidth=1)
plot(stoch_rsi_centered, title="29_StochRSI_Centered", color=color.silver, linewidth=1)
plot(klinger, title="30_Klinger", color=color.gray, linewidth=1)
// Plot trend continuation
plot(tii, title="31_TII", color=color.blue, linewidth=1)
plot(ichimoku_signal, title="32_Ichimoku_Signal", color=color.red, linewidth=1)
plot(mama_momentum, title="33_MAMA_Momentum", color=color.green, linewidth=1)
plot(zlema_momentum, title="34_ZLEMA_Momentum", color=color.orange, linewidth=1)
plot(bop, title="35_BOP", color=color.purple, linewidth=1)
// Plot volume continuation
plot(nvi, title="36_NVI", color=color.navy, linewidth=1)
plot(pvi, title="37_PVI", color=color.maroon, linewidth=1)
plot(momentum_pct, title="38_Momentum_Pct", color=color.teal, linewidth=1)
plot(roc, title="39_ROC", color=color.lime, linewidth=1)
plot(rvi, title="40_RVI", color=color.fuchsia, linewidth=1)
// Plot volatility continuation
plot(dc_position, title="41_DC_Position", color=color.yellow, linewidth=1)
plot(rvi_volatility, title="42_RVI_Volatility", color=color.aqua, linewidth=1)
plot(hv, title="43_Historical_Vol", color=color.olive, linewidth=1)
plot(gk_volatility, title="44_GK_Volatility", color=color.silver, linewidth=1)
plot(parkinson, title="45_Parkinson_Vol", color=color.gray, linewidth=1)
// Plot final oscillators
plot(rogers_satchell, title="46_RS_Volatility", color=color.blue, linewidth=1)
plot(elder_power, title="47_Elder_Power", color=color.red, linewidth=1)
plot(stc, title="48_STC", color=color.green, linewidth=1)
plot(coppock, title="49_Coppock", color=color.orange, linewidth=1)
plot(kst, title="50_KST", color=color.purple, linewidth=1)
// Plot final indicators
plot(ppo_histogram, title="51_PPO_Histogram", color=color.navy, linewidth=1)
plot(pvt, title="52_PVT", color=color.maroon, linewidth=1)
// |----- Reference Lines -----| //
hline(0, "Zero Line", color=color.gray, linestyle=hline.style_dashed, linewidth=1)
hline(50, "Midline", color=color.gray, linestyle=hline.style_dotted, linewidth=1)
hline(-50, "Lower Midline", color=color.gray, linestyle=hline.style_dotted, linewidth=1)
hline(25, "Upper Threshold", color=color.gray, linestyle=hline.style_dotted, linewidth=1)
hline(-25, "Lower Threshold", color=color.gray, linestyle=hline.style_dotted, linewidth=1)
// |----- Enhanced Information Table -----| //
if show_table and barstate.islast
table_position = position.top_right
table_text_size = table_size == "Tiny" ? size.tiny : table_size == "Small" ? size.small : size.normal
var table info_table = table.new(table_position, 3, 18, bgcolor=color.new(color.white, 85), border_width=1, border_color=color.gray)
// Headers
table.cell(info_table, 0, 0, 'Category', text_color=color.black, text_size=table_text_size, bgcolor=color.new(color.blue, 70))
table.cell(info_table, 1, 0, 'Indicator', text_color=color.black, text_size=table_text_size, bgcolor=color.new(color.blue, 70))
table.cell(info_table, 2, 0, 'Value', text_color=color.black, text_size=table_text_size, bgcolor=color.new(color.blue, 70))
// Key Momentum Indicators
table.cell(info_table, 0, 1, 'MOMENTUM', text_color=color.purple, text_size=table_text_size, bgcolor=color.new(color.purple, 90))
table.cell(info_table, 1, 1, 'RSI Centered', text_color=color.purple, text_size=table_text_size)
table.cell(info_table, 2, 1, str.tostring(rsi_centered, '0.00'), text_color=color.purple, text_size=table_text_size)
table.cell(info_table, 0, 2, '', text_color=color.blue, text_size=table_text_size)
table.cell(info_table, 1, 2, 'Stoch Centered', text_color=color.blue, text_size=table_text_size)
table.cell(info_table, 2, 2, str.tostring(stoch_centered, '0.00'), text_color=color.blue, text_size=table_text_size)
table.cell(info_table, 0, 3, '', text_color=color.red, text_size=table_text_size)
table.cell(info_table, 1, 3, 'Williams %R', text_color=color.red, text_size=table_text_size)
table.cell(info_table, 2, 3, str.tostring(williams_r, '0.00'), text_color=color.red, text_size=table_text_size)
table.cell(info_table, 0, 4, '', text_color=color.orange, text_size=table_text_size)
table.cell(info_table, 1, 4, 'MACD Histogram', text_color=color.orange, text_size=table_text_size)
table.cell(info_table, 2, 4, str.tostring(macd_histogram, '0.000'), text_color=color.orange, text_size=table_text_size)
table.cell(info_table, 0, 5, '', text_color=color.green, text_size=table_text_size)
table.cell(info_table, 1, 5, 'CCI', text_color=color.green, text_size=table_text_size)
table.cell(info_table, 2, 5, str.tostring(cci, '0.00'), text_color=color.green, text_size=table_text_size)
// Key Trend Indicators
table.cell(info_table, 0, 6, 'TREND', text_color=color.navy, text_size=table_text_size, bgcolor=color.new(color.navy, 90))
table.cell(info_table, 1, 6, 'SMA Momentum %', text_color=color.navy, text_size=table_text_size)
table.cell(info_table, 2, 6, str.tostring(sma_momentum, '0.00'), text_color=color.navy, text_size=table_text_size)
table.cell(info_table, 0, 7, '', text_color=color.maroon, text_size=table_text_size)
table.cell(info_table, 1, 7, 'EMA Momentum %', text_color=color.maroon, text_size=table_text_size)
table.cell(info_table, 2, 7, str.tostring(ema_momentum, '0.00'), text_color=color.maroon, text_size=table_text_size)
table.cell(info_table, 0, 8, '', text_color=color.teal, text_size=table_text_size)
table.cell(info_table, 1, 8, 'SAR Trend', text_color=color.teal, text_size=table_text_size)
table.cell(info_table, 2, 8, str.tostring(sar_trend, '0'), text_color=color.teal, text_size=table_text_size)
table.cell(info_table, 0, 9, '', text_color=color.lime, text_size=table_text_size)
table.cell(info_table, 1, 9, 'Linear Regression', text_color=color.lime, text_size=table_text_size)
table.cell(info_table, 2, 9, str.tostring(lr_slope, '0.000'), text_color=color.lime, text_size=table_text_size)
// Key Volatility Indicators
table.cell(info_table, 0, 10, 'VOLATILITY', text_color=color.yellow, text_size=table_text_size, bgcolor=color.new(color.yellow, 90))
table.cell(info_table, 1, 10, 'ATR %', text_color=color.yellow, text_size=table_text_size)
table.cell(info_table, 2, 10, str.tostring(atr_pct, '0.00'), text_color=color.yellow, text_size=table_text_size)
table.cell(info_table, 0, 11, '', text_color=color.aqua, text_size=table_text_size)
table.cell(info_table, 1, 11, 'BB Position', text_color=color.aqua, text_size=table_text_size)
table.cell(info_table, 2, 11, str.tostring(bb_position, '0.00'), text_color=color.aqua, text_size=table_text_size)
table.cell(info_table, 0, 12, '', text_color=color.olive, text_size=table_text_size)
table.cell(info_table, 1, 12, 'KC Position', text_color=color.olive, text_size=table_text_size)
table.cell(info_table, 2, 12, str.tostring(kc_position, '0.00'), text_color=color.olive, text_size=table_text_size)
// Key Volume Indicators
table.cell(info_table, 0, 13, 'VOLUME', text_color=color.blue, text_size=table_text_size, bgcolor=color.new(color.blue, 90))
table.cell(info_table, 1, 13, 'Volume ROC', text_color=color.blue, text_size=table_text_size)
table.cell(info_table, 2, 13, str.tostring(vroc, '0.00'), text_color=color.blue, text_size=table_text_size)
table.cell(info_table, 0, 14, '', text_color=color.red, text_size=table_text_size)
table.cell(info_table, 1, 14, 'EOM', text_color=color.red, text_size=table_text_size)
table.cell(info_table, 2, 14, str.tostring(eom_sma, '0.000'), text_color=color.red, text_size=table_text_size)
// Key Oscillators
table.cell(info_table, 0, 15, 'OSCILLATORS', text_color=color.purple, text_size=table_text_size, bgcolor=color.new(color.purple, 90))
table.cell(info_table, 1, 15, 'Awesome Osc', text_color=color.blue, text_size=table_text_size)
table.cell(info_table, 2, 15, str.tostring(ao, '0.000'), text_color=color.blue, text_size=table_text_size)
table.cell(info_table, 0, 16, '', text_color=color.red, text_size=table_text_size)
table.cell(info_table, 1, 16, 'Fisher Transform', text_color=color.red, text_size=table_text_size)
table.cell(info_table, 2, 16, str.tostring(fisher, '0.000'), text_color=color.red, text_size=table_text_size)
// Summary Statistics
table.cell(info_table, 0, 17, 'SUMMARY', text_color=color.black, text_size=table_text_size, bgcolor=color.new(color.gray, 70))
table.cell(info_table, 1, 17, 'Total Indicators: 52', text_color=color.black, text_size=table_text_size)
regime_color = rsi_centered > 10 ? color.green : rsi_centered < -10 ? color.red : color.gray
regime_text = rsi_centered > 10 ? "BULLISH" : rsi_centered < -10 ? "BEARISH" : "NEUTRAL"
table.cell(info_table, 2, 17, regime_text, text_color=regime_color, text_size=table_text_size)
This makes it the perfect “indicator backbone” for quantitative and systematic traders who want to prototype, combine, and test new regime detection models—especially in combination with the Markov Chain indicator.
How to use this script with the Markov Chain for research and backtesting:
Add the Enhanced Indicator Export to your chart.
Every calculated indicator is available as an individual data stream.
Connect the indicator(s) you want as custom input(s) to the Markov Chain’s “Custom Indicators” option.
In the Markov Chain indicator’s settings, turn ON the custom indicator mode.
For each of the three custom indicator inputs, select the exported plot from the Enhanced Export script—the menu lists all 45+ signals by name.
This creates a powerful, modular regime-detection engine where you can mix-and-match momentum, trend, volume, or custom combinations for advanced filtering.
Backtest regime logic directly.
Once you’ve connected your chosen indicators, the Markov Chain script performs regime detection (Bull/Neutral/Bear) based on your selected features—not just price returns.
The regime detection is robust, automatically normalized (using Z-score), and outputs bias (1, -1, 0) for plug-and-play integration.
Export the regime bias for programmatic use.
As described above, use input.source() in your Pine Script strategy or system and link the bias output.
You can now filter signals, control trade direction/size, or design pairs-trading that respect true, indicator-driven market regimes.
With this framework, you’re not limited to static or simplistic regime filters. You can rigorously define, test, and refine what “market regime” means for your strategies—using the technical features that matter most to you.
Optimize your signal generation by backtesting across a universe of meaningful indicator blends.
Enhance risk management with objective, real-time regime boundaries.
Accelerate your research: iterate quickly, swap indicator components, and see results with minimal code changes.
Automate multi-asset or pairs-trading by integrating regime context directly into strategy logic.
Add both scripts to your chart, connect your preferred features, and start investigating your best regime-based trades—entirely within the TradingView ecosystem.
References & Further Reading
Ang, A., & Bekaert, G. (2002). “Regime Switches in Interest Rates.” Journal of Business & Economic Statistics, 20(2), 163–182.
Hamilton, J. D. (1989). “A New Approach to the Economic Analysis of Nonstationary Time Series and the Business Cycle.” Econometrica, 57(2), 357–384.
Markov, A. A. (1906). "Extension of the Limit Theorems of Probability Theory to a Sum of Variables Connected in a Chain." The Notes of the Imperial Academy of Sciences of St. Petersburg.
Guidolin, M., & Timmermann, A. (2007). “Asset Allocation under Multivariate Regime Switching.” Journal of Economic Dynamics and Control, 31(11), 3503–3544.
Murphy, J. J. (1999). Technical Analysis of the Financial Markets. New York Institute of Finance.
Brock, W., Lakonishok, J., & LeBaron, B. (1992). “Simple Technical Trading Rules and the Stochastic Properties of Stock Returns.” Journal of Finance, 47(5), 1731–1764.
Zucchini, W., MacDonald, I. L., & Langrock, R. (2017). Hidden Markov Models for Time Series: An Introduction Using R (2nd ed.). Chapman and Hall/CRC.
On Quantitative Finance and Markov Models:
Lo, A. W., & Hasanhodzic, J. (2009). The Heretics of Finance: Conversations with Leading Practitioners of Technical Analysis. Bloomberg Press.
Patterson, S. (2016). The Man Who Solved the Market: How Jim Simons Launched the Quant Revolution. Penguin Press.
TradingView Pine Script Documentation: www.tradingview.com
TradingView Blog: “Use an Input From Another Indicator With Your Strategy” www.tradingview.com
GeeksforGeeks: “What is the Difference Between Markov Chains and Hidden Markov Models?” www.geeksforgeeks.org
What makes this indicator original and unique?
- On‑chart, real‑time Markov. The chain is drawn directly on your chart. You see the current regime, its tendency to stay (self‑loop), and the usual next step (arrows) as bars confirm.
- Source‑agnostic by design. The engine runs on any series you select via input.source() — price, your own oscillator, a composite score, anything you compute in the script.
- Automatic normalization + regime mapping. Different inputs live on different scales. The script standardizes your chosen source and maps it into clear regimes (e.g., Bull / Bear / Neutral) without you micromanaging thresholds each time.
- Rolling, bar‑by‑bar learning. Transition tendencies are computed from a rolling window of confirmed bars. What you see is exactly what the market did in that window.
- Fast experimentation. Switch the source, adjust the window, and the Markov view updates instantly. It’s a rapid way to test ideas and feel regime persistence/switch behavior.
Integrate your own signals (using input.source())
- In settings, choose the Source . This is powered by input.source() .
- Feed it price, an indicator you compute inside the script, or a custom composite series.
- The script will automatically normalize that series and process it through the Markov engine, mapping it to regimes and updating the on‑chart spheres/arrows in real time.
Credits:
Deep gratitude to @RicardoSantos for both the foundational Markov chain processing engine and inspiring open-source contributions, which made advanced probabilistic market modeling accessible to the TradingView community.
Special thanks to @Alien_Algorithms for the innovative and visually stunning 3D sphere logic that powers the indicator’s animated, regime-based visualization.
Disclaimer
This tool summarizes recent behavior. It is not financial advice and not a guarantee of future results.

TCP | Market Session | Session Analyzer📌 TCP | Market Session Indicator | Crypto Version
A powerful, real-time market session visualization tool tailored for crypto traders. Track the heartbeat of Asia, Europe, and US trading hours directly on your chart with live session boxes, behavioral analysis, liquidity grab detection, and countdown timers. Know when the action starts, how the market behaves, and where the traps lie.
🔰 Introduction:
Trade the Right Hours with the Right Tools
Time matters in trading. Most significant moves happen during key sessions—and knowing when and how each session unfolds can give you a sharp edge. The TCP Market Session Indicator, developed by Trade City Pro (TCP), puts professional session tracking and behavioral insights at your fingertips.
Whether you're a scalper or swing trader, this indicator gives you the timing context to enter and exit trades with greater confidence and clarity.
🕒 Core Features
• Live Session Boxes :
Highlight active ranges during Asia, Europe, and US sessions with dynamic high/low updates.
• Session Start/End Labels :
Know exactly when each session begins and ends plotted clearly on your chart with context.
• Session Behavior Analysis :
At the end of each session, the indicator classifies the price action as:
- Trend Up
- Trend Down
- Consolidation
- Manipulation
• Liquidity Grab Detection: Automatically detects possible stop hunts (fake breakouts) and marks them on the chart with precision filters (volume, ATR, reversal).
• Session Countdown Table: A live dashboard showing:
- Current active session
- Time left in session
- Upcoming session and how many minutes until it starts
- Utility time converter (e.g. 90 min = 01:30)
• Vertical Session Lines: Visualize past and upcoming session boundaries with customizable history and future range.
• Multi-Day Support: Draw session ranges for previous, current, and future days for better backtesting and forecasting.
⚙️ Settings Panel
Customize everything to fit your trading style and schedule:
• Session Time Settings:
Set the opening and closing time for each session manually using UTC-based minute inputs.
→ For example, enter Asia Start: 0, Asia End: 480 for 00:00–08:00 UTC.
This gives full flexibility to adjust session hours to match your preferred market behavior.
• Enable or Disable Elements:
Toggle the visibility of each session (Asia, Europe, US), as well as:
- Session Boxes
- Countdown Table
- Session Lines
- Liquidity Grab Labels
• Timezone Selection:
Choose between using UTC or your chart’s local timezone for session calculations.
• Customization Options:
Select number of past and future days to draw session data
Adjust vertical line transparency
Fine-tune label offset and spacing for clean layout
📊 Smart Session Boxes
Each session box tracks high, low, open, and close in real time, providing visual clarity on market structure. Once a session ends, the box closes, and the behavior type is saved and labeled ideal for spotting patterns across sessions.
• Asia: Green Box
• Europe: Orange Box
• US: Blue Box
💡 Why Use This Tool?
• Perfect Timing: Don’t get chopped in low-liquidity hours. Focus on sessions where volume and volatility align.
• Pattern Recognition: Study how price behaves session-to-session to build better strategies.
• Trap Detection: Spot manipulation moves (liquidity grabs) early and avoid common retail pitfalls.
• Macro Session Mapping: Use as a foundational layer to align trades with market structure and news cycles.
🔍 Example Use Case
You're watching BTC at 12:45 UTC. The indicator tells you:
The Asia session just ended (label shows “Asia Session End: Trend Up”)
Europe session starts in 15 minutes
A liquidity grab just triggered at the previous high—label confirmed
Now you know who’s active, what the market just did, and what’s about to start—all in one glance.
✅ Why Traders Trust It
• Visual & Intuitive: Fully chart-based, no clutter, no guessing
• Crypto-Focused: Designed specifically for 24/7 crypto markets (not outdated forex models)
• Non-Repainting: All labels and boxes stay as printed—no tricks
• Reliable: Tested across multiple exchanges, pairs, and timeframes
🧩 Built by Trade City Pro (TCP)
The TCP Market Session Indicator is part of a suite of professional tools used by over 150,000 traders. It’s coded in Pine Script v6 for full compatibility with TradingView’s latest capabilities.
🔗 Resources
• Tutorial: Learn how to analyze sessions like a pro in our TradingView guide:
"TradeCityPro Academy: Session Mapping & Liquidity Traps"
• More Tools: Explore our full library of indicators on

SuperBody CandlesInspired by the original script by Gautam_Dixit.
Updated to the latest Pine Script v6, now featuring fully customizable color settings so users can tailor hues to their preference.
Description:
The Momentum Candle indicator highlights bars whose real body significantly exceeds the 15-period average. 'Super' bullish and bearish candles (body ≥ 1.5× avg) receive standout colors, while above-average and below-average bars are tinted differently to reflect momentum strength.
Directional Market Efficiency [QuantAlgo]🟢 Overview
The Directional Market Efficiency indicator is an advanced trend analysis tool that measures how efficiently price moves in a given direction relative to the total price movement over a specified period. Unlike traditional momentum oscillators that only measure price change magnitude, this indicator combines efficiency measurement with directional bias to provide a comprehensive view of market behavior ranging from -1 (perfectly efficient downward movement) to +1 (perfectly efficient upward movement).
The indicator transforms the classic Efficiency Ratio concept by incorporating directional bias, creating a normalized oscillator that simultaneously reveals trend strength, direction, and market regime (trending vs. ranging). This dual-purpose functionality helps traders and investors identify high-probability trend continuation opportunities while filtering out choppy, inefficient price movements that often lead to false signals and whipsaws.
🟢 How It Works
The indicator employs a sophisticated two-step calculation process that first measures pure efficiency, then applies directional weighting to create the final signal. The efficiency calculation compares the absolute net price change over a lookback period to the sum of all individual bar-to-bar price movements during that same period. This ratio reveals how much of the total price movement contributed to actual progress in a specific direction.
The directional component applies the mathematical sign of the net price change (positive for upward movement, negative for downward movement) to the efficiency ratio, creating values between -1 and +1. The resulting Directional Efficiency is then smoothed using an Exponential Moving Average to reduce noise while maintaining responsiveness. Additionally, the system incorporates a configurable threshold level that distinguishes between trending markets (high efficiency) and ranging markets (low efficiency), enabling regime-based analysis and strategy adaptation.
🟢 How to Use
1. Signal Interpretation and Market Regime Analysis
Positive Territory (Above Zero): Indicates efficient upward price movement with bullish directional bias and favorable conditions for long positions
Negative Territory (Below Zero): Signals efficient downward price movement with bearish directional bias and favorable conditions for short positions
High Absolute Values (±0.4 to ±1.0): Represent highly efficient trending conditions with strong directional conviction and reduced noise
Low Absolute Values (±0.1 to ±0.3): Suggest ranging or consolidating markets with inefficient price movement and increased whipsaw risk
Zero Line Crosses: Mark critical directional shifts and provide primary entry/exit signals for trend-following strategies
2. Threshold-Based Market Regime Classification
Above Threshold (Trending Markets): When efficiency exceeds the threshold level, markets are classified as trending, favoring momentum strategies
Below Threshold (Ranging Markets): When efficiency falls below the threshold, markets are classified as ranging, favoring mean reversion approaches
3. Preset Configurations for Different Trading Styles
Default
Universally applicable configuration optimized for medium-term analysis across multiple timeframes and asset classes, providing balanced sensitivity and noise filtering.
Scalping
Highly responsive setup for ultra-short-term trades with increased sensitivity to quick efficiency changes. Best suited for 1-15 minute charts and rapid-fire trading approaches.
Swing Trading
Designed for multi-day position holding with enhanced noise filtering and focus on sustained efficiency trends. Optimal for 1-4 hour and daily timeframe analysis.
🟢 Pro Tips for Trading and Investing
→ Trend Continuation Filter: Enter long positions when Directional Efficiency crosses above zero in trending markets (above threshold) and short positions when crossing below zero, ensuring alignment with efficient price movement.
→ Range Trading Optimization: In ranging markets (below threshold), take profits on extreme readings and enter mean reversion trades when efficiency approaches zero from either direction.
→ Multi-Timeframe Confluence: Combine higher timeframe trend direction with lower timeframe efficiency signals for optimal entry timing.
→ Risk Management Enhancement: Reduce position sizes or avoid new entries when efficiency readings are weak (near zero), as these conditions indicate higher probability of choppy, unpredictable price movement.
→ Signal Strength Assessment: Prioritize trades with high absolute efficiency values (±0.4 or higher) as these represent the most reliable directional moves with reduced likelihood of immediate reversal.
→ Regime Transition Trading: Watch for efficiency threshold breaks combined with directional changes as these often mark significant trend initiation or termination points requiring strategic position adjustments.
→ Alert Integration: Utilize the built-in alert system for real time notifications of zero-line crosses, threshold breaks, and regime changes to maintain constant market awareness without continuous chart monitoring.

Fair Value Trend Model [SiDec]ABSTRACT
This pine script introduces the Fair Value Trend Model, an on-chart indicator for TradingView that constructs a continuously updating "fair-value" estimate of an asset's price via a logarithmic regression on historical data. Specifically, this model has been applied to Bitcoin (BTC) to fully grasp its fair value in the cryptocurrency market. Symmetric channel bands, defined by fixed percentage offsets around this central fair-value curve, provide a visual band within which normal price fluctuations may occur. Additionally, a short-term projection extends both the fair-value trend and its channel bands forward by a user-specified number of bars.
INTRODUCTION
Technical analysts frequently seek to identify an underlying equilibrium or "fair value" about which prices oscillate. Traditional approaches-moving averages, linear regressions in price-time space, or midlines-capture linear trends but often misrepresent the exponential or power-law growth patterns observable in many financial markets. The Fair Value Trend Model addresses this by performing an ordinary least squares (OLS) regression in log-space, fitting ln(Price) against ln(Days since inception). In practice, the primary application has been to Bitcoin, aiming to fully capture Bitcoin's underlying value dynamics.
The result is a curved trend line in regular (price-time) coordinates, reflecting Bitcoin's long-term compounding characteristics. Surrounding this fair-value curve, symmetric bands at user-specified percentage deviations serve as dynamic support and resistance levels. A simple linear projection extends both the central fair-value and its bands into the immediate future, providing traders with a heuristic for short-term trend continuation.
This exposition details:
Data transformation: converting bar timestamps into days since first bar, then applying natural logarithms to both time and price.
Regression mechanics: incremental (or rolling-window) accumulation of sums to compute the log-space fit parameters.
Fair-value reconstruction: exponentiation of the regression output to yield a price-space estimate.
Channel-band definition: establishing ±X% offsets around the fair-value curve and rendering them visually.
Forecasting methodology: projecting both the fair-value trend and channel bands by extrapolating the most recent incremental change in price-space.
Interpretation: how traders can leverage this model for trend identification, mean-reversion setups, and breakout analysis, particularly in Bitcoin trading.
Analysing the macro cycle on Bitcoin's monthly timeframe illustrates how the fair-value curve aligns with multi-year structural turning points.
DATA TRANSFORMATION AND NOTATION
1. Timestamp Baseline (t0)
Let t0 = timestamp of the very first bar on the chart (in milliseconds). Each subsequent bar has a timestamp ti, where ti ≥ t0.
2. Days Since Inception (d(t))
Define the “days since first bar” as
d(t) = max(1, (t − t0) / 86400000.0)
Here, 86400000.0 represents the number of milliseconds in one day (1,000 ms × 60 seconds × 60 minutes × 24 hours). The lower bound of 1 ensures that we never compute ln(0).
3. Logarithmic Coordinates:
Given the bar’s closing price P(t), define:
xi = ln( d(ti) )
yi = ln( P(ti) )
Thus, each data point is transformed to (xi, yi) in log‐space.
REGRESSION FORMULATION
We assume a log‐linear relationship:
yi = a + b·xi + εi
where εi is the residual error at bar i. Ordinary least squares (OLS) fitting minimizes the sum of squared residuals over N data points. Define the following accumulated sums:
Sx = Σ for i = 1 to N
Sy = Σ for i = 1 to N
Sxy = Σ for i = 1 to N
Sx2 = Σ for i = 1 to N
N = number of data points
The OLS estimates for b (slope) and a (intercept) are:
b = ( N·Sxy − Sx·Sy ) / ( N·Sx2 − (Sx)^2 )
a = ( Sy − b·Sx ) / N
All‐Time Versus Rolling‐Window Mode:
All-Time Mode:
Each new bar increments N by 1.
Update Sx ← Sx + xN, Sy ← Sy + yN, Sxy ← Sxy + xN·yN, Sx2 ← Sx2 + xN^2.
Recompute a and b using the formulas above on the entire dataset.
Rolling-Window Mode:
Fix a window length W. Maintain two arrays holding the most recent W values of {xi} and {yi}.
On each new bar N:
Append (xN, yN) to the arrays; add xN, yN, xN·yN, xN^2 to the sums Sx, Sy, Sxy, Sx2.
If the arrays’ length exceeds W, remove the oldest point (xN−W, yN−W) and subtract its contributions from the sums.
Update N_roll = min(N, W).
Compute b and a using N_roll, Sx, Sy, Sxy, Sx2 as above.
This incremental approach requires only O(1) operations per bar instead of recomputing sums from scratch, making it computationally efficient for long time series.
FAIR‐VALUE RECONSTRUCTION
Once coefficients (a, b) are obtained, the regressed log‐price at time t is:
ŷ(t) = a + b·ln( d(t) )
Mapping back to price space yields the “fair‐value”:
F(t) = exp( ŷ(t) )
= exp( a + b·ln( d(t) ) )
= exp(a) · ^b
In other words, F(t) is a power‐law function of “days since inception,” with exponent b and scale factor C = exp(a). Special cases:
If b = 1, F(t) = C · d(t), which is an exponential function in original time.
If b > 1, the fair‐value grows super‐linearly (accelerating compounding).
If 0 < b < 1, it grows sub‐linearly.
If b < 0, the fair‐value declines over time.
CHANNEL‐BAND DEFINITION
To visualise a “normal” range around the fair‐value curve F(t), we define two channel bands at fixed percentage offsets:
1. Upper Channel Band
U(t) = F(t) · (1 + α_upper)
where α_upper = (Channel Band Upper %) / 100.
2. Lower Channel Band
L(t) = F(t) · (1 − α_lower)
where α_lower = (Channel Band Lower %) / 100.
For example, default values of 50% imply α_upper = α_lower = 0.50, so:
U(t) = 1.50 · F(t)
L(t) = 0.50 · F(t)
When “Show FV Channel Bands” is enabled, both U(t) and L(t) are plotted in a neutral grey, and a semi‐transparent fill is drawn between them to emphasise the channel region.
SHORT‐TERM FORECAST PROJECTION
To extend both the fair‐value and its channel bands M bars into the future, the model uses a simple constant‐increment extrapolation in price space. The procedure is:
1. Compute Recent Increments
Let
F_prev = F( t_{N−1} )
F_curr = F( t_N )
Then define the per‐bar change in fair‐value:
ΔF = F_curr − F_prev
Similarly, for channel bands:
U_prev = U( t_{N−1} ), U_curr = U( t_N ), ΔU = U_curr − U_prev
L_prev = L( t_{N−1} ), L_curr = L( t_N ), ΔL = L_curr − L_prev
2. Forecasted Values After M Bars
Assuming the same per‐bar increments continue:
F_future = F_curr + M · ΔF
U_future = U_curr + M · ΔU
L_future = L_curr + M · ΔL
These forecasted values produce dashed lines on the chart:
A dashed segment from (bar_N, F_curr) to (bar_{N+M}, F_future).
Dashed segments from (bar_N, U_curr) to (bar_{N+M}, U_future), and from (bar_N, L_curr) to (bar_{N+M}, L_future).
Forecasted channel bands are rendered in a subdued grey to distinguish them from the current solid bands. Because this method does not re‐estimate regression coefficients for future t > t_N, it serves as a quick visual heuristic of trend continuation rather than a precise statistical forecast.
MATHEMATICAL SUMMARY
Summarising all key formulas:
1. Days Since Inception
d(t_i) = max( 1, ( t_i − t0 ) / 86400000.0 )
x_i = ln( d(t_i) )
y_i = ln( P(t_i) )
2. Regression Summations (for i = 1..N)
Sx = Σ
Sy = Σ
Sxy = Σ
Sx2 = Σ
N = number of data points (or N_roll if using rolling‐window)
3. OLS Estimator
b = ( N · Sxy − Sx · Sy ) / ( N · Sx2 − (Sx)^2 )
a = ( Sy − b · Sx ) / N
4. Fair‐Value Computation
ŷ(t) = a + b · ln( d(t) )
F(t) = exp( ŷ(t) ) = exp(a) · ^b
5. Channel Bands
U(t) = F(t) · (1 + α_upper)
L(t) = F(t) · (1 − α_lower)
with α_upper = (Channel Band Upper %) / 100, α_lower = (Channel Band Lower %) / 100.
6. Forecast Projection
ΔF = F_curr − F_prev
F_future = F_curr + M · ΔF
ΔU = U_curr − U_prev
U_future = U_curr + M · ΔU
ΔL = L_curr − L_prev
L_future = L_curr + M · ΔL
IMPLEMENTATION CONSIDERATIONS
1. Time Precision
Timestamps are recorded in milliseconds. Dividing by 86400000.0 yields days with fractional precision.
For the very first bar, d(t) = 1 ensures x = ln(1) = 0, avoiding an undefined logarithm.
2. Incremental Versus Sliding Summation
All‐Time Mode: Uses persistent scalar variables (Sx, Sy, Sxy, Sx2, N). On each new bar, add the latest x and y contributions to the sums.
Rolling‐Window Mode: Employs fixed‐length arrays for {x_i} and {y_i}. On each bar, append (x_N, y_N) and update sums; if array length exceeds W, remove the oldest element and subtract its contribution from the sums. This maintains exact sums over the most recent W data points without recomputing from scratch.
3. Numerical Robustness
If the denominator N·Sx2 − (Sx)^2 equals zero (e.g., all x_i identical, as when only one day has passed), then set b = 0 and a = Sy / N. This produces a constant fair‐value F(t) = exp(a).
Enforcing d(t) ≥ 1 avoids attempts to compute ln(0).
4. Plotting Strategy
The fair‐value line F(t) is plotted on each new bar. Its color depends on whether the current price P(t) is above or below F(t): a “bullish” color (e.g., green) when P(t) ≥ F(t), and a “bearish” color (e.g., red) when P(t) < F(t).
The channel bands U(t) and L(t) are plotted in a neutral grey when enabled; otherwise they are set to “not available” (no plot).
A semi‐transparent fill is drawn between U(t) and L(t). Because the fill function is executed at global scope, it is automatically suppressed if either U(t) or L(t) is not plotted (na).
5. Forecast Line Management
Each projection line (for F, U, and L) is created via a persistent line object. On successive bars, the code updates the endpoints of the same line rather than creating a new one each time, preserving chart clarity.
If forecasting is disabled, any existing projection lines are deleted to avoid cluttering the chart.
INTERPRETATION AND APPLICATIONS
1. Trend Identification
The fair‐value curve F(t) represents the best‐fit long‐term trend under the assumption that ln(Price) scales linearly with ln(Days since inception). By capturing power‐law or exponential patterns, it can more accurately reflect underlying compounding behavior than simple linear regressions.
When actual price P(t) lies above U(t), it may be considered “overextended” relative to its long‐term trend; when price falls below L(t), it may be deemed “oversold.” These conditions can signal potential mean‐reversion or breakout opportunities.
2. Mean‐Reversion and Breakout Signals
If price re‐enters the channel after touching or slightly breaching L(t), some traders interpret this as a mean‐reversion bounce and consider initiating a long position.
Conversely, a sustained move above U(t) can indicate strong upward momentum and a possible bullish breakout. Traders often seek confirmation (e.g., price remaining above U(t) for multiple bars, rising volume, or corroborating momentum indicators) before acting.
3. Rolling Versus All‐Time Usage
All‐Time Mode: Captures the entire dataset since inception, focusing on structural, long‐term trends. It is less sensitive to short‐term noise or volatility spikes.
Rolling‐Window Mode: Restricts the regression to the most recent W bars, making the fair‐value curve more responsive to changing market regimes, sudden volatility expansions, or fundamental shifts. Traders who wish to align the model with local behaviour often choose W so that it approximates a market cycle length (e.g., 100–200 bars on a daily chart).
4. Channel Percentage Selection
A wider band (e.g., ±50 %) accommodates larger price swings, reducing the frequency of breaches but potentially delaying actionable signals.
A narrower band (e.g., ±10 %) yields more frequent “overbought/oversold” alerts but may produce more false signals during normal volatility. It is advisable to calibrate the channel width to the asset’s historical volatility regime.
5. Forecast Cautions
The short‐term projection assumes that the last single‐bar increment ΔF remains constant for M bars. In reality, trend acceleration or deceleration can occur, rendering the linear forecast inaccurate.
As such, the forecast serves as a visual guide rather than a statistically rigorous prediction. It is best used in conjunction with other momentum, volume, or volatility indicators to confirm trend continuation or reversal.
LIMITATIONS AND CONSIDERATIONS
1. Power‐Law Assumption
By fitting ln(P) against ln(d), the model posits that P(t) ≈ C · ^b. Real markets may deviate from a pure power‐law, especially around significant news events or structural regime changes. Temporary misalignment can occur.
2. Fixed Channel Width
Markets exhibit heteroskedasticity: volatility can expand or contract unpredictably. A static ±X % band does not adapt to changing volatility. During high‐volatility periods, a fixed ±50 % may prove too narrow and be breached frequently; in unusually calm periods, it may be excessively broad, masking meaningful variations.
3. Endpoint Sensitivity
Regression‐based indicators often display greater curvature near the most recent data, especially under rolling‐window mode. This can create sudden “jumps” in F(t) when new bars arrive, potentially confusing users who expect smoother behaviour.
4. Forecast Simplification
The projection does not re‐estimate regression slope b for future times. It only extends the most recent single‐bar change. Consequently, it should be regarded as an indicative extension rather than a precise forecast.
PRACTICAL IMPLEMENTATION ON TRADINGVIEW
1 Adding the Indicator
In TradingView’s “Indicators” dialog, search for Fair Value Trend Model or visit my profile, under "scripts" add it to your chart.
Add it to any chart (e.g., BTCUSD, AAPL, EURUSD) to see real‐time computation.
2. Configuring Inputs
Show Forecast Line: Toggle on or off the dashed projection of the fair‐value.
Forecast Bars: Choose M, the number of bars to extend into the future (default is often 30).
Forecast Line Colour: Select a high‐contrast colour (e.g., yellow).
Bullish FV Colour / Bearish FV Colour: Define the colour of the fair‐value line when price is above (e.g., green) or below it (e.g., red).
Show FV Channel Bands: Enable to display the grey channel bands around the fair‐value.
Channel Band Upper % / Channel Band Lower %: Set α_upper and α_lower as desired (defaults of 50 % create a ±50 % envelope).
Use Rolling Window?: Choose whether to restrict the regression to recent data.
Window Bars: If rolling mode is enabled, designate W, the number of bars to include.
3. Visual Output
The central curve F(t) appears on the price chart, coloured green when P(t) ≥ F(t) and red when P(t) < F(t).
If channel bands are enabled, the chart shows two grey lines U(t) and L(t) and a subtle shading between them.
If forecasting is active, dashed extensions of F(t), U(t), and L(t) appear, projecting forward by M bars in neutral hues.
CONCLUSION
The Fair Value Trend Model furnishes traders with a mathematically principled estimate of an asset’s equilibrium price curve by fitting a log‐linear regression to historical data. Its channel bands delineate a normal corridor of fluctuation based on fixed percentage offsets, while an optional short‐term projection offers a visual approximation of trend continuation.
By operating in log‐space, the model effectively captures exponential or power‐law growth patterns that linear methods overlook. Rolling‐window capability enables responsiveness to regime shifts, whereas all‐time mode highlights broader structural trends. Nonetheless, users should remain mindful of the model’s assumptions—particularly the power‐law form and fixed band percentages—and employ the forecast projection as a supplemental guide rather than a standalone predictor.
When combined with complementary indicators (e.g., volatility measures, momentum oscillators, volume analysis) and robust risk management, the Fair Value Trend Model can enhance market timing, mean‐reversion identification, and breakout detection across diverse trading environments.
REFERENCES
Draper, N. R., & Smith, H. (1998). Applied Regression Analysis (3rd ed.). Wiley.
Tsay, R. S. (2014). Introductory Time Series with R (2nd ed.). Springer.
Hull, J. C. (2017). Options, Futures, and Other Derivatives (10th ed.). Pearson.
These references provide background on regression, time-series analysis, and financial modeling.

Volume Block Order AnalyzerCore Concept
The Volume Block Order Analyzer is a sophisticated Pine Script strategy designed to detect and analyze institutional money flow through large block trades. It identifies unusually high volume candles and evaluates their directional bias to provide clear visual signals of potential market movements.
How It Works: The Mathematical Model
1. Volume Anomaly Detection
The strategy first identifies "block trades" using a statistical approach:
```
avgVolume = ta.sma(volume, lookbackPeriod)
isHighVolume = volume > avgVolume * volumeThreshold
```
This means a candle must have volume exceeding the recent average by a user-defined multiplier (default 2.0x) to be considered a significant block trade.
2. Directional Impact Calculation
For each block trade identified, its price action determines direction:
- Bullish candle (close > open): Positive impact
- Bearish candle (close < open): Negative impact
The magnitude of impact is proportional to the volume size:
```
volumeWeight = volume / avgVolume // How many times larger than average
blockImpact = (isBullish ? 1.0 : -1.0) * (volumeWeight / 10)
```
This creates a normalized impact score typically ranging from -1.0 to 1.0, scaled by dividing by 10 to prevent excessive values.
3. Cumulative Impact with Time Decay
The key innovation is the cumulative impact calculation with decay:
```
cumulativeImpact := cumulativeImpact * impactDecay + blockImpact
```
This mathematical model has important properties:
- Recent block trades have stronger influence than older ones
- Impact gradually "fades" at rate determined by decay factor (default 0.95)
- Sustained directional pressure accumulates over time
- Opposing pressure gradually counteracts previous momentum
Trading Logic
Signal Generation
The strategy generates trading signals based on momentum shifts in institutional order flow:
1. Long Entry Signal: When cumulative impact crosses from negative to positive
```
if ta.crossover(cumulativeImpact, 0)
strategy.entry("Long", strategy.long)
```
*Logic: Institutional buying pressure has overcome selling pressure, indicating potential upward movement*
2. Short Entry Signal: When cumulative impact crosses from positive to negative
```
if ta.crossunder(cumulativeImpact, 0)
strategy.entry("Short", strategy.short)
```
*Logic: Institutional selling pressure has overcome buying pressure, indicating potential downward movement*
3. Exit Logic: Positions are closed when the cumulative impact moves against the position
```
if cumulativeImpact < 0
strategy.close("Long")
```
*Logic: The original signal is no longer valid as institutional flow has reversed*
Visual Interpretation System
The strategy employs multiple visualization techniques:
1. Color Gradient Bar System:
- Deep green: Strong buying pressure (impact > 0.5)
- Light green: Moderate buying pressure (0.1 < impact ≤ 0.5)
- Yellow-green: Mild buying pressure (0 < impact ≤ 0.1)
- Yellow: Neutral (impact = 0)
- Yellow-orange: Mild selling pressure (-0.1 < impact ≤ 0)
- Orange: Moderate selling pressure (-0.5 < impact ≤ -0.1)
- Red: Strong selling pressure (impact ≤ -0.5)
2. Dynamic Impact Line:
- Plots the cumulative impact as a line
- Line color shifts with impact value
- Line movement shows momentum and trend strength
3. Block Trade Labels:
- Marks significant block trades directly on the chart
- Shows direction and volume amount
- Helps identify key moments of institutional activity
4. Information Dashboard:
- Current impact value and signal direction
- Average volume benchmark
- Count of significant block trades
- Min/Max impact range
Benefits and Use Cases
This strategy provides several advantages:
1. Institutional Flow Detection: Identifies where large players are positioning themselves
2. Early Trend Identification: Often detects institutional accumulation/distribution before major price movements
3. Market Context Enhancement: Provides deeper insight than simple price action alone
4. Objective Decision Framework: Quantifies what might otherwise be subjective observations
5. Adaptive to Market Conditions: Works across different timeframes and instruments by using relative volume rather than absolute thresholds
Customization Options
The strategy allows users to fine-tune its behavior:
- Volume Threshold: How unusual a volume spike must be to qualify
- Lookback Period: How far back to measure average volume
- Impact Decay Factor: How quickly older trades lose influence
- Visual Settings: Labels and line width customization
This sophisticated yet intuitive strategy provides traders with a window into institutional activity, helping identify potential trend changes before they become obvious in price action alone.

Cash And Carry Arbitrage BTC Compare Month 6 by SeoNo1Detailed Explanation of the BTC Cash and Carry Arbitrage Script
Script Title: BTC Cash And Carry Arbitrage Month 6 by SeoNo1
Short Title: BTC C&C ABT Month 6
Version: Pine Script v5
Overlay: True (The indicators are plotted directly on the price chart)
Purpose of the Script
This script is designed to help traders analyze and track arbitrage opportunities between the spot market and futures market for Bitcoin (BTC). Specifically, it calculates the spread and Annual Percentage Yield (APY) from a cash-and-carry arbitrage strategy until a specific expiry date (in this case, June 27, 2025).
The strategy helps identify profitable opportunities when the futures price of BTC is higher than the spot price. Traders can then buy BTC in the spot market and short BTC futures contracts to lock in a risk-free profit.
1. Input Settings
Spot Symbol: The real-time BTC spot price from Binance (BTCUSDT).
Futures Symbol: The BTC futures contract that expires in June 2025 (BTCUSDM2025).
Expiry Date: The expiration date of the futures contract, set to June 27, 2025.
These inputs allow users to adjust the symbols or expiry date according to their trading needs.
2. Price Data Retrieval
Spot Price: Fetches the latest closing price of BTC from the spot market.
Futures Price: Fetches the latest closing price of BTC futures.
Spread: The difference between the futures price and the spot price (futures_price - spot_price).
The spread indicates how much higher (or lower) the futures price is compared to the spot market.
3. Time to Maturity (TTM) and Annual Percentage Yield (APY) Calculation
Current Date: Gets the current timestamp.
Time to Maturity (TTM): The number of days left until the futures contract expires.
APY Calculation:
Formula:
APY = ( Spread / Spot Price ) x ( 365 / TTM Days ) x 100
This represents the annualized return from holding a cash-and-carry arbitrage position if the trader buys BTC at the spot price and sells BTC futures.
4. Display Information Table on the Chart
A table is created on the chart's top-right corner showing the following data:
Metric: Labels such as Spread and APY
Value: Displays the calculated spread and APY
The table automatically updates at the latest bar to display the most recent data.
5. Alert Condition
This sets an alert condition that triggers every time the script runs.
In practice, users can modify this alert to trigger based on specific conditions (e.g., APY exceeds a threshold).
6. Plotting the APY and Spread
APY Plot: Displays the annualized yield as a blue line on the chart.
Spread Plot: Visualizes the futures-spot spread as a red line.
This helps traders quickly identify arbitrage opportunities when the spread or APY reaches desirable levels.
How to Use the Script
Monitor Arbitrage Opportunities:
A positive spread indicates a potential cash-and-carry arbitrage opportunity.
The larger the APY, the more profitable the arbitrage opportunity could be.
Timing Trades:
Execute a buy on the BTC spot market and simultaneously sell BTC futures when the APY is attractive.
Close both positions upon futures contract expiry to realize profits.
Risk Management:
Ensure you have sufficient margin to hold both positions until expiry.
Monitor funding rates and volatility, which could affect returns.
Conclusion
This script is an essential tool for traders looking to exploit price discrepancies between the BTC spot market and futures market through a cash-and-carry arbitrage strategy. It provides real-time data on spreads, annualized returns (APY), and visual alerts, helping traders make informed decisions and maximize their profit potential.

Pine Script Boilerplate ExampleI frequently receive questions about my coding style and logic, so I decided to publish a simple indicator that draws the OHLC of a higher timeframe as an example of my coding style. This example will also explain my approach to writing indicators.
This indicator showcases how I use Types and Methods to structure my code and maintain clarity in logic. It demonstrates how I collect input data, organize the flow of the code, and utilize the TradingView method feature.
The example illustrates:
1. The use of input settings within a settings object to keep configurations grouped together.
2. The use of Types to create an object that consolidates relevant data.
3. The collection of objects to create, update, and render elements on the chart.

Checklist By TAZFX with Trade ScoreTrading Checklist is a customizable indicator designed for traders who want to stay disciplined and stick to their trading rules. Using this indicator, you can easily create and display your own personalized checklist of trading rules directly on your TradingView chart.
1. Customizable Settings:
• Positioning : Place the table in one of nine positions on the chart (e.g., bottom left, top right).
• Header : Modify the banner text, size, and color.
• Row Content : Define text for each row and control visibility.
• Appearance : Adjust text and background colors.
2. Checklist Table:
•Displays up to 8 rows with checkboxes (✅/❌) and custom labels for trade evaluation.
•Useful for tracking whether specific trade conditions or rules are met.
3. Trade Score Calculation:
•The Trade Score is a percentage that shows how many of your checklist items are checked compared to the total visible items.
iteratorThe "Iterator" library is designed to provide a flexible way to work with sequences of values. This library offers a set of functions to create and manage iterators for various data types, including integers, floats, and more. Whether you need to generate an array of values with specific increments or iterate over elements in reverse order, this library has you covered.
Key Features:
Array Creation: Easily generate arrays of integers or floats with customizable steps, both inclusive and exclusive of the end values.
Flexible Iteration: Includes methods to iterate over arrays of different types, such as booleans, integers, floats, strings, colors, and drawing objects like lines and labels.
Reverse Iteration: Support for reverse iteration, giving you control over the order in which elements are processed.
Automatic Loop Control: One of the key advantages of this library is that when using the .iterate() method, it only loops over the array when there are values present. This means you don’t have to manually check if the array is populated before iterating, simplifying your code and reducing potential errors.
Versatile Use Cases: Ideal for scenarios where you need to loop over an array without worrying about empty arrays or checking conditions manually.
This library is particularly useful in cases where you need to perform operations on each element in an array, ensuring that your loops are efficient and free from unnecessary checks.
Library "iterator"
The "iterator" library provides a versatile and efficient set of functions for creating and managing iterators.
It allows you to generate arrays of integers or floats with customizable steps, both inclusive and exclusive of the end values.
The library also includes methods for iterating over various types, including booleans, integers, floats, strings, colors,
and drawing objects like lines and labels. With support for reverse iteration and flexible customization options.
iterator(stop, start, step)
Creates an array of integers from start to stop with a specified step, excluding the stop value.
Parameters:
stop (int) : The end value of the iterator, exclusive.
start (int) : The starting value of the iterator. Default is 0.
step (int) : The increment value for each step in the iterator. Default is 1. Must be greater than 0.
Returns: An array of integers incremented by the step value from start to stop. Will return and empty array if start = stop.
iterator(stop, start, step)
Creates an array of floats from start to stop with a specified step, excluding the stop value.
Parameters:
stop (float) : The end value of the iterator, exclusive.
start (float) : The starting value of the iterator. Default is 0.
step (float) : The increment value for each step in the iterator. Default is 1. Must be greater than 0.
Returns: An array of floats incremented by the step value from start to stop. Will return and empty array if start = stop.
iterator_inclusive(stop, start, step)
Creates an array of integers from start to stop with a specified step, including the stop value.
Parameters:
stop (int) : The end value of the iterator, inclusive.
start (int) : The starting value of the iterator. Default is 0.
step (int) : The increment value for each step in the iterator. Default is 1. Must be greater than 0.
Returns: An array of integers incremented by the step value from start to stop, including the stop value.
iterator_inclusive(stop, start, step)
Creates an array of floats from start to stop with a specified step, including the stop value.
Parameters:
stop (float) : The end value of the iterator, inclusive.
start (float) : The starting value of the iterator. Default is 0.
step (float) : The increment value for each step in the iterator. Default is 1. Must be greater than 0.
Returns: An array of floats incremented by the step value from start to stop, including the stop value.
itr(stop, start, step)
Creates an array of integers from start to stop with a specified step, excluding the stop value.
Parameters:
stop (int) : The end value of the iterator, exclusive.
start (int) : The starting value of the iterator. Default is 0.
step (int) : The increment value for each step in the iterator. Default is 1. Must be greater than 0.
Returns: An array of integers incremented by the step value from start to stop.
itr(stop, start, step)
Creates an array of floats from start to stop with a specified step, excluding the stop value.
Parameters:
stop (float) : The end value of the iterator, exclusive.
start (float) : The starting value of the iterator. Default is 0.
step (float) : The increment value for each step in the iterator. Default is 1. Must be greater than 0.
Returns: An array of floats incremented by the step value from start to stop.
itr_in(stop, start, step)
Creates an array of integers from start to stop with a specified step, including the stop value.
Parameters:
stop (int) : The end value of the iterator, inclusive.
start (int) : The starting value of the iterator. Default is 0.
step (int) : The increment value for each step in the iterator. Default is 1. Must be greater than 0.
Returns: An array of integers incremented by the step value from start to stop, including the stop value.
itr_in(stop, start, step)
Creates an array of floats from start to stop with a specified step, including the stop value.
Parameters:
stop (float) : The end value of the iterator, inclusive.
start (float) : The starting value of the iterator. Default is 0.
step (float) : The increment value for each step in the iterator. Default is 1. Must be greater than 0.
Returns: An array of floats incremented by the step value from start to stop, including the stop value.
method iterate(self, reverse)
Creates an iterator array for the indices of ana array, with an option to reverse the order.
Namespace types: array
Parameters:
self (array) : The array to iterate over.
reverse (bool) : A boolean flag indicating whether to reverse the iterator order. Default is false.
Returns: An array of integers representing the indices of the array. The order can be reversed if specified.
Approximate Spectral Entropy-Based Market Momentum (SEMM)Overview
The Approximate Spectral Entropy-Based Market Momentum (SEMM) indicator combines the concepts of spectral entropy and traditional momentum to provide traders with insights into both the strength and the complexity of market movements. By measuring the randomness or predictability of price changes, SEMM helps traders understand whether the market is in a trending or consolidating state and how strong that trend or consolidation might be.
Key Features
Entropy Measurement: Calculates the approximate spectral entropy of price movements to quantify market randomness.
Momentum Analysis: Integrates entropy with rate-of-change (ROC) to highlight periods of strong or weak momentum.
Dynamic Market Insight: Provides a dual perspective on market behavior—both the trend strength and the underlying complexity.
Customizable Parameters: Adjustable window length for entropy calculation, allowing for fine-tuning to suit different market conditions.
Concepts Underlying the Calculations
The indicator utilizes Shannon entropy, a concept from information theory, to approximate the spectral entropy of price returns. Spectral entropy traditionally involves a Fourier Transform to analyze the frequency components of a signal, but due to Pine Script limitations, this indicator uses a simplified approach. It calculates log returns over a rolling window, normalizes them, and then computes the Shannon entropy. This entropy value represents the level of disorder or complexity in the market, which is then multiplied by traditional momentum measures like the rate of change (ROC).
How It Works
Price Returns Calculation: The indicator first computes the log returns of price data over a specified window length.
Entropy Calculation: These log returns are normalized and used to calculate the Shannon entropy, representing market complexity.
Momentum Integration: The calculated entropy is then multiplied by the rate of change (ROC) of prices to generate the SEMM value.
Signal Generation: High SEMM values indicate strong momentum with higher randomness, while low SEMM values indicate lower momentum with more predictable trends.
How Traders Can Use It
Trend Identification: Use SEMM to identify strong trends or potential trend reversals. Low entropy values can indicate a trending market, whereas high entropy suggests choppy or consolidating conditions.
Market State Analysis: Combine SEMM with other indicators or chart patterns to confirm the market's state—whether it's trending, ranging, or transitioning between states.
Risk Management: Consider high SEMM values as a signal to be cautious, as they suggest increased market unpredictability.
Example Usage Instructions
Add the Indicator: Apply the "Approximate Spectral Entropy-Based Market Momentum (SEMM)" indicator to your chart.
Adjust Parameters: Modify the length parameter to suit your trading timeframe. Shorter lengths are more responsive, while longer lengths smooth out the signal.
Analyze the Output: Observe the blue line for entropy and the red line for SEMM. Look for divergences or confirmations with price action to guide your trades.
Combine with Other Tools: Use SEMM alongside moving averages, support/resistance levels, or other indicators to build a comprehensive trading strategy.
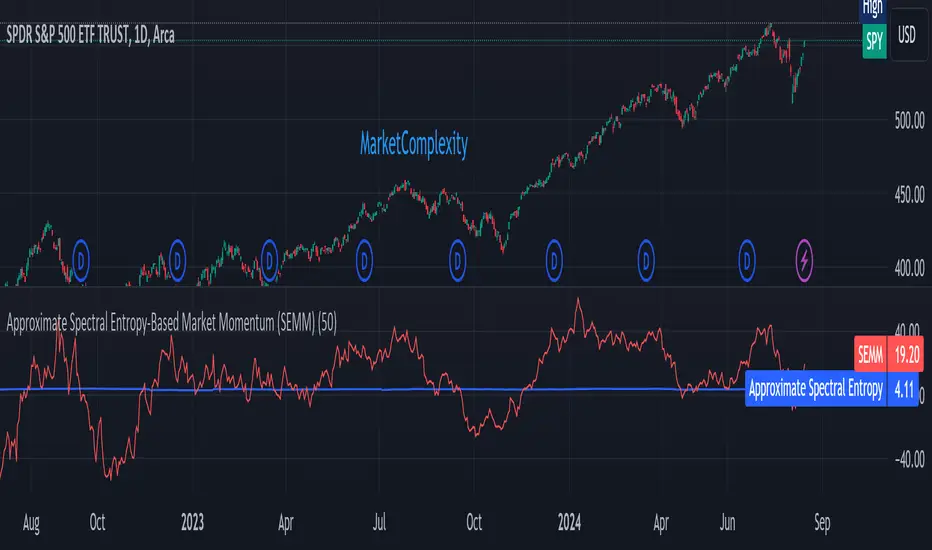
Dark & Light Theme [TradingFinder] Switching Colors Library🔵 Introduction
One of the challenges of script users is matching the colors used in indicators or strategies. By default, colors are chosen to display based on either the dark theme or the light theme.
In scripts with a large number of colors used, changing all colors to better display in dark mode or light mode can be a difficult and tedious process.
This library provides developers with the ability to adjust the colors used in their scripts based on the theme of the display.
🔵 Logic
To categorize the color spectrum, the range from 0 to 255 of all three main colors red, green and blue was divided into smaller ranges.
Blue color, which is more effective in darkening or lightening colors, is divided into 8 categories, red color into 5 categories, and green color into 3 categories, because it has little effect on darkening or brightening colors.
The combination of these categories creates 120 different modes for the color range, which leads to a more accurate identification of the color and its brightness, and helps to decide how to change it.
Except for these 120 modes, there are 2 other modes that are related to colors almost white or black, which makes a total of 122 modes.
🔵 How to Use
First, you can add the library to your code as shown in the example below.
import TFlab/Dark_Light_Theme_TradingFinder_Switching_Colors_Library/1 as SC
🟣 Parameters
SwitchingColorMode(Color, Mode) =>
Parameters:
Color (color)
Mode (string)
Color : In this parameter, enter the color you want to adjust based on light mode and dark mode.
Mode : Three modes "Off", "Light" and "Dark" are included in this parameter. "Light" mode is for color adjustment for use in "Light Mode".
"Dark" mode is for color adjustment for use in "Dark Mode" and "Off" mode turns off the color adjustment function and the input color to the function is the same as the output color.
🔵 Function Outputs
OriginalColor = input.color(color.red)
= SC.SwitchingColorMode(OriginalColor, Mode)
Multi-Frame Market Sentiment DashboardOverview
This Pine Script™ code generates a "Market Sentiment Dashboard" on TradingView, providing a visual summary of market sentiment across multiple timeframes. This tool aids traders in making informed decisions by displaying real-time sentiment analysis based on Exponential Moving Averages (EMA).
Key Features
Panel Positioning:
Custom Placement: Traders can position the dashboard at the top, middle, or bottom of the chart and align it to the left, center, or right, ensuring optimal integration with other chart elements.
Customizable Colors:
Sentiment Colors: Users can define colors for bullish, bearish, and neutral market conditions, enhancing the dashboard's readability.
Text Color: Customizable text color ensures clarity against various background colors.
Label Size:
Scalable Labels: Adjustable label sizes (from very small to very large) ensure readability across different screen sizes and resolutions.
Market Sentiment Calculation:
EMA-Based Sentiment: The dashboard calculates sentiment using a 9-period EMA. If the EMA is higher than two bars ago, the sentiment is bullish; if lower, it's bearish; otherwise, it's neutral.
Multiple Timeframes: Sentiment is calculated for several timeframes: 1 minute, 3 minutes, 5 minutes, 15 minutes, 30 minutes, 1 hour, 4 hours, and 1 day. This broad analysis provides a comprehensive view of market conditions.
Dynamic Table:
Structured Display: The dashboard uses a table to organize and display sentiment data clearly.
Real-Time Updates: The table updates in real-time, providing traders with up-to-date market information.
How It Works
EMA Calculation: The script requests EMA(9) values for each specified timeframe and compares the current EMA with the EMA from two bars ago to determine market sentiment.
Color Coding: Depending on the sentiment (Bullish, Bearish, or Neutral), the corresponding cell in the table is color-coded using predefined colors.
Table Display: The table displays the timeframe and corresponding sentiment, allowing traders to quickly assess market trends.
Benefits to Traders
Quick Assessment: Traders can quickly evaluate market sentiment across multiple timeframes without switching charts or manually calculating indicators.
Enhanced Visualization: The color-coded sentiment display makes it easy to identify trends at a glance.
Multi-Timeframe Analysis: Provides a broad view of short-term and long-term market trends, helping traders confirm trends and avoid false signals.
This dashboard enhances the overall trading experience by providing a comprehensive, customizable, and easy-to-read summary of market sentiment.
Usage Instructions
Add the Script to Your Chart: Apply the "Market Sentiment Dashboard" indicator to your TradingView chart.
Customize Settings: Adjust the panel position, colors, and label sizes to fit your preferences.
Interpret Sentiment: Use the color-coded table to quickly understand the market sentiment across different timeframes and make informed trading decisions.

Speedometer RevisitedSpeedometer Revisited is a new way to draw custom metric speedometers and is intended to be a utility for other coders to use.
@rumpypumpydumpy originally introduced the Speedometer Toolkit in version 4 of Pine Script. Since then, Pine Script has been updated to version 5, introducing some amazing new features such as polylines and chart.points. This indicator is an example of what can be done with these newer features.
The indicator starts off with a handful of functions that will be used to create the drawings. Notes are left throughout the code explaining what each line of the functions does. My goal was to make these functions user-friendly and somewhat easy to understand. I then demonstrate two examples: one speedometer with five segments and another with three.
The first example demonstrates how to visually represent the analysts' ratings for a stock using the built-in syminfo.recommendations. The speedometer is divided into five segments, each representing a different level of analyst recommendation: strong sell, sell, hold, buy, and strong buy.
Each segment is drawn using a polyline from the createSeg function, with colors assigned as follows:
Red for 'Strong Sell'
Maroon for 'Sell'
Yellow for 'Hold'
Green for 'Buy'
Lime for 'Strong Buy'
The script identifies the maximum value among the analyst ratings, calculates the midpoint of the corresponding segment, and draws a needle pointing to this midpoint.
The second example employs the speedometer design to display market sentiment through the put-call ratio. The put-call ratio is a gauge of investor sentiment, where values above 1 indicate a bearish sentiment (more puts being bought relative to calls), and values below 1 suggest a bullish outlook (more calls being bought relative to puts).
The speedometer is divided into three segments, reflecting different ranges of the put-call ratio:
Red for a ratio greater than 1 (bearish sentiment)
Yellow for a ratio between 0.8 and 1 (neutral to bearish sentiment)
Lime for a ratio less than 0.8 (bullish sentiment)
Depending on the value of the put-call ratio, the script calculates which segment the current value falls into and determines the appropriate segment number. The script calculates the midpoint of the selected segment and draws a needle pointing to this value.
Both examples show how the speedometer can be used as a visual indicator of certain market conditions, helping traders quickly recognize trends and adjust their strategies accordingly.
A big thanks to @rumpypumpydumpy for his original Speedometer Toolbox. I hope this take on it can be useful for other coders.
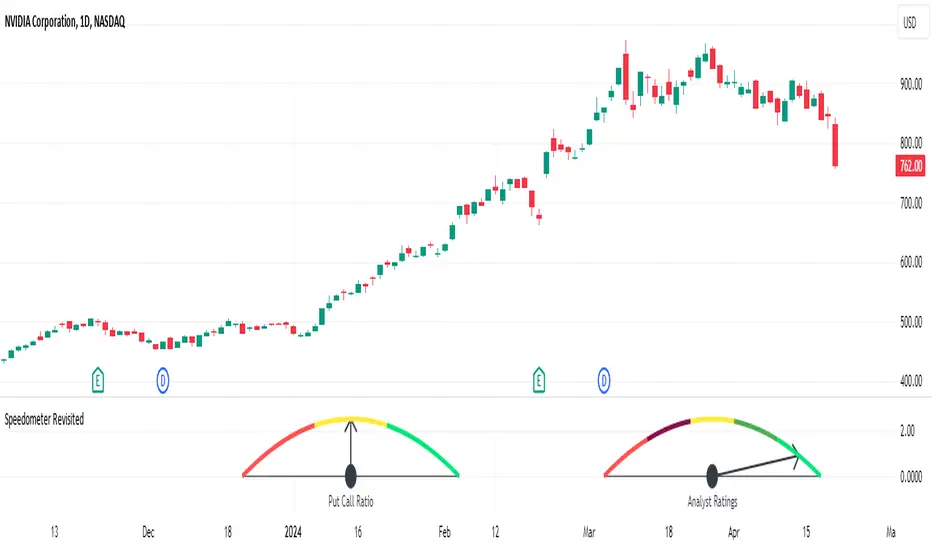
FreedX Grid Backtest█ FreedX Grid Backtest is an open-source tool that offers accurate GRID calculations for GRID trading strategies. This advanced tool allows users to backtest GRID trading parameters with precision, accurately reflecting exchange functionalities. We are committed to enhancing trading strategies through precise backtesting solutions and address the issue of unreliable backtesting practices observed on GRID trading strategies. FreedX Grid Backtest is designed for optimal calculation speed and plotting efficiency, ensuring users to achieve fastest calculations during their analysis.
█ GRID TRADING STRATEGY SETTINGS
The core of the FreedX Grid Backtest tool lies in its ability to simulate grid trading strategies. Grid trading involves placing orders at regular intervals within a predefined price range, creating a grid of orders that capitalize on market volatility.
Features:
⚙️ Backtest Range:
→ Purpose: Allows users to specify the backtesting range of GRID strategy. Closes all positions at the end of this range.
→ How to Use: Drag the dates to fit the desired backtesting range.
⚙️ Investment & Compounding:
→ Purpose: Allows users to specify the total investment amount and select between fixed and compound investment strategies. Compounding adjusts trade quantities based on performance, enhancing the grid strategy's adaptability to market changes.
→ How to Use: Set the desired investment amount and choose between "Fixed" or "Compound" for the investment method.
⚙️ Leverage & Grid Levels:
→ Purpose: Leverage amplifies the investment amount, increasing potential returns (and risks). Users can define the number of grid levels, which determines how the investment is distributed across the grid.
→ How to Use: Input the desired leverage and number of grids. The tool automatically calculates the distribution of funds across each grid level.
⚙️ Distribution Type & Mode:
→ Purpose: Users can select the distribution type (Arithmetic or Geometric) to set how grid levels are determined. The mode (Neutral, Long, Short) dictates the direction of trades within the grid.
→ How to Use: Choose the distribution type and mode based on the desired trading strategy and market outlook.
⚙️ Enable LONG/SHORT Grids exclusively:
█ MANUAL LEVELS AND STOP TRIGGERS
Beyond automated settings, the tool offers manual adjustments for traders seeking finer control over their grid strategies.
Features:
⚙️ Manual Level Adjustment:
→ Purpose: Enables traders to manually set the top, reference, and bottom levels of the grid, offering precision control over the trading range.
→ How to Use: Activate manual levels and adjust the top, reference, and bottom levels as needed to define the grid's scope.
⚙️ Stop Triggers:
→ Purpose: Provides an option to set upper and lower price limits, acting as stop triggers to close or terminate trades. This feature safeguards investments against significant market movements outside the anticipated range.
→ How to Use: Enable stop triggers and specify the upper and lower limits. The tool will automatically manage positions based on these parameters.
---
This guide gives you a quick and clear overview of the FreedX Grid Backtest tool, explaining how you can use this cutting-edge tool to improve your trading strategies.

Volume Spike IndicatorHello dear traders,
Today we're discussing an indicator I've coded: the Volume Spike Indicator (VSI).
The indicator isn't a groundbreaking invention and certainly not a novelty. Nevertheless, I haven't seen this version of the indicator on TradingView before, so I'd like to introduce it.
1. The Origin of the Idea:
We're all familiar with volume charts: A volume chart visually represents the trading activity for a specific asset over a certain period, indicating the total number of shares or contracts traded.
We also know that volume spikes can significantly impact the market. A volume spike represents an extreme anomaly, a day, week, or month with an extraordinary amount of trading. However, recognizing these spikes in practice isn't always straightforward. What constitutes high volume? How do we define and identify it? The answers to these questions aren't easy.
It's commonly said that a volume spike could be identified if the volume is 25% more than the average of the two weeks prior, but how do you measure this 25%? It's not always easy to calculate, especially in real-time.
This challenge led me to develop the concept into an indicator.
How Does It Work?
Imagine being able to "feel" the market's energy like a surfer feels the ocean. The VSI does something similar by examining trading volume and comparing it to what has been typical over the past few weeks. Here's a quick look at the magic behind it:
Step 1: Establishing the Baseline: We start by establishing a baseline, i.e., the average trading volume over a given period. Let's use the last 10 days as the default setting. We choose 10 days because, in the traditional stock market, 10 days represent two weeks if you subtract weekends. This gives us a fixed line to compare against.
Step 2: Recognizing Peaks: Next, we look for days when the trading volume significantly exceeds this average. The size of the jump is where you have a say. You can set a threshold, such as 25%, to define what you consider a volume spike.
Step 3: The Calculation: This is where the math comes into play. We calculate the percentage change in today's volume compared to the average volume of the last 10 days. For example, if today's volume is 30% above the average and you've set your threshold at 25%, the VSI will recognize this as a spike.
Step 4: Visual Cue: These spikes are then plotted on a graph, with each spike represented as a bar. The height of the bar indicates the spike's percentage size, so you can see at a glance how significant a spike is.
Step 5: Intuitive Color Coding: For quick analysis, the VSI employs a color-coding system. Exceptionally high peaks, such as those exceeding a 100% increase, are highlighted in blue to emphasize their importance. Other peaks are shown in red, creating a visual hierarchy for quick volume data interpretation.
Why This Matters:
Identifying these spikes can help pinpoint the beginning or end of a trend. The idea is that when trading peaks at a certain level, there might be no more buyers or sellers willing to engage at that price level. Volume peaks, and a reversal is likely imminent. It's a simple yet effective concept. Therefore, it's crucial to use this indicator in the context of the trend, as not every spike carries the same significance.
Customizable:
The beauty of the VSI lies in its flexibility. Trading futures? You might want to adjust the averaging period to 14 days to better suit your market. You have full control over the settings to tailor them to your trading style.
Interpreting the Figures:
A positive percentage indicates a volume spike above the average – the higher the percentage, the more significant the spike.
If the percentage exceeds a certain threshold (which you can set, e.g., 25%), it signals a volume spike, indicating increased market activity that could precede significant price movement.
What makes the VSI genuinely adaptable is your ability to tweak the parameters to suit your needs.
Are you trading in a volatile market? Extend the SMA period to smooth out the noise. Trading in a 24-hour market? Adjust the length of your SMA. Seeking finer details? Shorten it. The VSI is yours to adapt to your trading strategy.
---------------------------------------------------------------------------------------------------------------------
As we wrap up this introduction to the Volume Spike Indicator, I hope you're as excited about its potential as I am. This tool, born out of curiosity and a desire for clarity in the vast ocean of market data, is designed to be your ally in navigating the waves of trading activity.
Remember, the true power of the VSI lies not just in its ability to highlight significant volume spikes, but in its adaptability to your unique trading style and needs. Whether you're charting courses through the tumultuous seas of day trading or navigating the broader currents of long-term investments, the VSI is here to offer insights and guidance.
I encourage you to experiment with it, customize it, and see how it can enhance your trading strategy. And as you do, remember that every tool, no matter how powerful, is just one piece of the puzzle. Combine the VSI with your knowledge, experience, and intuition to make informed and strategic trading decisions.
Thank you for taking the time to explore the Volume Spike Indicator with me.
Best Regards,
Karim Subhieh
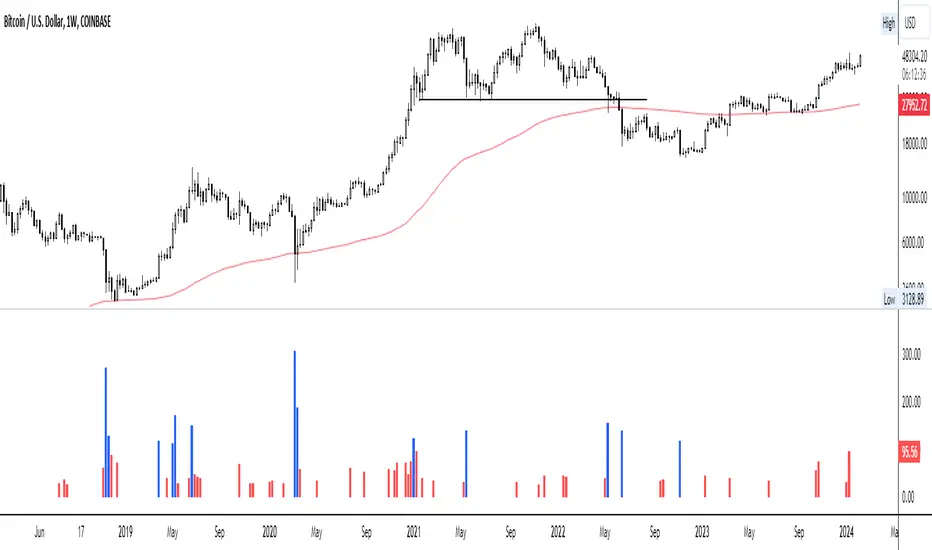
Liquidity Heatmap [BigBeluga]The Liquidity Heatmap is an indicator designed to spot possible resting liquidity or potential stop loss using volume or Open interest.
The Open interest is the total number of outstanding derivative contracts for an asset—such as options or futures—that have not been settled. Open interest keeps track of every open position in a particular contract rather than tracking the total volume traded.
The Volume is the total quantity of shares or contracts traded for the current timeframe.
🔶 HOW IT WORKS
Based on the user choice between Volume or OI, the idea is the same for both.
On each candle, we add the data (volume or OI) below or above (long or short) that should be the hypothetical liquidation levels; More color of the liquidity level = more reaction when the price goes through it.
Gradient color is calculated between an average of 2 points that the user can select. For example: 500, and the script will take the average of the highest data between 500 and 250 (half of the user's choice), and the gradient will be based on that.
If we take volume as an example, a big volume spike will mean a lot of long or short activity in that candle. A liquidity level will be displayed below/above the set leverage (4.5 = 20x leverage as an example) so when the price revisits that zone, all the 20x leverage should be liquidated.
Huge volume = a lot of activity
Huge OI = a lot of positions opened
More volume / OI will result in a stronger color that will generate a stronger reaction.
🔶 ROUTE
Here's an example of a route for long liquidity:
Enable the filter = consider only green candles.
Set the leverage to 4.5 (20x).
Choose Data = Volume.
Process:
A green candle is formed.
A liquidity level is established.
The level is placed below to simulate the 20x leverage.
Color is applied, considering the average volume within the chosen area.
Route completed.
🔶 FEATURE
Possibility to change the color of both long and short liquidity
Manual opacity value
Manual opacity average
Leverage
Autopilot - set a good average automatically of the opacity value
Enable both long or short liquidity visualization
Filtering - grab only red/green candle of the corresponding side or grab every candle
Data - nzVolume - Volume - nzOI - OI
🔶 TIPS
Since the limit of the line is 500, it's best to plot 2 scripts: one with only long and another with only short.
🔶 CONCLUSION
The liquidity levels are an interesting way to think about possible levels, and those are not real levels.

Flag FinderFlag Finder Indicator is a technical analysis tool to identify bull and bear flags.
What are flags
Flags are continuation patterns that occur within the general trend of the security. A bull flag represents a temporary pause or consolidation before price resumes it's upward movement, while a bear flag occurs before price continues its downward movement.
Both flag patterns consist of two components:
The Pole
The Flag
The pole is the initial strong upward surge or decline that precedes the flag. The pole is usually a fast move accompanied by heavy volume signaling significant buying or selling pressure.
The flag is then formed as price consolidates after the initial surge or decline from the pole. For a bull flag price will drift slightly downward to sideways, a bear flag will drift upward to sideways. The best flags often see volume dry up during this phase of the pattern.
Indicator Settings
Both components are fully customizable in the indicator so the user can adjust for any time frame or volatility. Select the minimum and maximum accepted limits from the % gain loss required for the pole, the maximum acceptable flag depth or rally and the minimum and maximum number of bars for each component.
Colors and what components are visible at any time are also user controlled.
Trading flags
Traders typically use flags to enter on breakouts. A breakout occurs when price moves above the left side high of a bull flag or below the left side low of a bear flag.
Alerts
The Flag Finder allows for four different types of alerts
New Bull Flag
New Bear Flag
Bull Flag Breakout
Bear Flag Breakout
Pine Script
On top of the indicator identifying bull and bear flags, throughout the source code I left notes on nearly every line to help anyone who is interested in pine script see my thought process and explain which each line of code does. This code isn't too complex, but it offers a look into many different concepts one might use when writing pinescript such as:
input groups
declaring and reassigning variables
for loops
plotshapes & lines
alerts

Mizar_LibraryThe "Mizar_Library" is a powerful tool designed for Pine Script™ programmer’s, providing a collection of general functions that facilitate the usage of Mizar’s DCA (Dollar-Cost-Averaging) bot system.
To begin using the Mizar Library, you first need to import it into your indicator script. Insert the following line below your indicator initiation line: import Mizar_Trading/Mizar_Library/1 as mizar (mizar is the chosen alias).
In the import statement, Mizar_Trading.Mizar_Library_v1 refers to the specific version of the Mizar Library you wish to use. Feel free to modify mizar to your preferred alias name.
Once the library is imported, you can leverage its functions by prefixing them with mizar. . This will prompt auto-completion suggestions displaying all the available user-defined functions provided by the Mizar Library.
Now, let's delve into some of the key functions available in the Mizar Library:
DCA_bot_msg(_cmd)
The DCA_bot_msg function accepts an user-defined type (UDT) _cmd as a parameter and returns a string with the complete JSON command for a Mizar DCA bot.
Parameters:
_cmd (bot_params) : ::: User-defined type (UDT) that holds all the necessary information for the bot command.
Returns: A string with the complete JSON command for a Mizar DCA bot.
rounding_to_ticks(value, ticks, rounding_type)
The rounding_to_ticks function rounds a calculated price to the nearest actual price based on the specified tick size.
Parameters:
value (float) : ::: The calculated price as float type, to be rounded to the nearest real price.
ticks (float) : ::: The smallest possible price obtained through a request in your script.
rounding_type (int) : ::: The rounding type for the price: 0 = closest real price, 1 = closest real price above, 2 = closest real price below.
Returns: A float value representing the rounded price to the next tick.
bot_params
Bot_params is an user-defined type (UDT) that represents the parameters required for a Mizar DCA bot.
Fields:
bot_id (series string) : The ID number of your Mizar DCA bot.
api_key (series string) : Your private API key from your Mizar account (keep it confidential!).
action (series string) : The command to perform: "open" (standard) or "close" optional .
tp_perc (series string) : The take profit percentage in decimal form (1% = "0.01") optional .
base_asset (series string) : The cryptocurrency you want to buy (e.g., "BTC").
quote_asset (series string) : The coin or fiat currency used for payment (e.g., "USDT" is standard if not specified) optional .
direction (series string) : The direction of the position: "long" or "short" (only applicable for two-way hedge bots) optional .
To obtain the JSON command string for the alert_function call, you can use the DCA_bot_msg function provided by the library. Simply pass the cmd_msg UDT as an argument and assign the returned string value to a variable.
Here's an example to illustrate the process:
// Import of the Mizar Library to use the included functions
import/Mizar_Trading/Mizar_Library/1 as mizar
// Example to set a variable called “cmd_msg” and all of its parameters
cmd_msg = mizar.bot_params. new()
cmd_msg.action := "open"
cmd_msg.api_key := "top secret"
cmd_msg.bot_id := "9999"
cmd_msg.base_asset := "BTC"
cmd_msg.quote_asset := "USDT"
cmd_msg.direction := "long"
cmd_msg.tp_perc := "0.015"
// Calling the Mizar conversion function named “DCA_bot_msg()” with the cmd_msg as argument to receive the JSON command and save it in a string variable called “alert_msg”
alert_msg = mizar.DCA_bot_msg(cmd_msg)
Feel free to utilize (series) string variables instead of constant strings. By incorporating the Mizar Library into your Pine Script, you gain access to a powerful set of functions and can leverage them according to your specific requirements.
For additional help or support, you can join the Mizar Discord channel. There, you'll find a dedicated Pine Script channel where you can ask any questions related to Pine Script.
Hobbiecode - RSI + Close previous dayThis is a simple strategy that is working well on SPY but also well performing on Mini Futures SP500. The strategy is composed by the followin rules:
1. If RSI(2) is less than 15, then enter at the close.
2. Exit on close if today’s close is higher than yesterday’s high.
If you backtest it on Mini Futures SP500 you will be able to track data from 1993. It is important to select D1 as timeframe.
Please share any comment or idea below.
Have a good trading,
Ramón.

Hobbiecode - Five Day Low RSI StrategyThis is a simple strategy that is working well on SPY but also well performing on Mini Futures SP500. The strategy is composed by the followin rules:
1. If today’s close is below yesterday’s five-day low, go long at the close.
2. Sell at the close when the two-day RSI closes above 50.
3. There is a time stop of five days if the sell criterium is not triggered.
If you backtest it on Mini Futures SP500 you will be able to track data from 1993. It is important to select D1 as timeframe.
Please share any comment or idea below.
Have a good trading,
Ramón.

Hobbiecode - SP500 IBS + HigherThis is a simple strategy that is working well on SPY but also well performing on Mini Futures SP500. The strategy is composed by the followin rules:
1. Today is Monday.
2. The close must be lower than the close on Friday.
3. The IBS must be below 0.5.
4. If 1-3 are true, then enter at the close.
5. Sell 5 trading days later (at the close).
If you backtest it on Mini Futures SP500 you will be able to track data from 1993. It is important to select D1 as timeframe.
Please share any comment or idea below.
Have a good trading,
Ramón.
