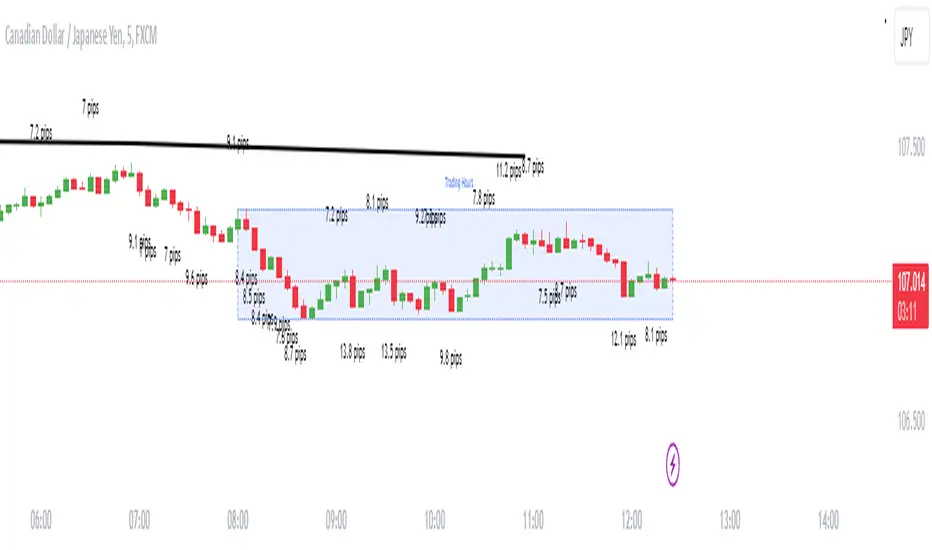
Candle size in pipsDescription
Enhance your trading strategy with precision using this script, designed to measure the range of a candle from wick to wick in pips. Whether you're implementing a specific pip requirement within a candle for your strategy, or simply seeking to better understand market dynamics, this tool provides valuable insights. The script is calculating the amount of pips between the high and the low then compares it to the minimal size you declared. If the amount of pips is more or equal to minimal size it will show the label.
Features
Alert Functionality: Opt to receive alerts by checking the checkbox (default: false).
Customizable Pip Threshold: Tailor the script to your needs by setting the minimum required pips to display on the screen (default: 12).
Different shape: circle, triangle up, triangle down, none
How to Use
Personalize your trading approach by integrating this script with your preferred strategy. For instance, in my strategy involving a 3M continuation, I leverage this tool to determine the pip count of the M15 candle before making entry decisions.
Note: Ensure you understand your strategy's requirements and adjust the script settings accordingly for optimal result s.
Feel free to reach out if you have any questions or require further assistance in maximizing the utility of this script.
Pips
YDH/YDL to Current Day H/L - Zones- Draw boxes on the intersections between yesterday's high/low and the day's after high/low
This will help you to visualize areas at extreme points where algo hasn't yet pushed price to recover them

(Simple) Lot Size CalculatorPip Calculator: A Guide for Traders
The Pip Calculator is a powerful tool designed to help traders calculate their lot size based on their account balance, risk percentage, and stop loss in pips. This guide will walk you through using the Pip Calculator script and explain its features.
Features of the Pip Calculator:
User-friendly UI : The Pip Calculator provides a simple and intuitive user interface, making it easy to input your account details and obtain the desired lot size.
Flexible Inputs : The Pip Calculator allows you to enter your account balance, risk percentage, and stop loss in pips. This flexibility enables you to customize the calculation according to your trading strategy.
Dynamic Currency Pair Support : The Pip Calculator supports various currency pairs and their respective pip values. The script automatically detects the currency pair of the chart you're viewing, ensuring accurate calculations.
Real-time Lot Size Display : The Pip Calculator instantly calculates and displays the lot size based on your inputs. The lot size is updated in real-time as you adjust your account balance, risk percentage, or stop loss.
Visual Representation : The Pip Calculator visually presents the calculated lot size on the chart, making it easy to understand and reference during your trading activities.
Using the Pip Calculator:
Install and Apply the Script : To use the Pip Calculator, install it as an extension on your preferred trading platform (such as TradingView). Apply the script to the chart of the desired currency pair.
Enter Account Details : In the script's user interface, enter your account balance, risk percentage, and stop loss in pips. These details are essential for accurate lot size calculation.
Review Currency Pair Support : The Pip Calculator automatically detects the currency pair of the chart. Ensure that the currency pair is supported by checking the "Currency pair not supported" message. Currently, GBPJPY is the supported pair.
Observe Real-time Lot Size : Once you've entered the required information, the script will calculate and display the lot size in real-time. The lot size is adjusted automatically as you modify your inputs.
Visualize the Lot Size : The calculated lot size is displayed on the chart as a label. You can easily view and reference the lot size while analyzing price movements.
Customize the UI : The Pip Calculator allows you to customize the appearance of the lot size label. You can adjust the text color, background color, and choose whether to show or hide the lot size label.
Note: The Pip Calculator script is intended as a tool to assist traders in determining an appropriate lot size based on their account balance, risk percentage, and stop loss. It should be used in conjunction with a comprehensive trading strategy and risk management principles.
Advantages of the Pip Calculator:
Accuracy: The Pip Calculator incorporates accurate pip values for supported currency pairs, ensuring precise lot size calculations.
Simplicity: The user-friendly interface and intuitive design make it easy for traders to calculate their lot size without complex calculations or manual estimations.
Real-time Updates: The Pip Calculator provides instant lot size updates, allowing traders to adapt their position sizing based on changes in account balance, risk percentage, or stop loss.
Visibility: The visual representation of the lot size on the chart helps traders quickly identify their desired position size and monitor it during trading activities.
The Pip Calculator offers a convenient and efficient way to determine lot sizes based on your trading parameters. By using this tool, you can enhance your risk management practices, maintain consistency, and stay aligned with your trading plan.
Disclaimer: The Pip Calculator script is provided for informational purposes only and should not be considered as financial advice. Trading in the financial markets carries inherent risks, and it is essential to perform your own analysis and consult with a qualified financial advisor before making any investment decisions.

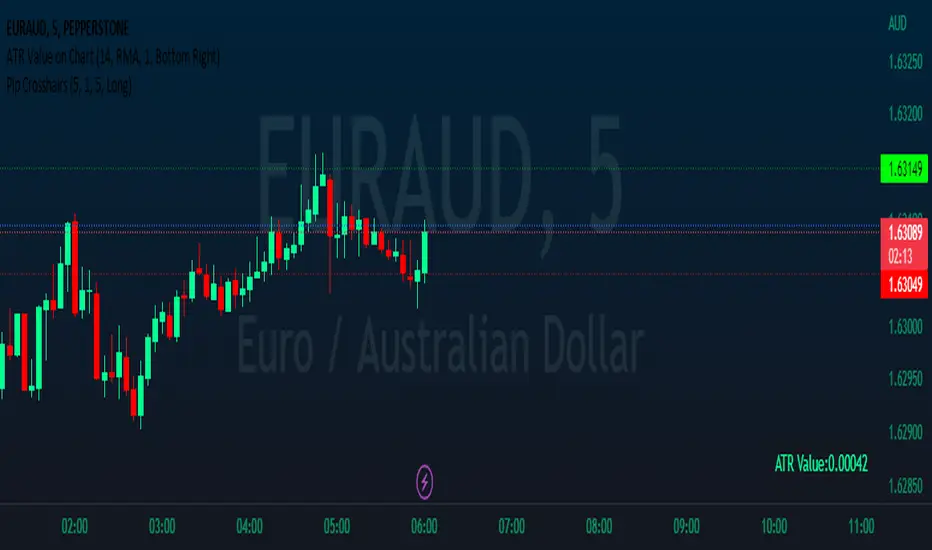
Pip CrosshairsThis is a simple tool designed to help you visualize your stop loss and take profit levels before entering a trade. The tool plots two lines on the chart - a green dotted line for take profit and a red dotted line for stop loss (similar to the price line) - with a simulated default spread of one pip factored in. The indicator has the option to toggle between long and short positions.
Please note that the spread used in the tool is not based on your actual spread and should be adjusted accordingly. As, to the best of my knowledge Pine Script does not have the ability to automatically include spread in an indicator, so you will need to input your spread manually. (if you can please let me know cause that would be a game changer).
Overall, should help save you a bit of time by not having to manually measure stop loss and take profit levels for each trade.
Happy hunting :)
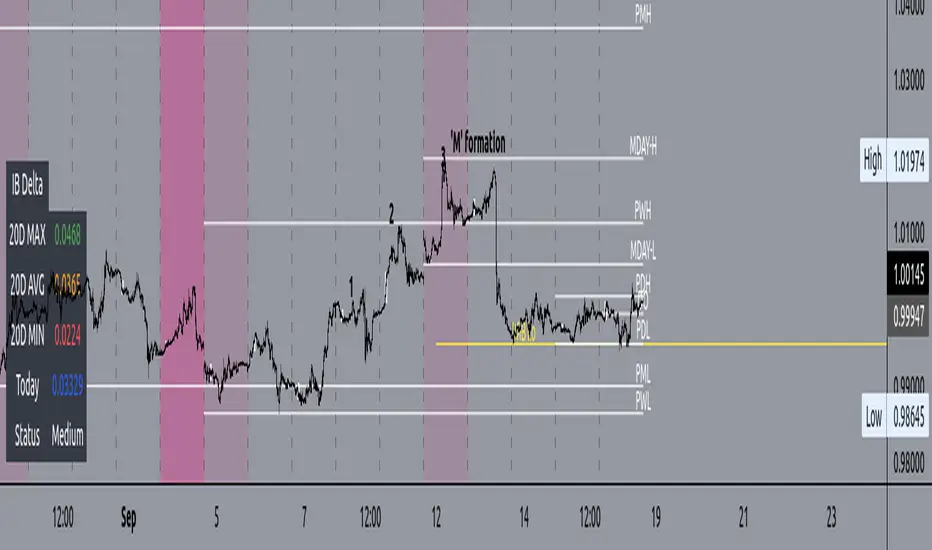
BTMM V2Similar to the first BTMM (R.Noodle) this version of the script is tailored towards key level traders. This includes intraday, daily, and higher TF traders.
**REMOVED** background tckr info, candle color according to day, and market sessions
**Replaced**key levels & market sessions
**NEW**initial balance analytics first Friday and every Monday
Market Sessions
UK=1ST 3HRS US=1ST 3 HRS =ASIA/DAILY INITIAL BALANCE = 1ST SESS 1ST 1HR HIGH/LOW
Since the Asian session starts the day we can also grab the initial balance for the day as well. (note that using the Asian session extend function you will not be given the Asian session end time. Extend function makes the session close run through the entire day)
INITIAL BALANCE PANEL/BOX
WEEKLY INITIAL BALANCE
PIP LINES
double zero (00) and 50 pip levels are strong levels the market respects. one can reduce risk by entering at major confluences and key levels examlpe below
FIRST FRIDAY + EVERY MONDAY
KEY LEVELS
you can have today, yesterday, last week, last month, last qtr, and last year along with the mid point of all. below are key levels for day traders
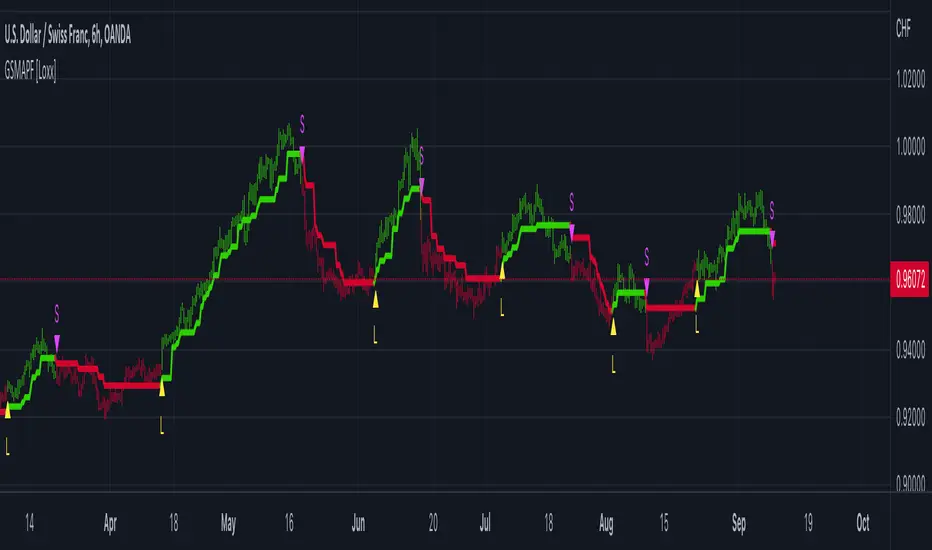
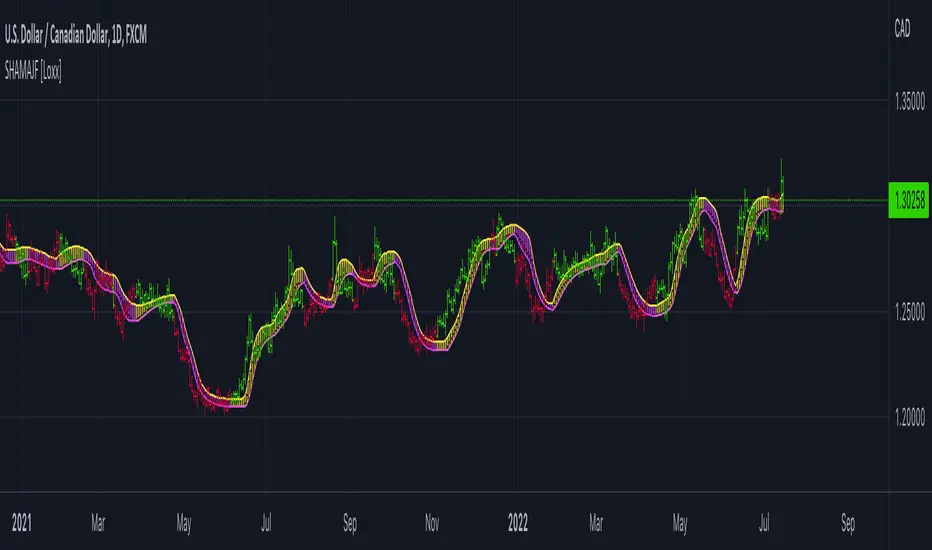
Generalized Step Moving Average w/ Pips Filter [Loxx]Generalized Step Moving Average w/ Pips Filter is a stepping function on source input to derive a moving average. This general form the stepping can also be applied to any other input such as EMA, SMA, HMA, WMA, etc.. This moving average employ a filtering system based on the following:
Core filter, both min and max value: pips * (multiplier) or the (average of momentum) * (multiplier).
Post processing filter: pips * (multiplier)
These filtering options require trend to shift by the above values before changing direction thereby reducing noise and yielding a better defined trend.
Things to note
This indicator requires fine tuning to make it work on all tickers. If you place this on a chart and it shows all green or red candles, then you must adjust the indicator to coincide with the pip movement of that ticker.
This indicator can be used on any timeframe.
Included
Bar coloring
Signals
Alerts
Loxx's Expanded Source Types
Volatility Quality Index w/ Pips Filtering [Loxx]Volatility Quality Index w/ Pips Filtering is a Volatility Quality Index indicator with various smoothing types and pips filtering
What is the Volatility Quality Index (VQI)?
The idea behind the volatility quality index is to point out the difference between bad and good volatility in order to identify better trade opportunities in the market. This forex indicator works using the True Range algorithm in combination with the open, close, high and low prices.
Included
7 different types of smoothing average
Alerts (coming in future update, stay tuned)
Signals (coming in future update, stay tuned)

Pips-Stepped, Adaptive-ER DSEMA w/ DSL [Loxx]Pips-Stepped, Adaptive-ER DSEMA w/ DSL is an Efficiency-Ratio-Adaptive, Double-Smoothed EMA with Pips Stepping and Discontinued Signal Lines. This combination reduces noise and improves signal quality.
What is Double Smoothed Exponential Moving Average (DSEMA) ?
The Double Smoothed Exponential Moving Average is a lot less laggy compared to a traditional EMA . It's also considered a leading indicator compared to the EMA , and is best utilized whenever smoothness and speed of reaction to market changes are required.
What is the efficiency ratio?
In statistical terms, the Efficiency Ratio tells us the fractal efficiency of price changes. ER fluctuates between 1 and 0, but these extremes are the exception, not the norm. ER would be 1 if prices moved up 10 consecutive periods or down 10 consecutive periods. ER would be zero if price is unchanged over the 10 periods.
Included:
Bar coloring
Signals
Alerts
EMA and FEMA Signal/ DSL smoothing
Loxx's Expanded Source Types

Pips-Stepped MA of RSI Adaptive EMA [Loxx]Pips-Stepped MA of RSI Adaptive EMA is a pips-stepping, adaptive moving average that first, filers source input price using an EMA calculated using an RSI-modified alpha value and second, and last, its plugged into a pips-stepping algorithm to output the final chart signals. This is mainly a forex indicator although it can be used for any asset, but you must adjust the step size to pips relative to the asset, For Bitcoin this may be 5000 or more.
Included
Bar coloring
Signals
Alerts
Loxx's Expanded Source Types
Loxx's RSI Variety RSI types

Stepped Heiken Ashi Moving Average w/ Jurik Filtering [Loxx]Stepped Heiken Ashi Moving Average w/ Jurik Filtering is a Heiken Ashi moving average with Jurik Filtering and stepping by pips. This can be used as a moving average channel.
What is Jurik Volty used in the Juirk Filter?
One of the lesser known qualities of Juirk smoothing is that the Jurik smoothing process is adaptive. "Jurik Volty" (a sort of market volatility ) is what makes Jurik smoothing adaptive. The Jurik Volty calculation can be used as both a standalone indicator and to smooth other indicators that you wish to make adaptive.
What is the Jurik Moving Average?
Have you noticed how moving averages add some lag (delay) to your signals? ... especially when price gaps up or down in a big move, and you are waiting for your moving average to catch up? Wait no more! JMA eliminates this problem forever and gives you the best of both worlds: low lag and smooth lines.
Included:
Toggle fill color
Toggle bar color
Toggle candles
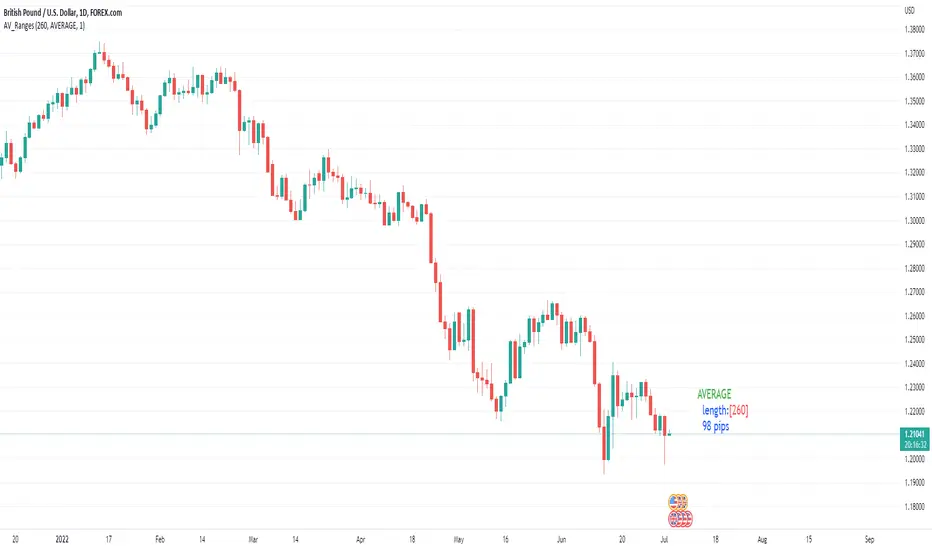
Average, Median, Mode, Biggest: Pip Range Measures & LabelsApply various simple statistical measures to series of full candle ranges over user input length (in bars).
Choose between AVERAGE, MEDIAN, MODE, BIGGEST.
All calculations derive from the high-low range of a candle.
Default length = 260, the number of daily candles in a year.
MODE is calculated from pip ranges rounded to reasonable increments (to nearest 10pips foreign currencies; to nearest 100 pips for DXY ; nearest $10 for other assets). Best only use MODE for the major FX pairs encoded, and on Daily timeframe .
User input 'unit multiplier' only applies when asset is NOT a major Forex pair (unit and multiplier is auto applied for for major FX pairs).
© twingall
Pips Stepped VHF-Adaptive VMA w/ Expanded Source Types [Loxx]Pips Stepped VHF-Adaptive VMA w/ Expanded Source Types is a volatility adaptive Variable Moving Average (VMA) with stepping by pips.
What is Variable Moving Average (VMA)?
VMA (Variable Moving Average) is often mistakenly confused with the VIDYA (Volatility Index Dynamic Average) which is not strange since Tushar Chande took part in developing both. But the VMA was preceding the VIDYA and should not be mistaken for it.
What is Vertical Horizontal Filter (VHF)?
Vertical Horizontal Filter (VHF) was created by Adam White to identify trending and ranging markets. VHF measures the level of trend activity, similar to ADX in the Directional Movement System. Trend indicators can then be employed in trending markets and momentum indicators in ranging markets.
VMA, as is, is a "good candidate" for this type of filtering since it tends to produce prolonged periods of nearly horizontal values when the volatility of the market is low, so, when the step filtering is applied to it, the small slope changes that are happening as a results of the semi EMA calculation are filtered out, and signals are becoming more usable.
Included:
-Color bars
-Show signals
-Long/short alerts

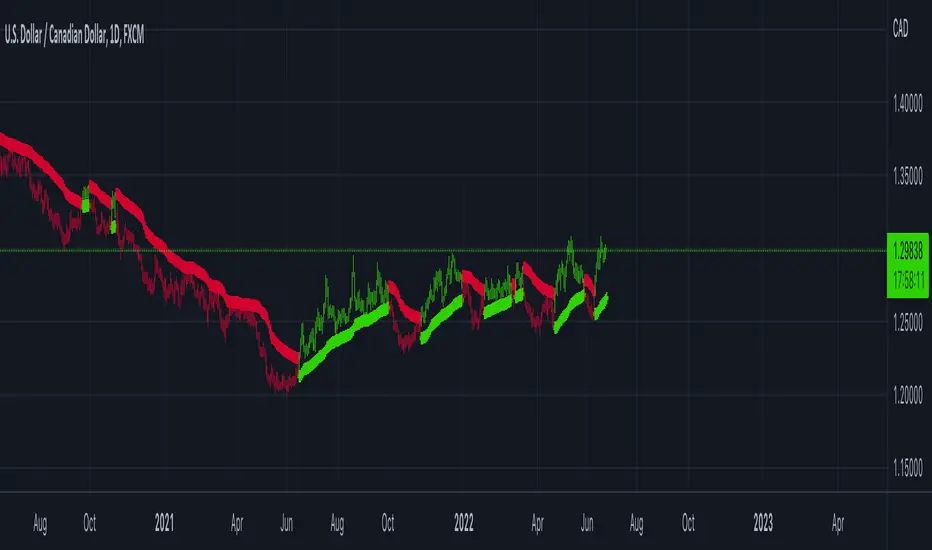
Adaptive Parabolic SAR (PSAR) [Loxx]Adaptive Parabolic SAR (PSAR) is an advanced Parabolic SAR with adaptive adjustments using either a Kaufman or an Ehlers smoothing algorithms.
What is the Parabolic SAR?
The parabolic SAR attempts to give traders an edge by highlighting the direction an asset is moving, as well as providing entry and exit points. In this article, we'll look at the basics of this indicator and show you how you can incorporate it into your trading strategy. We'll also look at some of the drawbacks of the indicator.
The parabolic SAR is a technical indicator used to determine the price direction of an asset, as well as draw attention to when the price direction is changing. Sometimes known as the "stop and reversal system," the parabolic SAR was developed by J. Welles Wilder Jr., creator of the relative strength index (RSI).1
On a chart, the indicator appears as a series of dots placed either above or below the price bars. A dot below the price is deemed to be a bullish signal. Conversely, a dot above the price is used to illustrate that the bears are in control and that the momentum is likely to remain downward. When the dots flip, it indicates that a potential change in price direction is under way. For example, if the dots are above the price, when they flip below the price, it could signal a further rise in price.
Additional Options
Toggle signals on/off
HiLo mode
Kaufman adaptive, Ehlers adaptive, or non adaptive
Filter by Pips
Minimum Change by Pips
Color bars
Enjoy!
High - Low Difference (Forex)This script is created to read and label the difference between High and Low of a candle in points term & in percentage term.
This is basically made for Forex Trading.
Do explore the settings of the scrip.

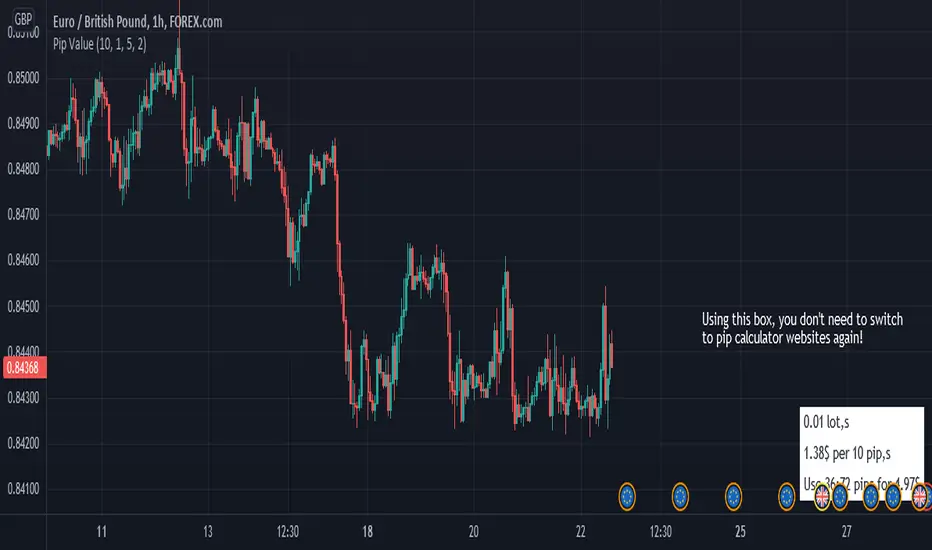
Pip Value Calculator(Original by ashkanpower)Japanese below / 日本語説明は下記
With this indicator, you can calculate profit and loss amount based on pips.
The original indicator is developed by ashkanpower and I have modified enabling to select account currency and font color.
Account currency can be selected from USD, JPY, EUR, GBP, AUD and THB.
Profit/loss amount can be calculated with the selected account currency.
Note: No spreads and commissions included. This is just for simulation only.
It works for forex only.
Original : Pip Value
Thank you @ashkanpower for inspiring me!
----------------------
Pipsを金額換算できるインジケーターです。
ashkanpower氏作成のインジケーター”Pip Value“を口座通貨の選択、フォントカラーの選択を可能なように改良しています。
選択可能な口座通貨は米ドル、日本円、ユーロ、ポンド、豪ドル、タイバーツです。
ポジションを立てる前の損益金額のシミュレーションにお使いください。
(ブローカーによって異なるスプレッドや手数料は含まれません。)
※FXの通貨ペアのみで動作します。
オリジナル : Pip Value

Pip ValueThis simple tool helps you manage your risk by calculating the exact price for pips.
it only works for forex pairs.
Forex scalper 2xEMA + SRSI + MACDThis is a forex scalping strategy designed for the most liquid pairs, like major forex pairs.
Its made of
1 EMA 50
1 EMA 100
Stochastic RSI
MACD
Rules
For long :close of the candle is above moving average 50, moving average 50> moving average 100, macd histogram is positive and cross over of stochastic rsi with the oversold level.
For short :close of the candle is below moving average 50, moving average 50 < moving average 100, macd histogram is negative and cross under of stochastic rsi with the overbought level.
Exit
For exit we have take profit and stop loss using fixed pip points.
For this example on EURUSD we use 20 pips for both tp and sl
IF you have any questions let me know !

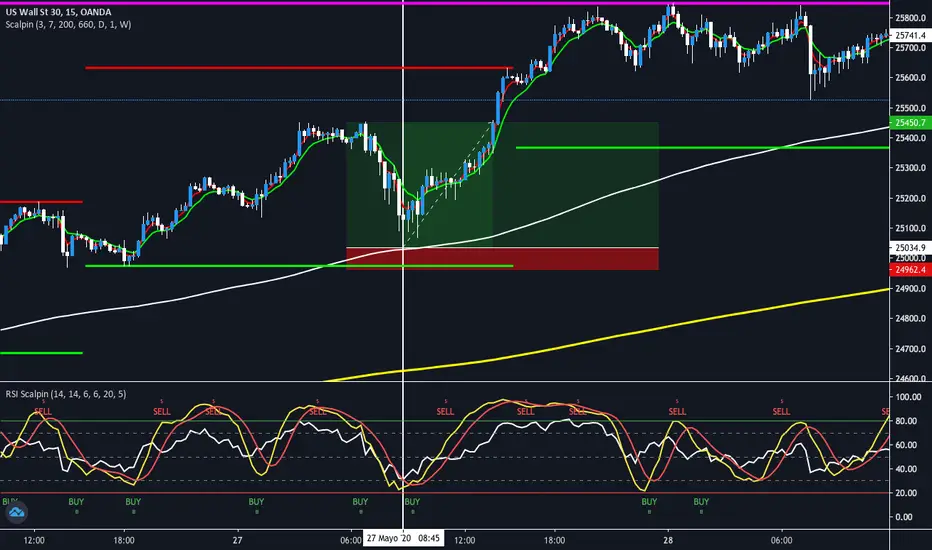
Scalpin 30Pips
Indicator signs
-Buying or selling signal on screen
-RSI in overbought or oversold
-Stoch overbought or oversold
"Risk adjustment"
The expected profit is 30pips positive. Adjust risk by 30pips
indicator consisting of
Stoch 14, 6, 6
Rsi 14
Dmi 20, 5
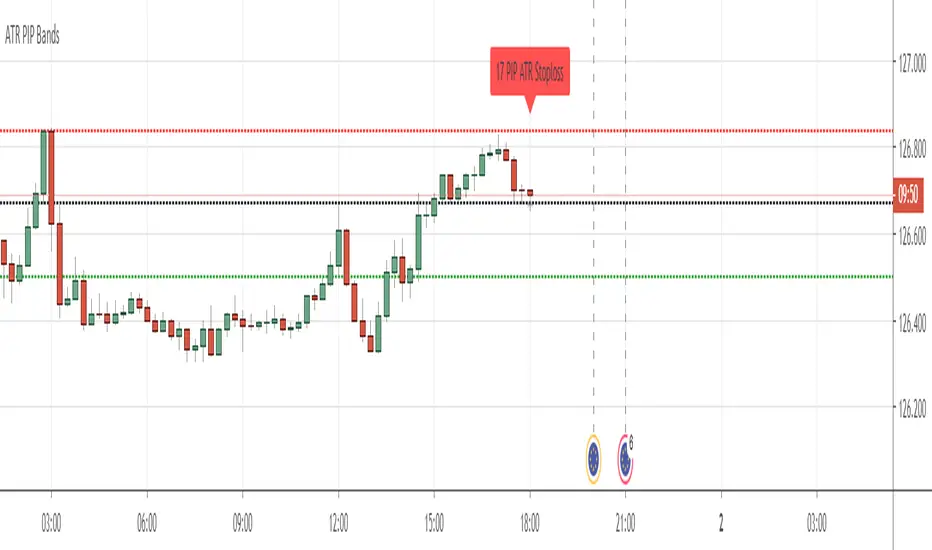
PIP BandsGot a little board due to the lock-down so I have written this little script.
It allows you to set PIP Bands at levels on the chart.
The Back Line is Close plus Spread, the Red Line is PIPs below and the Green Lines are spaced at PIPs above at equal distance.
The top four lines can be toggled off. Set off as default.
There is a toggle for JPY Currencies and also for Puts and Calls.
You can change the Spread and also the distance between bands by a set amount of PIP's.
You can either let it run at current close price or set price.
Hope you enjoy. Be safe.
Comments appreciated.
Best Volatility CalculatorHello traders,
This indicator shows the average volatility, of last N Periods, for the selected time frames.
You can select up to 2 timeframes with this version
Volatility is defined as the close of current candle - close of the previous N candle
Presented as Currency, Pip, percentage labels in a panel below.
Will calculate in real-time only for the current instrument on the chart.
The indicator is coded to not be repainting
Example
In the indicator screenshot, I used a lookback period of 1.
That compares the current candle close versus the previous one for the daily and weekly timeframe
Showing how the results are calculated for the weekly calculations
Enjoy :)
Best regards
Dave

Engulfing Scanner v1This indicator helps you to quickly identify bullish and bearish engulfing patterns.
Works on currencies only (pips required).


J-PipsI made this tool to measure the exact PIP range of different currency pairs in an easy to understand format.
It comes with the option to convert the PIP Values to XXX/JPY Pairs with a simple check-box.
"H" is the highest PIP movement in 377 time periods.
"N" is the EMA-377 of the PIP ranges.
"P" is the current time periods PIP moment (true range).
