SMC Execution Engine by @abdallacryptoSMC Execution Engine by @abdallacrypto is a Smart Money Concepts structure and execution toolkit that turns price action into a clear, rules-based map.
It automatically detects swing structure, BOS and CHOCH, tracks the active structural anchor, and projects clean Fibonacci retracement levels built from the current context. It also draws the latest context Order Block and adds optional intrabar alerts for high-probability confluence events (OB touches, 0.79 and 0.618 fib interactions, OB plus fib, and sequential “fib then OB” logic). A multi-timeframe HUD (5m to 1M) shows structural bias and RSI so you can align execution with higher-timeframe context.
This is not a buy/sell signal generator. It is a structure reader and execution framework designed to reduce noise, improve consistency, and help you act with clarity.
Suggested use: identify context with CHOCH and anchor, wait for price to return to key fib levels and the active Order Block, then execute your own risk plan.
Full documentation:
🇺🇸 beneficial-hyena-c1e.notion.site
🇧🇷 beneficial-hyena-c1e.notion.site
🇪🇸 beneficial-hyena-c1e.notion.site
Titik pangsi dan tahap


Range EncapsulatorWhen a user selects a start date and the desired duration, the specified date range will be highlighted. High and low data lines corresponding to this range will be drawn. Additionally, quarter-point interval lines from the previous data range will be displayed between the high and low lines of the current range, provided they fall within those boundaries.

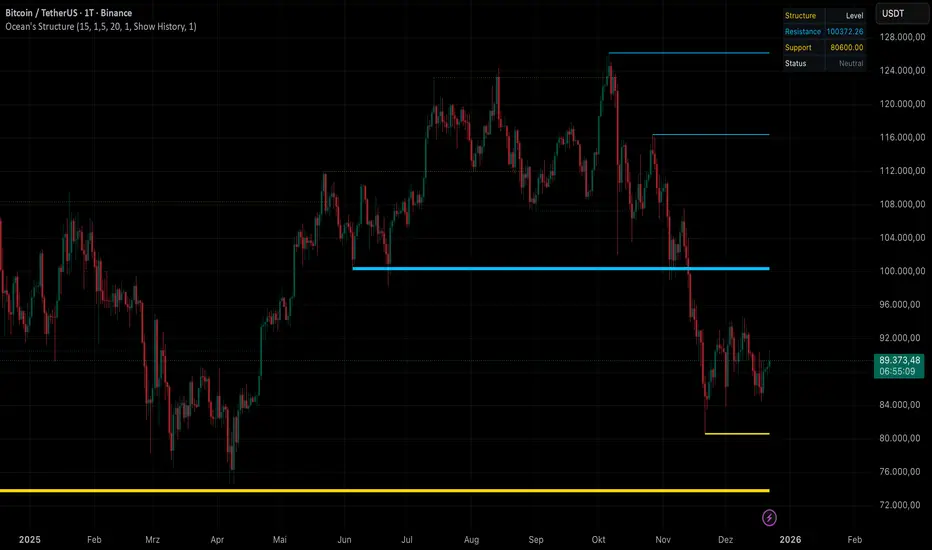
Ocean's Smart Structure [Pro]Ocean's Smart Structure – Professional Market Architecture
Stop guessing where the liquidity is.
Ocean's Smart Structure is a next-generation technical analysis suite designed for precision traders. Unlike standard pivot indicators that clutter your chart with noise, it uses a Volatility-Adaptive Clustering Algorithm to merge, filter, and validate the levels that actually matter.
It doesn't just draw lines; it understands market behavior. It detects when support flips to resistance, identifies liquidity grabs (fakeouts), and visually indicates the strength of every zone.
🌊 Key Features
1. Volatility-Adaptive Clustering
Markets expand and contract. Standard indicators fail because they use static values. It calculates the Average True Range (ATR) in real-time to determine the effective width of a zone.
Result: Nearby pivots are intelligently merged into single, robust "Structural Clusters."
2. Advanced Role Reversal (Flip Logic)
Price rarely respects a level once. When a strong Support breaks, it often becomes Resistance.
The Logic: The indicator automatically flips lines from Support (Gold) to Resistance (Blue) upon a confirmed break, keeping the history of that price level alive on your chart.
3. Institutional Fakeout Protection
The unique selling point of this tool. Algorithms often push price past a level to trigger stop-losses before reversing.
Standard Indicators: Delete the level immediately upon a break.
This Tool: Enters a "Pending Break" state. If the next candle reclaims the level, the line is preserved and strengthened, marking it as a Liquidity Grab rather than a breakout.
4. Dynamic Strength Visualization
Not all levels are equal.
Visual Feedback: As a level is tested more times without breaking, the line automatically becomes thicker. This allows you to instantly identify "Concrete Walls" vs. "Glass Windows" at a glance.
5. Real-Time HUD (Heads-Up Display)
A clean, non-intrusive dashboard sits on your chart, providing instant context:
Nearest Resistance & Support: Exact price ticks.
Live Status: Tells you if price is "Ranging," "At Support," or "At Resistance" based on volatility proximity.
⚙️ Settings & Customization
Pivot Period: Adjust sensitivity to swing highs/lows.
Cluster Sensitivity: Controls how aggressive the merging algorithm is.
Role Reversal Limit: Limit how many times a level can flip (preventing infinite ping-pong lines).
Invalidation Action: Choose to delete broken lines or keep them as "Ghost Levels" (dotted history).
Visuals: Fully customizable branding colors (Default: Gold & Neon Blue).
NQ Geometric Trading System NQ Geometric Trading System
Advanced confluence indicator for NQ futures implementing Michael S. Jenkins' geometric methodology.
Core Features:
Automatic spike detection (9:30-9:35) captures institutional footprint
Geometric levels from opening range using Jenkins ratios (R_50, R_25, R_67, extensions)
Rising zero angles provide dynamic time+price support/resistance
Fibonacci time windows highlight natural reversal periods
Weighted confluence algorithm (spike levels = 2x, others = 1x)
Real-time dashboard displays score 0-10 and signal strength
Customizable alerts for high-probability setups
How It Works:
System automatically detects opening spike extremes, calculates geometric ratios from 9:30-10:00 range, projects zero angles rising at 0.75 points/minute, and highlights Fibonacci time windows. When multiple factors align, dashboard shows confluence score with color-coded signals (Strong 5+, Trade 4, Watch 3).
Optimized For:
NQ/MNQ scalping and day trading on 1-5 minute timeframes. Works best during regular trading hours with timezone set to Exchange.
Customizable:
15+ parameters including angle rate, confluence threshold, price tolerance, time windows, and visual settings. Default optimized for NQ but adaptable.
Requirements:
Chart timezone must be "Exchange" or "America/New_York" for proper spike/range detection.
Perfect for traders seeking mechanical, objective signals based on proven geometric principles.

Pivot Levels [BigBeluga]🔵 OVERVIEW
The Pivot Levels indicator automatically detects and draws key market pivot levels across multiple sensitivity settings. Each pivot level represents a significant local high or low in price structure, acting as potential zones of support and resistance. Traders can visualize short-, medium-, and long-term pivot layers simultaneously, helping to identify where price may react, reverse, or break out.
🔵 CONCEPTS
Different pivot lengths provide multi-length sensitivity on the same timeframe — shorter lengths detect local micro-swings, while longer lengths capture broader swing structure within the current chart.
ATR-based color logic marks active, bullish, or bearish pivot zones dynamically.
Lines can extend to the right or both sides to track reactions over time.
🔵 FEATURES
Detects up to four custom pivot levels simultaneously.
Each pivot level has independent settings for length , style , and extension mode .
Auto-colors each pivot as support (green), resistance (orange), or active zone (blue).
Displays dual-width line layers: a solid base and a transparent overlay for visual depth.
Dynamic price labels show exact pivot levels for clarity.
Fully customizable line styles: dashed (--), solid (-), or dotted (..).
Extends lines to the right for future reaction tracking or both directions for structure alignment.
🔵 HOW TO USE
Enable or disable pivot levels (1–4) to control how many layers of structure you want visible.
Use shorter pivot lengths for intraday turning points and longer ones for macro structure.
Watch for multiple pivot lines clustering in the same region — these often mark strong reversal zones.
Observe color changes: green = support, orange = resistance, blue = active neutral zone.
Combine with price action or volume analysis to confirm reactions near major pivots.
🔵 CONCLUSION
The Pivot Levels indicator provides a clean, multi-layered visualization of market structure.
By tracking pivots of varying lengths, traders can easily identify overlapping support and resistance regions, gauge breakout strength, and align trades with the dominant structural zones visible across multiple time horizons.

MarketMastery Pivot Matrix by DGTThe MarketMastery Pivot Matrix is an advanced pivot point framework designed to provide comprehensive market context, bias assessment, and trend analysis. It integrates multiple pivot calculation methods, central pivot ranges, higher-timeframe references, and a suite of add-on indicators to deliver a complete market structure toolkit. Suitable for intraday, swing, and positional traders, the tool consolidates key support/resistance levels, equilibrium zones, directional flow, and volatility insights into a single, visually intuitive interface.
KEY FEATURES
⯌ Pivot Point Framework
The MarketMastery Pivot Matrix offers a complete solution for analyzing pivot points, price equilibrium, trend direction, and volatility. Supporting multiple pivot calculation methods—including Camarilla, Fibonacci, Swing, Traditional, and Woodie—it allows traders to customize analysis according to strategy and timeframe.
⯌ Central Pivot Range (CPR)
CPR is a core component of the Pivot Matrix, offering a clear view of market structure and key decision zones. Traditionally used for intraday analysis, CPR is equally effective on higher timeframes (daily, weekly, monthly), highlighting support/resistance, market balance, and swing opportunities. Integrated within the Pivot Matrix, it works seamlessly with other pivot components to provide a comprehensive trading framework across all timeframes.
⯌ Higher-Timeframe OHLC References
Displays previous session Open, High, Low, and Close from user-selected or dynamically calculated higher timeframes. Assists traders in assessing intraday support/resistance and session reactions.
⯌ Pivot High-Low Levels
Identifies key swing highs and lows as well as short-term potential pivot points. Highlights support/resistance zones, helping traders assess market structure, anticipate reversals, and spot trend continuation opportunities.
⯌ Directional Flow State
Combines ADX and DMI to provide clear insight into trend direction, strength, and momentum. Helps distinguish valid trending conditions from weak or ranging periods.
⯌ Mean Proximity State
Measures price deviation from equilibrium to classify balanced, extended, or extreme market states. Assists in evaluating potential reversion pressure and volatility expansion.
⯌ Logistic EMA Trend State (LEMA)
Applies a logistic transformation to price dynamics, smoothed by EMA for adaptive trend detection. Provides responsive trend visualization with reduced noise, helping identify trend direction and momentum.
⯌ Ichimoku Cloud Projection
Extends the Kumo cloud forward to visualize market bias, momentum, and dynamic support/resistance. Helps identify consolidation, trend direction, and equilibrium zones.
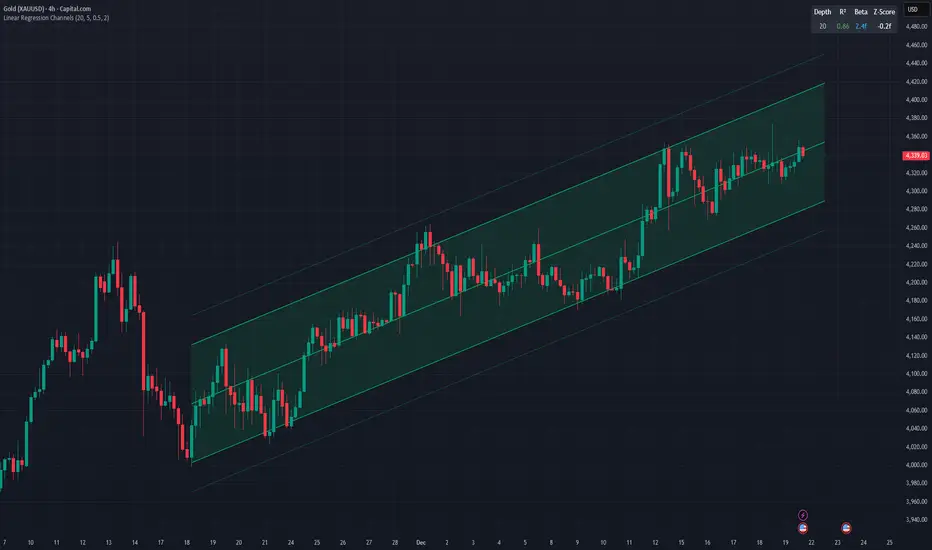
⯌ Linear Regression Channel
Fits a least-squares trend line to price, displaying slope and price dispersion. Helps traders identify trend direction, stability, and volatility.
⯌ Market Sentiment State
Evaluates market bias by analyzing price position relative to CPR and pivot levels. Provides a quick visual assessment of bullish, bearish, or neutral conditions.
⯌ Price Range & ATR State
Displays current and previous higher-timeframe ranges alongside ATR-based expected ranges. Helps assess volatility, monitor session expansion/contraction, and identify potential exhaustion zones.
DISCLAIMER
This script is intended for informational and educational purposes only. It does not constitute financial, investment, or trading advice. All trading decisions made based on its output are solely the responsibility of the user.
Skrip berbayar

ORACLE v13: The Gamified Market HUDORACLE v13 is not just an indicator; it is a complete Trading HUD (Heads-Up Display) that translates complex market data into an intuitive, video-game-style interface. It turns abstract concepts like "volatility" and "support/resistance" into actionable game mechanics, allowing you to react faster and trade smarter.
⚔️ Key Features:
🛡️ Boss & Shield Mechanics (Support/Resistance):
Automatic detection of key levels visualized as "Bosses" (Resistance) and "Shields" (Support).
HP System: Watch price "damage" these levels in real-time. When "Boss HP" hits zero, a breakout is imminent.
🔮 The Bestiary (Market Conditions):
Instantly identifies the "Enemy Type" you are fighting:
🟢 SLIME: Squeeze zone (low volatility, prepare for a move).
👺 GOBLIN: Chop/Noise (high risk, avoid trading).
🐉 DRAGON: Strong Trend (ride the momentum).
👹 BERSERKER: Extreme Volatility (proceed with caution).
📈 Live Structure Mapping:
Real-time ZigZag overlays with automatic HH/LL/LH/HL labels.
Breakout Flash: Candles flash WHITE instantly when major structure or Boss levels are broken.
🎮 Combat Stats:
Combo Counter: Tracks consecutive directional candles.
Aggro Meter: Visualizes volume intensity.
Loot Drop Rate: innovative metric calculating the probability of a profitable move based on current ATR.
Momentum Bar: RPG-style health bar for trend strength.
Why use ORACLE? Most indicators just draw lines. ORACLE gives you Context. It tells you exactly what kind of market environment you are in so you never bring a knife to a Dragon fight. Perfect for scalpers and day traders who need instant situational awareness.
Settings: Fully customizable Lookback periods, ZigZag sensitivity, and Visual Themes.

Previous Days Settlement Price📌 Indicator Description — Previous Days Settlement Prices
Previous Days Settlement Prices is a clean, efficient Pine Script v6 indicator designed for intraday futures and high-precision price reference. It automatically tracks and displays the settlement prices from the previous trading days — anchored to the exact bar where each settlement occurred — and plots each as a horizontal level extending into the current session with customizable visual styles and labels.
⚙️ Core Purpose
Settlement prices represent the officially determined price at which futures contracts settle each trading day — a level often watched by professional traders for support, resistance, acceptance, or rejection behavior. Unlike standard previous-close or high/low indicators, this script uses anchored historical data tracking to accurately record where each settlement happened and visually maintain that reference throughout the subsequent intraday session.
🧠 Original Approach
Rather than relying on request.security lookups alone, this script uses bar-based tracking and array storage to maintain precise settlement values (close price of the last bar of each session). This method ensures:
Accurate anchoring to the actual bar index where the settlement completed, not just price aggregation.
Clean, customizable rendering with dashed/dotted/solid lines and dynamic labels.
Scales elegantly across multiple days without chart clutter.
📊 What It Displays
Up to N previous days’ settlement price levels (configurable, 1–9).
Levels are drawn as horizontal lines from the original settlement bar to the current bar.
Labels with formatted price values display at the rightmost edge of the chart.
Colors, line style (solid/dashed/dotted), line width, and label size are all user-configurable.
🎯 Designed For
Intraday futures traders who rely on settlement levels as reference points.
Traders who want precise anchoring of historical settlement levels for context, not simple static prior-day closes.
Those who prefer a light UI footprint with clear, extendable horizontal levels and reading labels.
📌 Key Indicator Configurations
Number of Days to Show – Choose how many previous settlement levels to display.
Line Style & Width – Customize visual clarity across timeframes.
Label Appearance – Choose color and size for easy identification.
📖 Important Notes for Use
This indicator is optimized for intraday timeframes where settlement references matter most.
Levels are anchored to their actual session close bar, offering a more precise historical reference than simple session closes.
Adjust your chart settings (session times) to match the market you’re trading for best alignment.

BulletProof Long Wick Reversal Markers with LinesThis custom Pine Script indicator for TradingView identifies and marks potential reversal points on your chart based on long wick candles at swing highs (tops) and lows (bottoms). It focuses on candles where the wick is significantly longer than the body (e.g., shooting stars or hammers) and where the subsequent price reversal exceeds a minimum percentage move. Markers appear as colored circles (green for tops, red for bottoms), with horizontal lines extending from each marker to the current bar for easy reference as support/resistance levels.Key Features and InterpretationMarkers (Dots): Green circles at tops: Indicate a potential bearish reversal where price was pushed down after a long upper wick candle.
Red circles at bottoms: Indicate a potential bullish reversal where price was pushed up after a long lower wick candle.
These only appear if the wick-to-body ratio meets the threshold (default 2.0) and the reversal move is at least the minimum percentage (default 1%).
Lines: Horizontal lines extend from each marker to the current bar (updating in real-time). Use these as dynamic levels—e.g., a green top line might act as resistance, while a red bottom line could be support. Lines do not extend into the future blank space on the chart.
Time Filtering: By default, only markers from the last 7 days are shown to reduce clutter. Set to 0 to display all historical ones.
Best Used On: 1-hour charts as per your request, but it works on any timeframe. It's ideal for spotting reversals in trending markets or confirming entries/exits with other indicators.

Bollinger Reversal + Swing ExitBollinger Reversal + Swing Exit is a mean-reversion strategy designed to capture short-term reversals when price stretches to an extreme and then shows the first signs of rejection.
1. Core idea
This strategy assumes that sharp deviations from a central equilibrium are often followed by a corrective move back toward normal pricing. It does not chase trends. Instead, it waits for price to reach an extreme area and then looks for a controlled turn back in the opposite direction.
2. Signal concept
A setup starts only after price reaches an outer extreme zone. The trade is taken only if the market immediately shows a reversal-type reaction rather than continuing to push outward. This reduces entries that happen too early while the move is still accelerating.
3. Long and short behavior
Long trades are allowed only after a downside extreme has been reached and price begins to recover.
Short trades are allowed only after an upside extreme has been reached and price begins to fade.
The goal is to enter close enough to the extreme to keep risk contained, while still requiring evidence that the turn has started.
4. Risk control
Risk is defined tightly. The protective stop is placed where the reversal thesis is clearly invalidated, so the strategy is built to accept small losses when the market does not revert and continues expanding in the same direction.
5. Exit logic
Profits are taken based on local market structure rather than fixed targets. Once in a position, the strategy looks for a clear exhaustion point in the move and closes the trade when the short-term swing structure signals that the rebound or pullback has likely completed. This aims to capture the core of the corrective move without overstaying.
6. Best conditions
This approach performs best in range-bound markets, during consolidations, and in instruments that frequently oscillate around a fair value. It is also useful after impulsive spikes when the move becomes overstretched and liquidity rebalances.
7. When to avoid
Avoid using it during strong, clean trends and during persistent breakout phases, where extremes can keep extending and reversals can fail repeatedly. In these conditions, mean-reversion setups can be systematically punished.
8. What to expect
Expect a higher trade frequency than trend-following systems, with many small-to-medium wins and occasional sharp losses when the market refuses to revert. The edge comes from disciplined entries only after extremes and quick exits when structure signals completion.

Highs & LowsIntroduction: This indicator marks highs and lows from the previous New York, Asian, and London sessions, including the daily high and low. It is made to be as user friendly/adjustable as possible.
It was designed around trading during the New York morning session, using the 1 hour and 1 minute(or similar) timeframes in conjunction.
Settings: Common settings for the cleanest viewing are as follows:
1 Hour Chart Settings:
Box #3 "Label Vertical Offset" to "18".
Box #4 "Label X Offset" to "2".
1 Minute Chart Settings:
Box #3 "Label Vertical Offset" to "2".
Box #4 "Label X Offset" to "0".
Note: Adjusting text to the darkest "black" setting may provide the best contrast.

Session Opening Bar RangeSession Opening Bar Range (OBR) - Advanced Opening Range Indicator with Statistical Analysis
Overview
The Session First Bar Range (FBR) indicator is a comprehensive tool that captures and projects key levels based on the first bar of a user-defined trading session. Unlike traditional daily opening range indicators, this script allows traders to focus on specific session windows (New York RTH, London, Asia, etc.) and analyze price behavior relative to the initial momentum established in that session's opening bar.
What makes this indicator unique is its combination of three distinct projection methodologies: statistical analysis based on historical range data, Fibonacci extensions, and fixed-point rotation levels commonly used by institutional traders. To our knowledge, this is the only opening range indicator that incorporates statistical standard deviation levels calculated from historical first bar ranges, making it both a technical and probabilistic tool.
Core Concept
The opening range concept is based on the principle that the initial price action of a trading session often sets the tone for the remainder of that session.
Professional traders have long observed that:
The first bar's high and low act as key reference points
Price often respects or breaks these levels with significance
Expansion beyond the opening range tends to occur in measurable increments
This indicator takes these observations and enhances them with:
Historical probability analysis - "Based on the last 60 sessions, price typically extends X standard deviations beyond the opening range"
Proportional projections - Fibonacci-based extensions showing where measured moves typically target
Fixed-point rotations - Institutional rotation levels (e.g., 65 points for NQ, 15 points for ES)
How It Works
Session Detection & First Bar Capture
The indicator uses Pine Script's time() function with timezone support to precisely detect when a trading session begins. When the first bar of the selected timeframe occurs within the session window, the script captures:
High (H): The high of the first bar
Low (L): The low of the first bar
Mid (M): The midpoint (hl2) of the first bar
Critical Detail: These levels are fixed from the first bar only - they do not update as the session progresses. This differs from many "opening range" indicators that use a time period (e.g., first 30 minutes). Here, you select the bar timeframe (default 5-minute), and only that single first bar's range is captured.
Statistical Level Calculation
The indicator maintains a rolling array of the last N session's first bar ranges (default: 60 sessions). For each new session, it calculates:
Average Range: Mean of historical first bar ranges
Standard Deviation: Volatility of those ranges
Projection Levels: High/Low ± (Average Range + Std Dev × Multiplier)
This provides probability-based levels. For example, a +2σ level suggests: "Historically, price extending this far beyond the opening range is a 2-standard-deviation event (approximately 95th percentile)."
Fibonacci Extensions
Using the first bar range as the base unit (100%), the indicator projects Fibonacci levels:
100% extension: One full range above the high / below the low
1.618x extension: (Default) Golden ratio projection
2.618x, 3.618x extensions: Additional Fibonacci levels
Calculation: Range = H - L, then Target = H + (Range × Multiplier) for upside projections.
OR Rotation Levels
These are fixed-point increments from the first bar's high and low. Unlike percentage-based methods, rotations use absolute point values:
NQ traders often use 65-point increments
ES traders often use 15-point increments
Gold/bonds use different values
The indicator draws 5 levels above the high (R+1 through R+5) and 5 below the low (R-1 through R-5), each separated by your specified point increment.
Features:
Session Options
Pre-configured Sessions:
New York RTH (9:30am - 4:00pm)
New York Futures (8:00am - 5:00pm)
London (2:00am - 8:00am)
Asia (7:00pm - 2:00am)
Midnight to 5pm
ZB/Gold/Silver OR (8:20am - 4:00pm)
CL OR (9:00am - 4:00pm)
Custom Session: Define your own start/end times in HHMM format
Timezone Support: All sessions respect the selected timezone (default: America/New_York)
Customizable Timeframe
Select any timeframe for the first bar (1min, 5min, 15min, etc.)
Default: 5-minute bars
Important: This is the timeframe for the first bar capture, independent of your chart's timeframe
Display Options
Historical Ranges: Show/hide past session ranges (with configurable limit to manage performance)
Line Styles: Choose between Solid, Dashed, or Dotted for range lines and midline
Label Position: Left or Right side of range
Show Prices: Optionally display actual price values on labels
Custom Colors: Fully customizable colors for all components
Statistical Levels
Lookback Period: Number of historical sessions to analyze (default: 60)
Two Multiplier Levels: Default 1σ and 2σ, fully adjustable
Separate styling: Different line styles (dashed vs dotted) for each sigma level
Optional Labels: Show/hide sigma notation labels
Fibonacci Extensions
Four Extension Levels: 100%, 1.618x, 2.618x, 3.618x (all customizable)
Bidirectional: Projections both above and below the opening range
Optional Labels: Toggle percentage/multiplier labels
OR Rotation Levels
Configurable Increment: Set the point value for your instrument
Five Levels Each Direction: R±1 through R±5
Dynamic Labels: Show both rotation number and point value (e.g., "R+1 (65)")
Three Line Styles: Solid, Dashed, or Dotted
How to Use
Setup
Add the indicator to your chart
Select your trading session from the dropdown
Set the timeframe for first bar capture (typically 5-15 minutes)
Configure which projection methods you want to see (Statistical, Fibonacci, and/or Rotations)
For Day Traders
Scenario: Trading NQ during New York RTH
Session: Select "New York RTH (9:30am - 4:00pm)"
Timeframe: 5-minute (captures 9:30-9:35 bar)
Enable: OR Rotations with 65-point increments
Strategy:
Watch for acceptance/rejection at rotation levels
Use R+1/R-1 as initial profit targets
R+2/R-2 as extended targets
Statistical levels show when price is in "outlier" territory
and rotation levels
Performance Notes
The indicator limits objects to stay within TradingView's constraints (500 max)
If you enable all features, reduce "Maximum Historical Ranges" to prevent slowdown
Typical configuration: 10-20 historical ranges with all features enabled works well
Settings Guide
Session Settings
Session: Choose from pre-configured sessions or "Custom"
Custom Session Start/End: HHMM format (e.g., "0930" for 9:30am)
Timezone: Critical for accurate session detection
Opening Bar Format
Timeframe: The bar size for capturing the first bar's range
Show Midline: Toggle the mid-point line
Show Historical Ranges: Display previous sessions (recommended: leave ON)
Maximum Historical Ranges: Limit history to manage performance (1-500)
Range Style / MidLine Style: Solid, Dashed, or Dotted
Position: Label placement (Left or Right)
Show Prices: Include actual price values on labels
Statistical Levels
Lookback Periods: How many historical first bar ranges to analyze (default: 60)
Std Dev Multiplier 1/2: The sigma levels to project (default: 1.0 and 2.0)
All visual settings (colors, line width, label size)
Fibonacci Extensions
Show Fib Extensions: Enable/disable Fibonacci projections
Measured Move Extensions 1-4: The multipliers (default: 1.618, 2.618, 3.618, 4.618)
Visual customization options
OR Rotations
Rotation Increment: The point value for your instrument
NQ: 65 points
ES: 15 points
Adjust for other instruments based on their typical rotation behavior
Show Rotation Labels: Display level numbers and point values
Visual customization options
Use Cases
Gap Trading: When price gaps away from previous day's close, the first bar range shows the initial gap acceptance/rejection zone
Breakout Confirmation: Price breaking and holding above the first bar high with volume suggests trend day potential. Rotation levels provide measured targets.
Reversal Identification: Price reaching +2σ statistical level = rare event, potential exhaustion
Range Bound Days: Price oscillating between first bar high/low suggests range-bound session; trade reversals at extremes
Institutional Level Awareness: OR Rotations at 65 points (NQ) align with levels professional traders watch
Technical Notes
The indicator uses request.security() with lookahead=barmerge.lookahead_on to ensure the first bar levels are captured correctly
All drawing objects (lines, labels, fills) are managed in arrays with automatic cleanup to prevent memory issues
The statistical calculations use array.avg() and array.stdev() for accurate probability estimates
Rotation levels use individual line variables (like Fibonacci) rather than loops for reliability
Summary
This indicator is original in its combination of three distinct methodologies for projecting levels from a session's opening range:
Statistical Analysis - No other opening range indicator (to our knowledge) calculates standard deviation projections from historical first bar ranges
Time-Based Session Flexibility - Most OR indicators use only daily or fixed time periods; this allows any custom session window
Multiple Projection Methods - Traders can use statistical, Fibonacci, AND rotation levels together or separately

King Trade 4-hour buy/sell strategyThis is a buy/sell system for 4-hour candlestick charts. For best results, use it on Heiken Ashi candlestick charts.

Smart Triangles & S/R SystemOverview This indicator is a comprehensive technical analysis tool designed to automatically identify dynamic chart patterns and institutional support/resistance structures. Its primary focus is on detecting valid Triangle Patterns (Symmetrical, Ascending, Descending) and identifying high-probability breakout zones using a proprietary "Smart Apex" algorithm.
Why is this script Protected? This script utilizes a unique, custom-built algorithm called "Smart Start & Apex Validation". Unlike standard pivot-based indicators, this system dynamically recalculates the starting points of trendlines to exclude false wicks and noise (Smart Start). Furthermore, it employs a geometric validation logic that calculates the exact intersection point (Apex) of the trendlines to ensure the triangle exists in the future and has not already invalidated itself mathematically. Due to the complex and proprietary nature of these calculation methods and the specific filtering logic for "Fresh" vs. "Broken" horizontal levels, the source code is protected to maintain the integrity of the strategy.
Key Features
Smart Triangle Detection:
Uses Pivot Highs/Lows to draw trendlines.
Smart Start Logic: Automatically shifts the trendline start point if a candle body violates the slope, ensuring lines "hug" the price action correctly.
Apex Validation: Ensures lines are converging and the intersection point is valid.
Institutional S/R Levels:
Automatically plots horizontal Support and Resistance levels based on historical pivot clusters.
Distinguishes between Fresh Levels (Untouched) and Broken Levels (flipped S/R), color-coded for visual clarity.
Dynamic Targets:
Projects breakout targets based on the triangle's opening height (Base).
Target Memory: Once a breakout occurs, the target remains fixed on the chart until a completely new pattern invalidates it, allowing traders to track the trade lifecycle.
How to Use
Trendlines: Look for price compression between the Red (Resistance) and Green (Support) dotted lines.
Breakouts: Wait for a candle close outside the triangle structure. The indicator will generate a "Target Flag" indicating the potential price objective.
Confluence: Use the horizontal S/R lines as confirmation for entry or stop-loss placement.
Settings
Triangles: Adjust pivot lengths to catch larger or smaller structures. Toggle "Smart Start" for cleaner lines.
Slope Rules: Filter out weak patterns by enforcing minimum slope requirements.
S/R Zones: Customize the lookback period and visibility of horizontal levels.
Development & Feedback I am actively developing this tool to make it the definitive structure indicator. I highly value community feedback. Please leave your suggestions or feature requests in the comments section below. I read all feedback to improve future versions.
Disclaimer: This tool is for educational purposes and assists in technical analysis. Past performance is not indicative of future results.

Interest ZonesThis indicator automatically identifies and plots "Interest Zones" around significant pivot highs and lows, representing potential areas of institutional interest, support/resistance, or accumulation/distribution. Zones are dynamically merged when pivots cluster near the same price level and extended for visibility.
How It Works (Technical Methodology)
Pivot Point Detection
The indicator uses Pine Script's ta.pivothigh() and ta.pivotlow() with asymmetric left/right lengths (default left=20, right=13) to detect swing highs and lows. This allows for customizable sensitivity – longer left for stronger confirmation, shorter right for faster detection.
Zone Start Condition (Filtering)
Multiple modes control from which point in history zones begin to be drawn:
"None": All historical pivots (limited by max zones).
"Auto (Start of Day)": Zones only from the beginning of the current trading day (resets daily).
"Manual Date": User-defined fixed date.
"Interactive (Chart)": User-confirmed date via input (useful for backtesting specific periods).
"Last X Bars": Only pivots within the last user-defined number of bars (default 400).
A vertical line marks the start point in date-based modes for visual reference.
Zone Construction
For each valid pivot:
Zone thickness is based on ATR(14) × user-defined multiplier (default 0.3) for dynamic, volatility-adjusted height.
Pivot High zones: Centered below the high (potential supply/resistance).
Pivot Low zones: Centered above the low (potential demand/support).
Zones are drawn as boxes extending to the right, with gray fill and border.
Merge & Overlap Logic
When a new pivot falls inside an existing zone or is very close (within user-defined "Proximity Sensitivity %" of the zone's midpoint, default 1.1%):
The new pivot is merged into the existing zone.
A counter ("x2", "x3", etc.) is displayed on the zone, indicating how many pivots have clustered there.
The zone is strengthened visually (counter text) and extended further right.
This highlights high-interest levels where price repeatedly reversed.
Zone Management
In "None" mode: Only the most recent user-defined max zones are kept (default 5) – oldest deleted automatically.
In other modes: Up to ~490 zones (performance limit), oldest pruned if exceeded.
All zones auto-extend to the right on the last bar for continuous visibility.
Visual Elements
Uniform gray color for all zones (configurable).
Transparent background fill (adjustable).
Counter text in white (configurable) when zones have multiple touches.
Clean, non-directional design – focuses purely on clustered reversal points.
How to Use
Interest Zones highlight price levels where the market has shown repeated respect through multiple swing pivots – often coinciding with institutional order clusters, psychological levels, or hidden support/resistance.
Higher counter values ("x3+", "x5+"): Stronger zones – higher probability of reaction on retest.
Use for:
Potential reversal or bounce areas when price approaches a zone.
Confluence with other tools (order blocks, FVG, volume profile, etc.).
Stop-loss placement beyond zones or take-profit at opposite zones.
Daily reset ("Auto Start of Day"): Ideal for intraday trading – fresh zones each session.
Backtesting: Use "Manual" or "Interactive" date modes to analyze specific historical periods.
"Last X Bars": Good for medium-term swing analysis without full history clutter.
Adjust ATR multiplier for tighter (lower) or wider (higher) zones based on asset volatility. Increase proximity sensitivity for more aggressive merging in ranging markets.
Combine with trend direction, volume, or higher-timeframe structure for best results.
Disclaimer
This indicator is a technical analysis tool and should be used in conjunction with other forms of analysis. Past performance does not guarantee future results. Always use proper risk management.

Order Blocks & ImbalanceThis indicator automatically identifies and plots Order Blocks (also known as Fair Value Gaps or Imbalances) based on Smart Money Concepts (SMC) and ICT methodology. It detects significant price inefficiencies (gaps between candles) that often act as institutional supply or demand zones.
How It Works (Technical Methodology)
1. Fair Value Gap (FVG) Detection
The indicator identifies classic 3-candle imbalances:
- Bullish Order Block (Demand): When the low of the current candle is significantly below the high of the candle two bars ago (low - high ).
- Bearish Order Block (Supply): When the high of the current candle is significantly above the low of the candle two bars ago (low - high ).
A minimum size threshold is enforced using ATR(14) × user-defined multiplier (default 0.5) to filter out minor gaps and focus on meaningful inefficiencies.
2. Zone Creation
- Bullish zones are created at the candle two bars ago (the "origin" candle where inefficiency occurred).
- Bearish zones use the same origin candle.
- Zone boundaries:
Top = high of origin candle
Bottom = low of origin candle
This captures the full range where price moved aggressively, leaving an imbalance that institutions may later revisit.
3. Mitigation Detection
Zones can be mitigated in two ways (user-selectable):
- "Close": Zone is considered touched only if the close price enters the zone.
- "Wick": Zone is touched if any wick (high/low) enters the zone (more sensitive).
When mitigated:
- Background becomes more transparent
- Border turns dotted
- Label changes to "Mitigated"
Broken zones (price fully closes beyond the opposite side) are automatically deleted.
4. Zone Lifecycle Management
- Active Zone: Strong color fill (green for demand, red for supply) with solid border.
- Mitigated Zone: Faded color, dotted border – indicates partial fill or reduced strength.
- Broken Zone: Automatically removed from chart to reduce clutter.
Old zones are also pruned when exceeding 450 total to maintain performance.
5. Smart Visibility Engine (Optional)
When enabled:
- All zones are initially hidden.
- Only the closest relevant zones are shown:
- Up to user-defined limit (default 10) highest bullish zones (closest below price)
- Up to user-defined limit (default 10) lowest bearish zones (closest above price)
- Visible zones are automatically extended to the right and styled appropriately.
This keeps the chart clean while highlighting the most actionable zones near current price.
6. Visual Elements
- Demand Zones: Green fill, labeled "OB Demand"
- Supply Zones: Red fill, labeled "OB Supply"
- Tiny text size to minimize chart clutter
- Zones drawn as boxes using bar_index positioning
How to Use
Order Blocks represent areas of price inefficiency where smart money likely entered/exited positions aggressively.
- Demand Zones (Green): Potential long entry areas when price returns. Expect buying pressure to defend these levels. Best setups when price retests an active (non-mitigated) zone.
- Supply Zones (Red): Potential short entry areas when price returns. Expect selling pressure to emerge.
- Mitigated Zones: Lower probability – may act as weaker support/resistance.
- Smart Visibility: Highly recommended for cleaner charts. Focuses attention on zones most likely to be tested soon.
- Combine with:
- Break of Structure (BOS)/Change of Character (CHOCH)
- Liquidity grabs
- Higher timeframe confluence
- Volume or momentum confirmation
Use higher FVG threshold (e.g., 0.8–1.0) for fewer, higher-quality zones. Lower threshold for more aggressive detection.
Disclaimer
This indicator is a technical analysis tool and should be used in conjunction with other forms of analysis. Past performance does not guarantee future results. Always use proper risk management.

Linear Regression ChannelsThis indicator dynamically identifies and plots the best-fit linear regression channels based on recent pivot points, optimizing for statistical strength across user-defined depths.
How It Works (Technical Methodology)
1. Pivot Point Detection
The indicator uses Pine Script's ta.pivothigh() and ta.pivotlow() functions with a configurable sensitivity length to detect swing highs and lows. All recent pivot indices are stored in an array (limited to avoid performance issues), providing potential starting points for regression calculations.
2. Multi-Depth Evaluation
Users input comma-separated "Pivot History Depths" (e.g., "5,20,50"). For each depth:
- The script evaluates regression fits starting from the most recent pivots, up to the specified depth count.
- It calculates linear regression statistics for each possible channel originating from those pivot bars backward to the current bar.
3. Linear Regression Calculation
For each candidate channel:
- Slope (m) and intercept (b) are computed using least-squares method.
- R-squared (R²) measures goodness of fit (how well price follows the trend line).
- Standard error of the estimate is calculated to quantify volatility around the regression line.
- A composite score = R² × log(length) prioritizes stronger fits on longer periods.
4. Best-Fit Selection and Validation
- Only channels with R² ≥ user-defined minimum (default 0.5) are considered valid.
- The channel with the highest score for each depth is selected and drawn.
- This ensures the most statistically significant and relevant channels are displayed, avoiding weak or short-term noise.
5. Channel Construction
- Mean Line: The regression trend line extended slightly into the future.
- Inner Channels: ± user-configurable standard deviation multiplier (default 2.0σ) around the mean.
- Outer Bands: ±1.5× the inner deviation for additional visual context.
- Filled areas between mean and inner channels for better visibility.
- Color: Green shades for upward slopes (bullish trend), red shades for downward slopes (bearish trend).
6. Dashboard and Statistics
- Optional table in the top-right corner displays for each depth:
- Depth value
- R² (colored green if >0.7, orange otherwise)
- Slope (Beta) – positive blue for uptrend, red for downtrend
- Current Z-Score: How many standard deviations the latest close is from the expected regression value (yellow if |Z| > 2)
How to Use
Regression channels help identify trending markets, potential mean reversion, and overextension.
- Upward Channels (Green): Price above the mean may indicate strength; pullbacks to the mean or lower band offer long opportunities. Overextension above upper band could signal exhaustion.
- Downward Channels (Red): Price below the mean may indicate weakness; rallies to the mean or upper band offer short opportunities. Overextension below lower band could signal capitulation.
- High R² (>0.7): Strong trending channel – trade in direction of slope.
- Low R²: Choppy/range-bound market – avoid trend-following trades.
- Z-Score: |Z| > 2 suggests price is statistically overextended from the trend (potential reversion setup).
- Multi-Depth: Smaller depths catch short-term trends; larger depths capture major trends. Use multiple for confluence across timeframes.
Combine with volume, support/resistance, or other indicators for confirmation.
Disclaimer
This indicator is a technical analysis tool and should be used in conjunction with other forms of analysis. Past performance does not guarantee future results. Always use proper risk management.
Supply-Demand Dominance & Energy RibbonOverview:
This indicator is specifically fine-tuned for the Nasdaq (NAS100) market. It combines volume-based Delta analysis (Supply-Demand) with price kinetic energy (Slope) to identify high-probability reversal points and trend strength.
Key Features & Usage:
Supply-Demand Dominance (Top-Right Label):
Analyzes volume spikes over a 50-period lookback to determine market control.
Displays "매수 우위" (Bullish Dominance) or "매도 우위" (Bearish Dominance) in real-time.
Energy Ribbon (Bottom Visualization):
Calculates the slope of the TCI oscillator to visualize momentum intensity.
Solid Green/Red: Strong momentum.
Faded Green/Red: Weakening momentum or minor trend.
Momentum Combo Signals (Circle Shapes):
Triggered when WaveTrend and TCI oscillators cross in extreme zones (Overbought 70 / Oversold 30).
Smart Filter: Signals are only shown when they align with the current Supply-Demand dominance, reducing "market noise."
Volume Spikes (Arrow Symbols):
Indicates abnormal volume activity (1.5x average delta). These arrows (↑/↓) help identify potential breakout points or the climax of a move even when a full combo signal isn't present.

Golden Zone Structure [Kodexius]Golden Zone Structure is a ZigZag based market structure and Fibonacci tool designed to make swing context easier to read directly on the price chart. It detects meaningful pivot highs and lows, labels the evolving structure (HH, HL, LH, LL, including equal highs and lows), and automatically projects a Fibonacci map across the most recent completed swing.
Instead of forcing you to manually anchor Fib tools after every new leg, the script rebuilds levels each time a fresh pivot is confirmed. This makes it well suited for traders who focus on swing continuation, pullback depth, and reaction zones where liquidity and orderflow often concentrate.
A key emphasis is the Golden Zone highlight. The indicator shades the zone that is most relevant to the current swing context so you can quickly spot where a retracement is approaching a higher probability reaction area, without cluttering the chart with too many permanent objects.
The tool is intentionally visual and configurable. You can choose pivot source (High/Low or Close), adjust swing sensitivity via ZigZag period, switch color themes, and decide how much detail you want on screen (levels, zigzag lines, labels).
Optional trading markers can be enabled for users who want a lightweight “zone interaction” prompt. These markers are not intended as a standalone trading system. They are meant to complement your own confirmation rules (structure alignment, volume, higher timeframe bias, or price action triggers).
🔹Features
🔸 ZigZag Swing Engine
- Uses a configurable ZigZag period to filter noise and confirm swing points only when the lookback logic validates the move.
Supports different pivot sources (High/Low or Close) so you can choose between cleaner structure or more reactive behavior depending on the instrument.
Optional ZigZag leg drawing to visualize swing flow without clutter.
🔸 Market Structure Labels (HH, HL, LH, LL + Equals)
- Automatically labels each confirmed pivot based on how it compares to the prior pivot of the same type.
High side classification: H, HH, LH, EH.
Low side classification: L, HL, LL, EL.
Equal highs and lows help reveal potential liquidity pools and “magnet” areas where price often reacts or breaks with intent.
🔸 Auto Fibonacci Map on the Active Swing
- Rebuilds Fibonacci levels every time a new pivot is confirmed, keeping the projection aligned with the most recent completed leg.
Core retracement levels: 0.236, 0.382, 0.500, 0.618, 0.786.
Extension levels: 1.272 and 1.618 for expansion targeting and continuation mapping.
Optional price labels on each level, formatted to tick size so levels remain readable across markets.
🔸 Golden Zone Highlighting (Context Aware)
- Highlights the most relevant retracement band with a soft fill so you can spot “zone approach” moments at a glance.
The zone selection adapts to swing context, focusing on a different retracement region depending on whether the last confirmed pivot is a peak or a trough.
Adjustable transparency keeps the chart clean while preserving the key reaction area.
🔸 Visual Customization + Themes
- Multiple color themes (Neon, Ocean, Sunset, Monochrome) so the tool fits different chart styles and backgrounds.
Independent toggles for Fib levels, Golden Zone shading, ZigZag lines, and price labels.
Line width controls for better scaling across timeframes.
🔸 Optional Trading Markers + Alerts
- Optional BUY and SELL labels based on zone interaction logic with candle confirmation filters.
ATR based placement offset scaled by sensitivity so labels stay visually separated during volatility.
Built in alert conditions for new pivot highs and new pivot lows so you can monitor structure changes without watching every bar.
▶ Practical Usage Tip
• Use structure labels to define bias (HH + HL for bullish structure, LH + LL for bearish structure).
• Use the Golden Zone as a location filter, then wait for your own trigger (break of minor structure, rejection candle, volume shift, etc.).
• Treat extensions as “map points” not guaranteed targets. They work best when structure supports continuation.

Previous Day Week High Low EQ Extensions FIB BoxPDH / PDL EQ 25–75 Indicator
PDH / PDL EQ 25–75 is a comprehensive market-structure and range-analysis indicator designed to visualize key daily and weekly reference levels directly on the chart. The script automatically plots prior highs and lows, equilibrium levels, range-based extensions, Fibonacci zones, and session opens, providing traders with a structured framework for directional bias, mean reversion, and liquidity-based analysis.
Core Features
Daily Range Framework
Previous Day High (PDH) and Previous Day Low (PDL)
Daily Equilibrium (50%) of the prior day’s range
25% and 75% Quartile Levels for range segmentation
Range Extensions at ±25% and ±50% beyond PDH/PDL
Daily Open (DO) plotted and extended forward
Fibonacci Discount/Premium Zone (61.8%–78.6%) highlighted with a shaded box
These levels are recalculated at the start of each trading day and extended forward for clear intraday reference.
Weekly Range Framework
Previous Week High (PWH) and Previous Week Low (PWL)
Weekly Equilibrium (50%)
Weekly Fibonacci Discount/Premium Zone (61.8%–78.6%)
Weekly Open (WO) plotted and extended
Weekly levels reset automatically at the start of each new trading week and are maintained independently from daily levels.
Visual & Customization Options
Fully configurable colors, line widths, and line styles for every plotted level
Adjustable forward extensions for range and open levels
Optional labels with customizable size and optional price display
Distinct separator lines marking daily and weekly ranges
Independent toggles for:
Extension levels
Fibonacci zones
Labels
The indicator is optimized for clarity while maintaining flexibility for different trading styles and chart layouts.
Technical Implementation Highlights
Uses higher-timeframe data via request.security() to ensure accurate daily and weekly calculations
Automatically anchors PDH, PDL, PWH, and PWL to their true originating bars
Efficient object management using arrays to prevent clutter and maintain platform performance
Designed for overlay use on any intraday or higher-timeframe chart
Use Cases
Identifying premium and discount zones
Mapping mean-reversion and continuation areas
Tracking institutional reference levels
Intraday trading with higher-timeframe context
Futures, forex, crypto, and equity markets

Pivot automaticOverview
Pivot Automatic is a powerful, overlay-based TradingView indicator that automatically detects Higher Timeframe (HTF) Pivot High (Resistance) and Pivot Low (Support) zones, monitors price interactions with these zones (touches and breakouts), and optionally identifies high-volume trading regions. It features auto-HTF detection, customizable alerts, and visual markers to streamline technical analysis and trade decision-making.
Key Features
Auto Higher Timeframe (HTF) Detection: Automatically selects an appropriate higher timeframe based on your current chart timeframe, eliminating the need for manual HTF input.
Visual Pivot Zones: Clearly displays pivot high (resistance) and pivot low (support) zones as colored, dynamically extending rectangles directly on price action.
Price Touch & Breakout Monitoring: Detects first touches, re-touches, and breakouts of pivot zones, with corresponding visual markers and real-time alerts.
High-Volume Box Detection: Optional visualization of extreme volume bars within user-specified trading sessions, highlighting potential institutional interest areas.
Fully Customizable: Adjust colors, transparency levels, alert triggers, and volume parameters to align with your personal trading style and chart aesthetics.
Parameter Explanation
The indicator’s parameters are organized into three main categories for intuitive configuration.
1. HTF Settings (Higher Timeframe Pivot Zone Configuration)
Pivot High Zone Color: Defaults to gray. This parameter sets the background color of HTF pivot high (resistance) zones, allowing you to match the zone color to your chart theme.
Pivot High Transparency: Defaults to 80, with a range of 0 to 100. It controls the transparency of pivot high zones—0 means fully opaque, while 100 means fully transparent. Higher values help keep the chart uncluttered while maintaining visibility of key resistance levels.
Pivot Low Zone Color: Defaults to fuchsia. This parameter sets the background color of HTF pivot low (support) zones for clear differentiation from resistance zones.
Pivot Low Transparency: Defaults to 80, with a range of 0 to 100. It controls the transparency of pivot low zones, using the same 0-100 scale as pivot high transparency.
2. Touch Alert Settings (Price Interaction Monitoring)
Enable Touch Alert: Defaults to true. This toggle enables or disables all alerts related to price touches and breakouts of pivot zones. Disable it if you only want visual cues without receiving notifications.
Show Touch Markers: Defaults to true. When enabled, it displays small labels on the chart during price interactions with pivot zones—"R" for resistance touches, "R+" for resistance top tests, "S" for support touches, and "S+" for support bottom tests.
Alert on Bottom Touch: Defaults to true. Triggers an alert when price first touches the bottom boundary of a pivot zone, signaling entry into a support or resistance area.
Alert on Top Touch: Defaults to true. Triggers an alert when price reaches the top boundary of a resistance zone or the bottom boundary of a support zone, indicating a test of the zone’s key level.
Minimum Touch Interval (bars): Defaults to 5, with a minimum value of 1. This parameter sets a minimum number of bars between consecutive touch alerts for the same pivot zone, preventing duplicate and redundant alerts.
ATR Length for Label Offset: Defaults to 14. It defines the lookback length of the Average True Range (ATR) indicator used to calculate the distance of touch markers from price action, using the standard ATR length of 14 by default.
Label Offset Multiplier: Defaults to 0.3, with a minimum value of 0.1 and adjustable in 0.1 increments. It multiplies the ATR value to set the offset distance of touch markers from price, preventing overlap between markers and candlesticks.
3. Volume Settings (High-Volume Zone Configuration)
Show Huge Volume Box: Defaults to false. This toggle enables or disables the visualization of bars with extremely high volume, which is disabled by default to reduce chart clutter.
Volume Length: Defaults to 20. It sets the lookback period (number of bars) used to calculate the highest volume and average volume, which are the benchmarks for identifying "huge volume" bars.
Volume Factor: Defaults to 5. It acts as a multiplier for the average volume—only bars with volume greater than the average volume multiplied by this factor are classified as "huge volume" bars. Higher values make the detection more restrictive, capturing only the most extreme volume spikes.
Volume Box Color: Defaults to blue. This parameter sets the background color of the huge volume box for clear visual identification.
Volume Box Transparency: Defaults to 70, with a range of 0 to 100. It controls the transparency of the huge volume box, following the same 0 (fully opaque) to 100 (fully transparent) scale as other zone transparency settings.
Enable Session Filter: Defaults to true. When enabled, it restricts huge volume detection to a user-specified trading session; disabling it allows detection across all time periods.
Trading Session: Defaults to 0930-1600, formatted as HHMM-HHMM. It defines the specific trading session for volume detection—for example, 0930-1600 corresponds to US stock regular trading hours.
Session Timezone: Defaults to UTC-5, with options covering all UTC offsets from UTC-12 to UTC+12. It sets the timezone for the specified trading session, with key mappings including UTC-5 for US Eastern time, UTC+0 for London time, UTC+1 for Paris time, UTC+8 for China/Singapore time, and UTC+9 for Tokyo time.
Hidden Core Logic (Non-Customizable Constants)
Auto HTF Detection Logic
The indicator automatically selects the appropriate higher timeframe based on your current chart timeframe (measured in minutes), following this predefined rule set:
For current timeframes less than 3 minutes (including second-based charts), the auto-selected HTF is 3-minute.
For current timeframes between 3 minutes and 9 minutes, the auto-selected HTF is 15-minute.
For current timeframes between 10 minutes and 29 minutes, the auto-selected HTF is 1-hour (60-minute).
For current timeframes between 30 minutes and 3 hours 59 minutes, the auto-selected HTF is 4-hour (240-minute).
For current timeframes between 4 hours and 23 hours 59 minutes, the auto-selected HTF is Daily (D).
For current timeframes of 1 day or longer, the auto-selected HTF is Weekly (W).
How to Use the Indicator
1. Basic Setup
Add the indicator to your TradingView chart—it will overlay directly on your price action.
Verify the auto-selected HTF, which requires no manual input. If you want to change the underlying HTF logic, simply adjust your current chart timeframe.
Customize the indicator parameters via the "Settings" panel to match your visual preferences and trading needs.
2. Interpreting Visual Cues
Gray Transparent Rectangle: Represents an HTF Pivot High (Resistance Zone). The zone is bounded by the pivot high’s peak at the top and the higher of the pivot bar’s open or close at the bottom.
Fuchsia Transparent Rectangle: Represents an HTF Pivot Low (Support Zone). The zone is bounded by the pivot low’s trough at the bottom and the lower of the pivot bar’s open or close at the top.
Small "R" Label (Red/Orange): Signals a Resistance Zone Touch. A red label indicates the first touch of the zone, while an orange label indicates a re-touch after the minimum touch interval has elapsed.
Small "R+" Label (Solid Red): Signals a Resistance Zone Top Test, meaning price has reached the upper boundary of the pivot high zone and is attempting a breakout.
Small "S" Label (Green/Lime): Signals a Support Zone Touch. A green label indicates the first touch of the zone, while a lime label indicates a re-touch after the minimum touch interval has elapsed.
Small "S+" Label (Solid Green): Signals a Support Zone Bottom Test, meaning price has reached the lower boundary of the pivot low zone and is attempting a breakdown.
Blue Transparent Box (Optional): Represents a Huge Volume Zone, marking a bar with extreme volume that meets the volume factor and session filter criteria.
Extending Rectangle: Identifies an Unbroken Pivot Zone. The rectangle will continue extending to the right as long as price has not broken the zone’s boundary; broken zones stop extending.
3. Alert Triggers
When the Enable Touch Alert parameter is set to true, the indicator generates five distinct types of alerts:
Resistance Touched: Triggers when price first enters the pivot high zone, if the Alert on Bottom Touch parameter is enabled.
Resistance Top Test: Triggers when price reaches the upper boundary of the pivot high zone, if the Alert on Top Touch parameter is enabled.
Resistance Re-touch: Triggers when price re-enters the pivot high zone after the minimum touch interval has passed, if the Alert on Bottom Touch parameter is enabled.
Support Touched/Re-touch: Mirrors the resistance touch alerts, triggering when price enters or re-enters the pivot low zone.
Support/Resistance Broken: Triggers once per breakout when price closes above a pivot high zone or below a pivot low zone on the auto-selected HTF.
4. Trading Strategies with the Indicator
Strategy 1: Pivot Zone Bounce (Range Trading)
Long Setup: Look for price to touch a fuchsia pivot low zone (accompanied by an "S" label), then watch for a bullish reversal candlestick pattern—such as a hammer or bullish engulfing. Confirm the setup with increasing buying volume, then enter a long position.
Short Setup: Look for price to touch a gray pivot high zone (accompanied by an "R" label), then watch for a bearish reversal candlestick pattern—such as a shooting star or bearish engulfing. Confirm the setup with increasing selling volume, then enter a short position.
Stop Loss Placement: For long positions, place the stop loss just below the bottom boundary of the pivot low zone. For short positions, place the stop loss just above the top boundary of the pivot high zone.
Take Profit Target: Target the next nearby pivot zone, or use a risk-reward ratio of at least 1:2 for consistent results.
Strategy 2: Pivot Zone Breakout (Trend Trading)
Long Breakout Setup: Wait for a "Resistance BROKEN" alert, which confirms price has closed above the gray pivot high zone. Enter a long position only if the breakout is accompanied by above-average volume, which validates the strength of the breakout.
Short Breakdown Setup: Wait for a "Support BROKEN" alert, which confirms price has closed below the fuchsia pivot low zone. Enter a short position only if the breakdown is accompanied by above-average volume, which validates the strength of the breakdown.
Stop Loss Placement: For long breakouts, place the stop loss just below the breakout candlestick. For short breakdowns, place the stop loss just above the breakdown candlestick.
Take Profit Target: Target the next major pivot zone in the direction of the trend, or trail your stop loss to capture extended trend moves.
Strategy 3: High-Volume + Pivot Zone Confluence (High-Probability Trading)
Enable the Show Huge Volume Box parameter to display high-volume zones on your chart.
Look for pivot zones that align with these high-volume boxes—this confluence of support/resistance levels and institutional volume activity creates high-probability trade setups.
Prioritize trades where price interacts with these confluent zones, as reactions from these areas are typically stronger and more reliable than reactions from standalone pivot zones.
5. Best Practices
Timeframe Compatibility: The indicator works seamlessly on all timeframes, from second-based charts to weekly charts, thanks to its auto-HTF detection logic.
Asset Compatibility: It is suitable for trading stocks, forex pairs, cryptocurrencies, commodities, and futures contracts across global markets.
Chart Clutter Management: Keep the Show Huge Volume Box parameter disabled by default unless you specifically trade volume-based strategies, to avoid overcrowding your chart with unnecessary elements.
Alert Notification Setup: Configure TradingView’s alert notifications—including email, SMS, and app alerts—to stay updated on price interactions with pivot zones, even when you are not actively monitoring the chart.
Parameter Fine-Tuning: Backtest the indicator with your preferred asset and timeframe to adjust parameters like Volume Factor and Minimum Touch Interval, optimizing the indicator for the specific market conditions you trade.
Disclaimer: This indicator is for educational and analytical purposes only. It does not constitute financial advice. Always conduct your own research and risk assessment before executing any trades in the financial markets.
