Investing - Correlation Table This correlation tables idea is nothing new, many sites provides it.
However, I couldn't find any simple correlation indicator on TradingView despite how simple this indicator is.
This indicator works as its called. Calculating the correlation between 2 projects (can be used in stocks as well) using the 'ta.correlation' feature built into pinescript.
When it comes to investing, we do not want our stocks / crypto project to be heavily correlated to each other.
If they are heavily correlated to each other, then there isn't much point in diversifying.
That being said, it can be useful for traders who trade multiple pairs.
-----------------------------------------------------------------------------------------------------------------------------------------------------------
In this indicator, consist of 5 primary input and 15 secondary input (Symbol List).
Correlation Source:
This input options allow you to change how the correlation is calculated. By default, it uses 'close'.
Correlation Percentage(%):
This input options allows you configure how many (%) of correlation is considered as 'decoupled'.
This correlation will only move between -100% ~ 100%.
100% refers to it moving together.
-100% refers to it moving the opposite direction.
For example, Project A rises in Price, what is the possibility of Project B following:
A 100% correlation between Project A and Project B, refers to Project B will follow Project A movement.
A 50% correlation between Project A and Project B, refers to there is only 50% chance for Project B to follow Project A movement.
A -20% correlation between Project A and Project B, refers to there is a 20% chance of Project B moving the opposite direction of Project A
(Refers to the table on chart above to better understand what the numbers means. DOT/USD has a 100% correlation to DOT/USD. However. MXCUSDT has a -37.2% correlation to DOT/USD.)
Amounts Bars To Check:
This input options will check the amount of bars since the last bar in the chart.
If you want to know the correlation of the past 100 days in a daily chart, you will enter '100' into this options and it will check only the past 100 days.
Symbol List
This will allow you to input all the project symbol ticker ID to add into the correlation table.
-----------------------------------------------------------------------------------------------------------------------------------------------------------
Originally, I wish to use for loop to go through the symbol list to reduce the amount of code required. However, due to limitation of 'request.security' feature, I had to abandon that idea and use hard-coded for requesting security and use a while loop to identify the symbol correlation value in the array set then set the table value accordingly.
If there is any script writer could improve this or any unclear explanation, feel free to drop a comment below.
Portfolio

Diversified Investment EMA Cross Strategy SimulatorThis simulating indicator proves that even if you use a simple strategy, you can reduce your risk by diversifying your investments.
The strategy itself is simple.(only long)
Buy when 50 days EMA crosses over 200 days EMA.
Sell when 50 days EMA crosses under 200 days EMA.
Or, stop loss when the asset falls by 2% (eg).
Using this simple strategy on an asset is just a test of your luck.
However, this capital change graph shows that risk can be reduced by diversifying investment into eight assets rather than one asset.
Options
Total Assets Capital Change represents the sum of capital changes for 8 assets. The gray line is the initial capital.
Each Asset Capital Change represents all eight asset capital changes. In this case, the gray line is displayed as the initial capital divided by 8.
The rest of the options show a graph of capital change for each asset, showing when buys and sells occurred.
And set the start date, initial capital, stop loss %, and commission.
And select the 8 assets you want to invest in and you are ready to go. To effectively reduce risk, uncoupled assets would be better if possible.
The table in the lower right shows the selected asset and color.
Please enjoy the simulation.

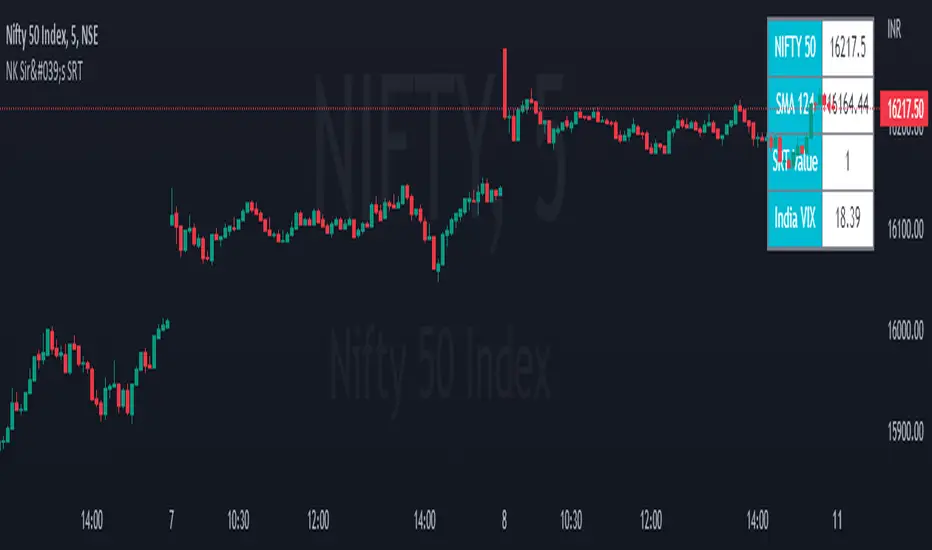
NK Sir's SRTFirst of all I would like to thanks Nitish Sir for teaching us the concept of SRT, which proves to be an excellent tool for Investing.
In a year, there are around 248 to 252 trading days .
On dividing the same by 2 we get 124. Even 125 / 126 can be taken.
We get SRT value by dividing Nifty Spot with 124 SMA value & SRT is applicable on Nifty in a Day Chart.
This value ranges in between 0.6 (Low) to 1.38/1.4/1.45/1.5 (High).
Ideal Entry in a stock will be at 0.6, which is very rare. You tend to buy at 0.7/0.8/0.9/1.10.
Exit from a stock will be at 1.3 - 1.5.
However generally we get a value of 0.8/0.9 and we should start investing 20 % of our capital that we have planned to invest. For every 0.1 decrease in SRT Value, we should add 20% to the stock portfolio.
Start Booking Profit if SRT value above 1.35 & book 50 % of the portfolio when SRT value is 1.45.
For Traders, as an when SRT value comes to 0.8/ 0.9. Buy when Hilega Milega gives us a clear BUY signal on Monthly Time Frame.
Stock bought at SRT value of 0.6 tend to double in a year. It generally quite rare to see a SRT Value of 0.6.
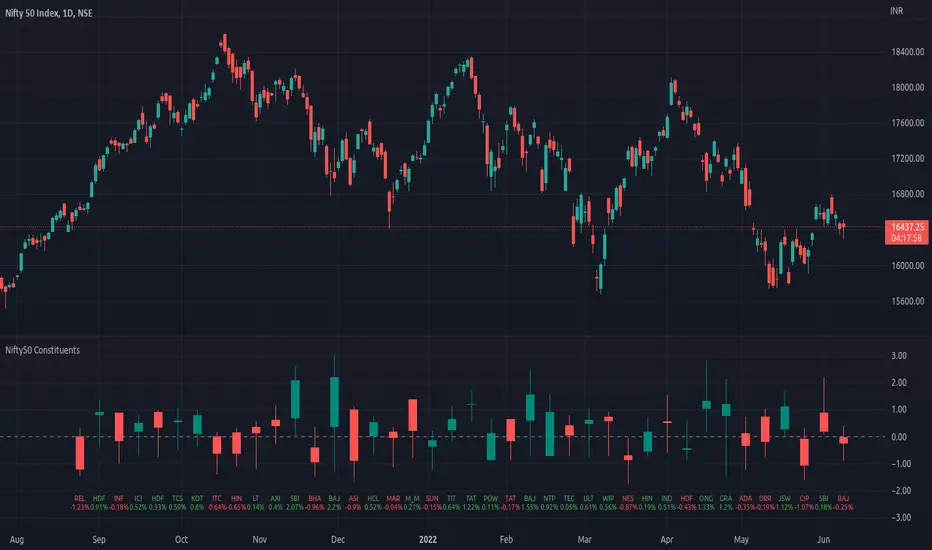
Top 40 constituents of Nifty50Displays real-time candles of top 40 constituents of Nifty50 for a given time frame, side-by-side. This gives an overall idea of breadth and depth of market movements in the time-frame.
Please note that, this is not a standard chart rendered bar-wise and may take time to load as it requests multiple securities. You could modify the contents, from settings, to include stocks from your portfolio or indices of different sectors.
NSE:NIFTY
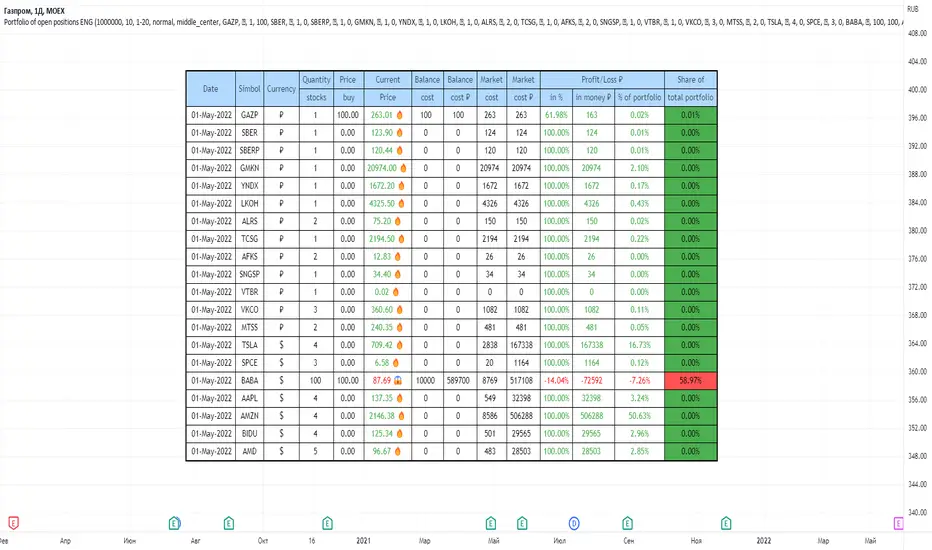
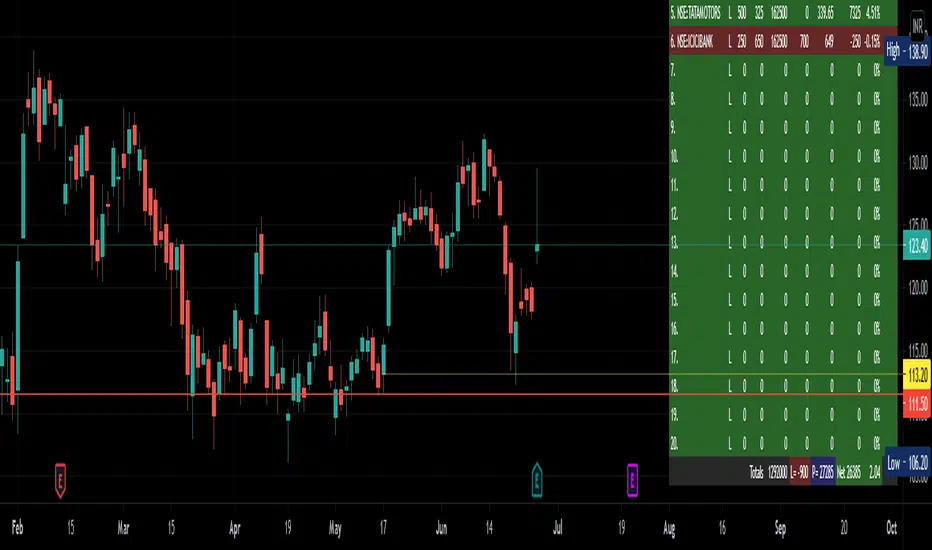
Portfolio of open positions ENGHello, I became interested in investing and trading, and there was a huge problem where and how to manage my portfolio,
I tried websites, got a spreadsheet in microsoft excel, and eventually it became possible to manage a portfolio in TradingView.
You enter data about purchases and follow the dynamics of your shares anytime, anywhere.
Added automatic transfer to one currency if the shares are traded in different currencies
The last column is how many percentages each share occupies of the total portfolio
Thanks to the TradingView team for the unique opportunity!
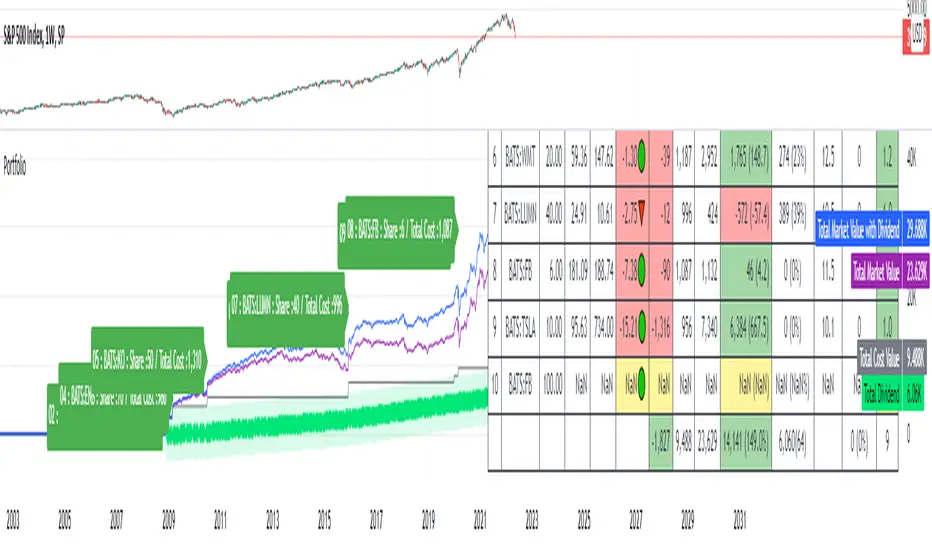
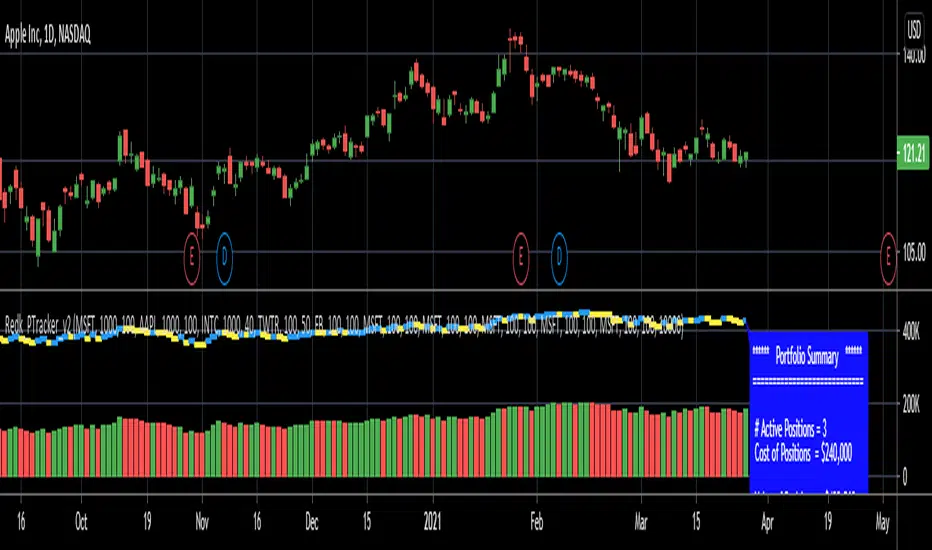
Portfolio SummaryThe stocks in my portfolio has very poor performance since the FED hiked the rate.
since the covid-19, i came to the stock market and buy a stock that i ever heard the name which i don't even know its fundamental.
Some stock, i bought them at the hilltop (and sell at the bottom, hehe).
Everyone is a genius in a bull market ; and now i realized i am gonna loss money.
I have to do something, so i looked for an indicator that allow me to manage my portfolio.
unfortunately, i cannot find one that fit me.
so i make this indicator.
How you can get the benefit from this indicator
This indicator will summarize the gain/loss since you bought the stock.
it also include the dividend.
So that you can see how much you gain and loss, and make a decision as you wish.
How to use it
1. Input some neccessary data like ticker/stock (up to 20 tickers, yeah i know, it is too much), share, average price which you can input manually or depend on your entry date.
2. The indicator will calculate gain/loss, dividend, % of your portfolio.
3. You can select how to display based on "Index" or "Market Value".
4. You can toggle on/off both label and table.
Disclaimer
This indicator may display inaccurate and need a lot of improvement.
pls use carefully.
if you have any suggestion, pls dont hersitate to comment below.
Enjoy.
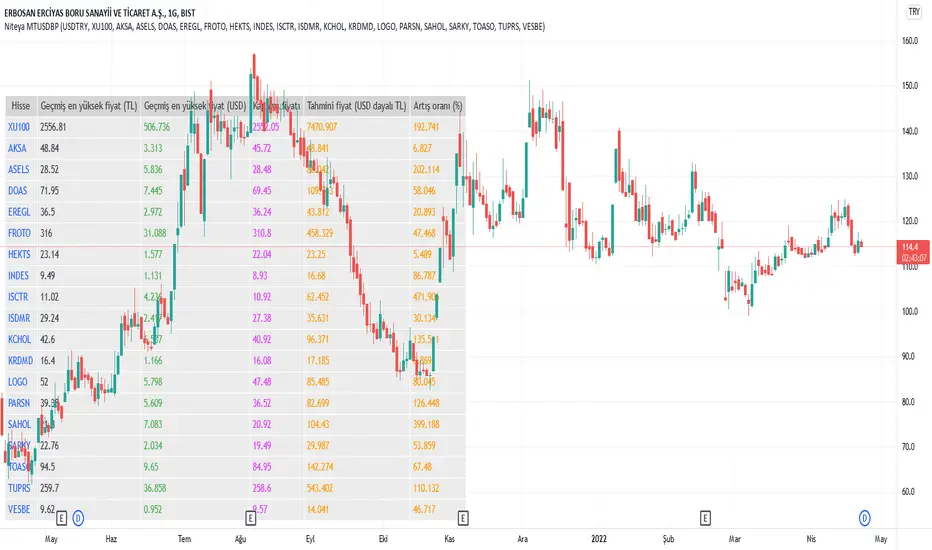
Niteya Multi Ticker Dollar-Based Pricing Ver 1.3The main purpose of the indicator is to make a future price estimation based on the highest dollar-based price of the stock in the past, especially for stocks that exceed their past prices in chart currency terms. There should be no expectation that this prediction will necessarily come true.
A table with six columns and 19 rows (excluding the header) is created on the graph, positioned bottom and left.
The first column contains the ticker code, the second column contains the highest historical price of the stock in currency, the third column contains the past high price of the stock in USD, the fourth column contains the closing price, the fifth column contains the value obtained by multiplying the past highest USD price of the stock by the daily dollar price, and the sixth column is includes the rate of increase.
Using the indicator interface, you can select the ticker value in the first row of the table from among 22 different values via a selection box, and for the 18 rows below, you can directly type the ticker name.
* The currency of the chart must be compatible with the dollar conversion currency. For example, if the conversion currency is "USDTRY", the currency of the chart should be "TRY".
All stocks in the indicator are randomly selected. Investment information, stock selections, comments and recommendations herein are not within the scope of investment consultancy. Investment consultancy service is provided within the framework of investment consultancy agreement to be signed between brokerage houses, portfolio management companies, non-deposit banks and the customer.
Türkçe açıklama
Göstergenin temel amacı, özellikle grafik para birimi (TRY) bazında geçmiş fiyatlarının üzerine çıkmış hisselerde, hissenin geçmişteki en yüksek dolar bazlı fiyatını esas alarak, geleceğe yönelik bir fiyat tahmininde bulunmaktır. Bu tahminin mutlaka gerçekleşeceği beklentisi olmamalıdır.
Grafik üzerinde, üste ve ortalanmış olarak, altı sütun ve başlık kısmı hariç 19 satırlık bir tablo oluşturulmaktadır.
İlk sütun hisse kodunu, ikinci sütun hissenin geçmiş en yüksek fiyatını TRY olarak, üçüncü sütun hissenin geçmiş en yüksek fiyatını USD olarak, dördüncü sütun kapanış fiyatını, beşinci sütun hissenin geçmiş en yüksek USD fiyatının günlük dolar kuru ile çarpılarak elde edilen değeri, altıncı sütun ise artış oranını içerir.
Gösterge arayüzünü kullanarak, tablonun ilk satırındaki ticker (hisse) değerini 22 farklı değer arasından (BIST 100 ve 21 şirket) bir seçim kutusu yoluyla, altta yer alan 18 satır için ise, doğrudan hisse adını yazabilirsiniz.
* Grafiğin para birimi dolar çevrim kuru ile uyumlu olmalıdır. Örneğin, çevrim kuru "USDTRY" ise, grafiğin para birimi "TRY" olmalıdır.
Gösterge içinde yer alan tüm hisseler rastgele seçilmiştir. Buradaki yatırım bilgileri, hisse seçimleri, yorum ve tavsiyeleri yatırım danışmanlığı kapsamında değildir. Yatırım danışmanlığı hizmeti, aracı kurumlar, portföy yönetim şirketleri, mevduat kabul etmeyen bankalar ile müşteri arasında imzalanacak yatırım danışmanlığı sözleşmesi çerçevesinde sunulmaktadır.
Portfolio Laboratory [Kioseff Trading]Hello!
This script looks to experiment with historical portfolio performance. However, a hypothetical cash balance is not used; weighted percentage increases and decreases are used.
You can select up to 10 assets to include in the portfolio. Long and short positions are possible.
Show in the image are the portfolio's weight, the total return of the portfolio and the total return of the asset on the chart over the selected timeframe.
Shown in the image above are the constituents of the portfolio, which can include any asset, the weighted percentage gain/loss of the constituents in addition to 10 major indices and their respective total percentage gain/loss over the timeframe.
Shown in the image above are the dividend yield % of the portfolio and relevant portfolio metrics - ex-post calculations are applied and are predicated on simple returns.
Shown in the image above is a portfolio of all short positions; portfolio calculations adjusted to the modifications.
Also shown is a change in the index the portfolio is calculated against. I have been asked a few times to include NIFTY 50 in my scripts - I made sure this was achieved, lol!
Show in the image is a performance line of performance of percentage increases/decreases for the index calculated against, the asset on the chart, and the portfolio.
All lines start simultaneously on the selected start date at the close price of the session for the asset on your chart.
However, the right-hand scale, whether displaying price or percent, cannot be used to assess the performance of each line - they are useful for visualization only and can extend below zero on a low-priced asset. Calculations will not execute correctly when selecting a start date prior to any asset in the portfolio's first trading session; calculations do not begin on the first bar of the asset on your chart.
I decided to code the script this way so statistics remain fixed when moving from asset to asset!
To compensate for this limitation, I included a label plot and background color change at the first session in which all assets in the portfolio had at least one bar of price data. You can adjust the calculation start date to the date portrayed on the label to test al possible price data!
The statistics table, and the performance lines, can be hidden in the user input section.
I plan on putting a bit more work into this script. I have some ideas on what to include; however, any input is greatly appreciated! If there's something you would like me to include please let me know.
@scheplick mentioned me in a script he recently coded:
My inspiration came from his script! I thank him for that!

Period Dollar Cost Average BacktesterHere is a simple script to calculate the profits and other dollar cost average strategy statistics. This strategy was created to avoid asset price volatility, so the pump and dump scheme does not affect the portfolio. By dividing the investment amount into periods, the investor doesn’t need to analyze the market, fundamental analysis, or anything. The goal is to increase the asset holdings and avoid fast and robust price movements.
This indicator has some configurations.
Amount to buy: the amount to buy at each time
Broker fee %: the fee percentage that the broker has for spot trade
Frequency: the frequency of the investments. Example: 1 Day means that every day, it will buy an amount of the asset
Starting Date: when the indicator will start the investment simulation
Ending Date: when the indicator will end the investment simulation
InfoCell With/Height: it relates to the panel for view purposes. Change the values to fit better on your screen.
This indicator has three lines:
Total Invested (green): total amount invested at the end of the period
Total Net Profit (pink): total profit by converting the amount of the asset bought at the latest closing price
Holding Profits (yellow): the amount that would be in the portfolio if the investor had invested all the capital in a signal trade at the beginning of the period.
The statistics panel has some information to help you understand buying the asset in one or more trades. So, besides those three lines that were mentioned above, here are the other statistics:
Entry Price: The price of the asset when the first investment was made
Gross Profit: Total amount of profit, not excluding the losses
Gross Losses: Total amount of losses, not excluding the profits
Profit Factor: The Gross Profit divided by the Gross Loss. A value above 1 means it’s profitable.
Profit/Trades: Net profit per trade. This includes the broker fees.
Recovery Factor: The Net profit divided by the relative drawdown. The higher the recovery factor, the faster the recovery of a loss
Total Asset Bought: The amount of the asset that was bought at the end of the investment plan
Absolute Drawdown: The total amount of losses that made the account balance go below its initial value
Relative Drawdown: The max drawdown that occurred, no matter the account balance amount
Total Trades: number of times the investment was made in the selected period
Total Fee: total Fee that was spent on the total investment
Total Winning Trades: the total amount of winning trades. A trade is considered a winner if the net profit is up compared with the latest investment.
Total Losing Trades: the total amount of losing trades. A trade is considered a loser if the net profit is down compared to the latest investment.
Max consecutive wins: the max amount of consecutive winning trades
Max consecutive losses: the max amount of consecutive losing trades
The chart above uses the default configuration of the indicator. Placed on the BTCUSD market, taking the time range of January 1st, 2018 to January 1st, 2022, 4 years. Buying a BTC amount with 10 USDT every day in that period would generate a more than 500% profit. Compared to the profit amount by just holding the count, which was close to 350% profit, the dollar cost average by period would be much more profitable.

Portfolio Performance - Effects of RebalancingFunction:
- Can be used to evaluate the performance of a portfolio containing 2 assets over a set time interval
- Shows the % return of the portfolio over the time interval defined by the user
- Includes a threshold rebalancing algorithm to show the effects that rebalancing has on the portfolio over the long term
- Created to evaluate of the performance of portfolios containing different weightings of stocks and bonds over time assuming that the user would rebalance the portfolio when asset weights crossed a threshold
Instructions:
- To be used with dividends adjustments turned on
- Add this script to a symbol. e.g. AMEX:SPY
- Click the chart to define the entry time and the exit time. i.e. the time interval
- Define the initial investment of the portfolio. Default setting is $100,000
- Define the second asset to be included in the portfolio. e.g. BATS:AGG
- The strategy comes pre-populated with a portfolio that has a weight of 80% asset 1 and 20% asset 2. i.e. 80% AMEX:SPY and 20% BATS:AGG if the symbols mentioned above were chosen
- The 7 lines show the weighted % return of each portfolio over the time period defined by the user
- Each line (except the blue) is the return based on a different rebalancing threshold. The default settings are 1%, 2.5%, 5%, 10%, 15%, 20%, 30%
- The blue line is the % return of a portfolio that was made up of 100% asset 1 over the time interval. i.e. 100% AMEX:SPY
- Asset weights and rebalancing thresholds are adjustable via the settings
- Each plot can be turned on and turned off via a tick box in the settings

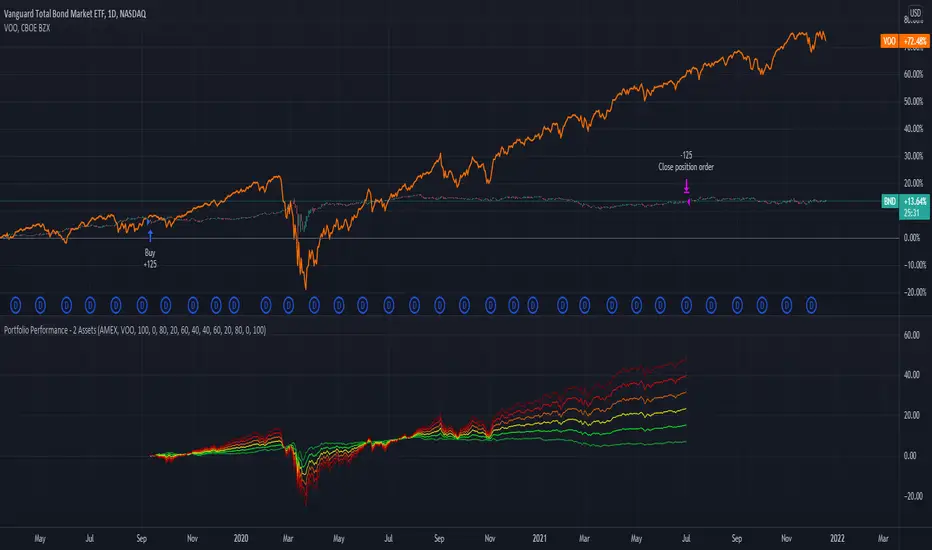
Portfolio Performance - 2 AssetsFunction:
- Can be used to evaluate the performance of portfolios containing 2 assets over a set time interval
- Created to evaluate of the performance of portfolios containing different weightings of stocks and bonds over time
- Shows the % return of each portfolio over the time interval defined by the user
- Capable of showing the risk adjusted % return of each portfolio over the time interval defined by the user (setting turned off by default)
Instructions:
- To be used with dividends adjustments turned on
- Add this script to a symbol. e.g. NASDAQ:BND
- Click the chart to define the entry time and the exit time. i.e. the time interval
- Define the second asset to be included in the portfolio. e.g. AMEX:VOO
- The strategy comes pre-populated with 6 portfolios with the most common stock/bond weightings (100% stocks/0% bonds, 80% stocks/20% bonds, 60% stocks/40% bonds, et cetera)
- The 6 lines show the weighted % return of each portfolio over the time period defined by the user
- All asset weights are adjustable via the settings
- Each plot can be turned on and turned off via a tick box in the settings
- There are 6 plots that show the risk adjusted returns of each portfolio (setting turned off by default)
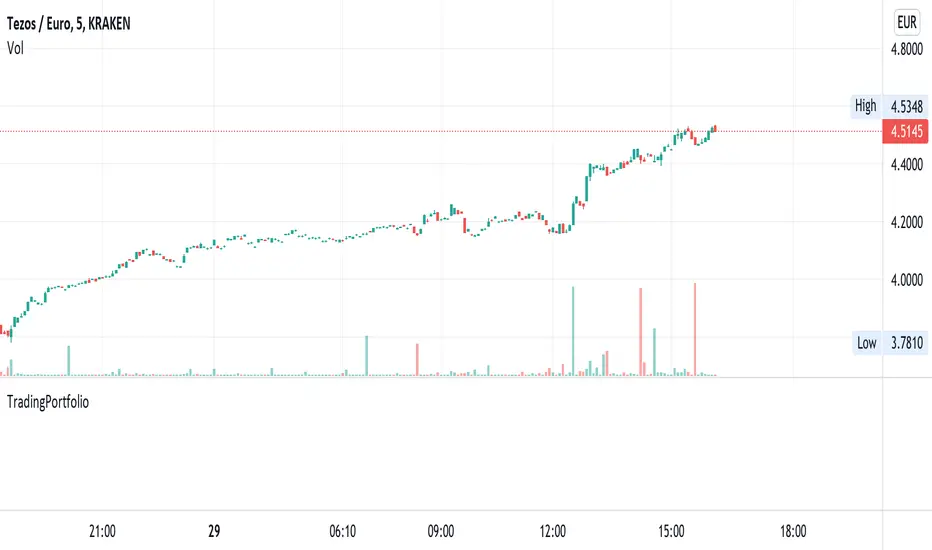
TradingPortfolioLibrary "TradingPortfolio"
Simple functions for portfolio management. A portfolio is essentially
a float array with 3 positions that gets passed around
into these functions that ensure it gets properly updated as trading ensues.
An example usage:
import hugodanielcom/TradingPortfolio/XXXX as portfolio
var float my_portfolio = portfolio.init(0.0, strategy.initial_capital) // Initialize the portfolio with the strategy capital
if close < 10.0
portfolio.buy(my_portfolio, 10.0, close) // Buy when the close is below 10.0
plot(portfolio.total(my_portfolio), title = "Total portfolio value")
get_balance(portfolio) Gets the number of tokens and fiat available in the supplied portfolio.
Parameters:
portfolio : A portfolio float array as created by the `init()` function.
Returns: The tokens and fiat in a tuple
set_balance(portfolio, new_crypto, new_fiat) Sets the portfolio number of tokens and fiat amounts. This function overrides the current values in the portfolio and sets the provided ones as the new portfolio.
Parameters:
portfolio : A portfolio float array as created by the `init()` function.
new_crypto : The new amount of tokens in the portfolio.
new_fiat : The new amount of fiat in the portfolio
Returns: The tokens and fiat in a tuple
init(crypto, fiat) This function returns a clean portfolio. Start by calling this function and pass its return value as an argument to the other functions in this library.
Parameters:
crypto : The initial amount of tokens in the portfolio (defaults to 0.0).
fiat : The initial amount of fiat in the portfolio (defaults to 0.0).
Returns: The portfolio (a float )
crypto(portfolio) Gets the number of tokens in the portfolio
Parameters:
portfolio : A portfolio float array as created by the `init()` function.
Returns: The amount of tokens in the portfolio
fiat(portfolio) Gets the fiat in the portfolio
Parameters:
portfolio : A portfolio float array as created by the `init()` function.
Returns: The amount of fiat in the portfolio
retained(portfolio) Gets the amount of reatined fiat in the portfolio. Retained fiat is not considered as part of the balance when buying/selling, but it is considered as part of the total of the portfolio.
Parameters:
portfolio : A portfolio float array as created by the `init()` function.
Returns: The amount of retained fiat in the portfolio
retain(portfolio, fiat_to_retain) Sets the amount of fiat to retain. It removes the amount from the current fiat in the portfolio and marks it as retained.
Parameters:
portfolio : A portfolio float array as created by the `init()` function.
fiat_to_retain : The amount of fiat to remove and mark as retained.
Returns: void
total(portfolio, token_value) Calculates the total fiat value of the portfolio. It multiplies the amount of tokens by the supplied value and adds to the result the current fiat and retained amount.
Parameters:
portfolio : A portfolio float array as created by the `init()` function.
token_value : The fiat value of a unit (1) of token
Returns: A float that corresponds to the total fiat value of the portfolio (retained amount included)
ratio(portfolio, token_value) Calculates the ratio of tokens / fiat. The retained amount of fiat is not considered, only the active fiat being considered for trading.
Parameters:
portfolio : A portfolio float array as created by the `init()` function.
token_value : The fiat value of a unit (1) of token
Returns: A float between 1.0 and 0.0 that corresponds to the portfolio ratio of token / fiat (i.e. 0.6 corresponds to a portfolio whose value is made by 60% tokens and 40% fiat)
can_buy(portfolio, amount, token_value) Asserts that there is enough balance to buy the requested amount of tokens.
Parameters:
portfolio : A portfolio float array as created by the `init()` function.
amount : The amount of tokens to assert that can be bought
token_value : The fiat value of a unit (1) of token
Returns: A boolean value, true if there is capacity to buy the amount of tokens provided.
can_sell(portfolio, amount) Asserts that there is enough token balance to sell the requested amount of tokens.
Parameters:
portfolio : A portfolio float array as created by the `init()` function.
amount : The amount of tokens to assert that can be sold
Returns: A boolean value, true if there is capacity to sold the amount of tokens provided.
buy(portfolio, amount, token_value) Adjusts the portfolio state to perform the equivalent of a buy operation (as in, buy the requested amount of tokens at the provided value and set the portfolio accordingly).
Parameters:
portfolio : A portfolio float array as created by the `init()` function.
amount : The amount of tokens to buy
token_value : The fiat value of a unit (1) of token
Returns: A boolean value, true the requested amount of tokens was "bought" and the portfolio updated. False if nothing was changed.
sell(portfolio, amount, token_value) Adjusts the portfolio state to perform the equivalent of a sell operation (as in, sell the requested amount of tokens at the provided value and set the portfolio accordingly).
Parameters:
portfolio : A portfolio float array as created by the `init()` function.
amount : The amount of tokens to sell
token_value : The fiat value of a unit (1) of token
Returns: A boolean value, true the requested amount of tokens was "sold" and the portfolio updated. False if nothing was changed.
[LanZhu] - Bursa Index/Sector Trend With PortfolioDescription
Hi all, this is a simple indicator that shows trend of both KLCI and sectors of Bursa . The sector finding is using my Bursa_Sector library. Besides, I have also included portfolio tracker which is by Mohamed3nan in this script.
Usage
Top Trend - Malaysia KLCI Index Trend
Bottom Trend - Any Bursa Sector Trend
Portfolio Table - Copy from Portfolio Tracker by Mohamed3nan

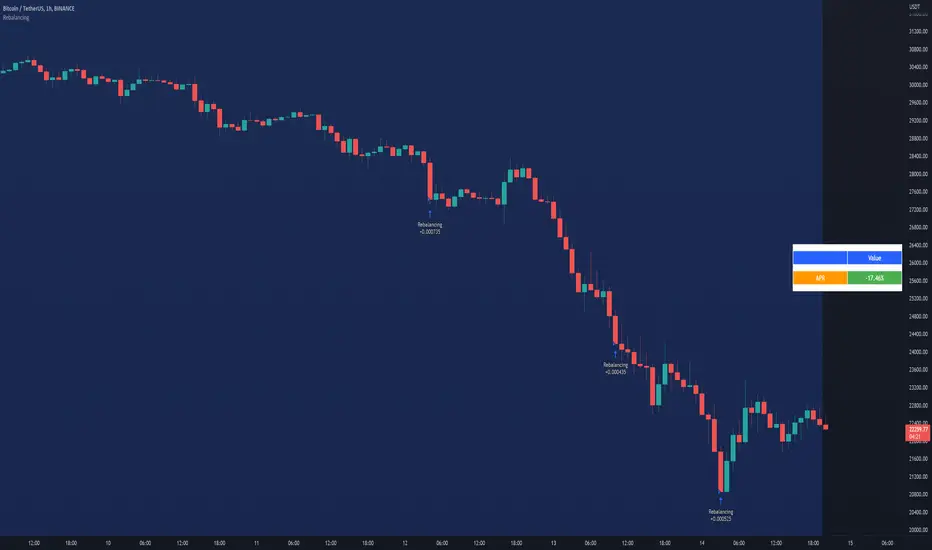
RebalancingThis script gives you an approximation of the APR you can get when using the technique of Rebalancing.
Further discription are embeded in the script.
HOW TO USE:
- Start date: Choose start date
- Settings: Change settings to your own needs
- Base currency: Select Base currency
- Portfolio: Select the coins (MAX 9 pcs.) you want to use in your portfolio for the rebalancing algoritm
- Click "Data Window" to see the APR (appr.)
Markets:
It can be used to all markets.
NOTE:
Some Exchanges don't go very far back in the past and for this reason this may have impact on this Indicator.
Make sure the coins you selected are available at the Exchange you select in the settings section. If you dont do this, the script generates an error.
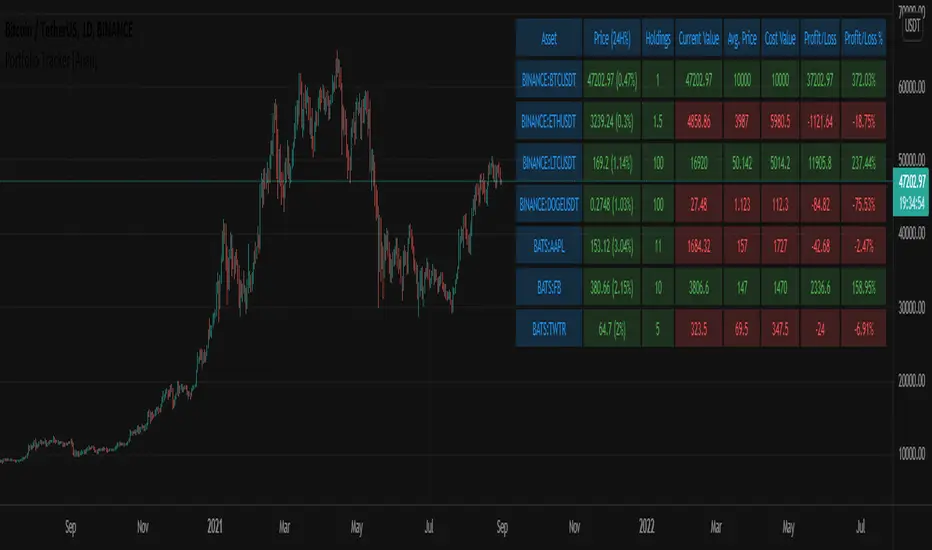
Portfolio Tracker [Anan]█ OVERVIEW
A simple Portfolio Tracker to track your Profit/Loss for any ticker in any market (stock, futures, index, forex, crypto, fund, dr.).
You just need to input (Asset / Quantity / Avg. Buy/Sell Price) and the script will calculate everything.
Also, you can use it for paper trading, or even what-if cases..
█ FEATURES
- Up to 10 positions
- Track your position real-time price and 24H change %
- Calculate your position current value
- Calculate your position cost value
- Calculate Profit/Loss
- Calculate Profit/Loss %
- Change every color in the table as you like.
Portfolio Backtester Engine█ OVERVIEW
Portfolio Backtester Engine (PBTE). This tool will allow you to backtest strategies across multiple securities at once. Allowing you to easier understand if your strategy is robust. If you are familiar with the PineCoders backtesting engine , then you will find this indicator pleasant to work with as it is an adaptation based on that work. Much of the functionality has been kept the same, or enhanced, with some minor adjustments I made on the account of creating a more subjectively intuitive tool.
█ HISTORY
The original purpose of the backtesting engine (`BTE`) was to bridge the gap between strategies and studies . Previously, strategies did not contain the ability to send alerts, but were necessary for backtesting. Studies on the other hand were necessary for sending alerts, but could not provide backtesting results . Often, traders would have to manage two separate Pine scripts to take advantage of each feature, this was less than ideal.
The `BTE` published by PineCoders offered a solution to this issue by generating backtesting results under the context of a study(). This allowed traders to backtest their strategy and simultaneously generate alerts for automated trading, thus eliminating the need for a separate strategy() script (though, even converting the engine to a strategy was made simple by the PineCoders!).
Fast forward a couple years and PineScript evolved beyond these issues and alerts were introduced into strategies. The BTE was not quite as necessary anymore, but is still extremely useful as it contains extra features and data not found under the strategy() context. Below is an excerpt of features contained by the BTE:
"""
More than `40` built-in strategies,
Customizable components,
Coupling with your own external indicator,
Simple conversion from Study to Strategy modes,
Post-Exit analysis to search for alternate trade outcomes,
Use of the Data Window to show detailed bar by bar trade information and global statistics, including some not provided by TV backtesting,
Plotting of reminders and generation of alerts on in-trade events.
"""
Before I go any further, I want to be clear that the BTE is STILL a good tool and it is STILL very useful. The Portfolio Backtesting Engine I am introducing is only a tangental advancement and not to be confused as a replacement, this tool would not have been possible without the `BTE`.
█ THE PROBLEM
Most strategies built in Pine are limited by one thing. Data. Backtesting should be a rigorous process and researchers should examine the performance of their strategy across all market regimes; that includes, bullish and bearish markets, ranging markets, low volatility and high volatility. Depending on your TV subscription The Pine Engine is limited to 5k-20k historical bars available for backtesting, which can often leave the strategy results wanting. As a general rule of thumb, strategies should be tested across a quantity of historical bars which will allow for at least 100 trades. In many cases, the lack of historical bars available for backtesting and frequency of the strategy signals produces less than 100 trades, rendering your strategy results inconclusive.
█ THE SOLUTION
In order to be confident that we have a robust strategy we must test it across all market regimes and we must have over 100 trades. To do this effectively, researchers can use the Portfolio Backtesting Engine (PBTE).
By testing a strategy across a carefully selected portfolio of securities, researchers can now gather 5k-20k historical bars per security! Currently, the PTBE allows up to 5 securities, which amounts to 25k-100k historical bars.
█ HOW TO USE
1 — Add the indicator to your chart.
• Confirm inputs. These will be the most important initial values which you can change later by clicking the gear icon ⚙ and opening up the settings of the indicator.
2 — Select a portfolio.
• You will want to spend some time carefully selecting a portfolio of securities.
• Each security should be uncorrelated.
• The entire portfolio should contain a mix of different market regimes.
You should understand that strategies generally take advantage of one particular type of market regime. (trending, ranging, low/high volatility)
For example, the default RSI strategy is typically advantageous during ranging markets, whereas a typical moving average crossover strategy is advantageous in trending markets.
If you were to use the standard RSI strategy during a trending market, you might be selling when you should be buying.
Similarily, if you use an SMA crossover during a ranging market, you will find that the MA's may produce many false signals.
Even if you build a strategy that is designed to be used only in a trending market, it is still best to select a portfolio of all market regimes
as you will be able to test how your strategy will perform when the market does something unexpected.
3 — Test a built-in strategy or add your own.
• Navigate to gear icon ⚙ (settings) of strategy.
• Choose your options.
• Select a Main Entry Strat and Alternate Entry Strat .
• If you want to add your own strategy, you will need to modify the source code and follow the built-in example.
• You will only need to generate (buy 1 / sell -1/ neutral 0) signals.
• Select a Filter , by default these are all off.
• Select an Entry Stop - This will be your stop loss placed at the trade entry.
• Select Pyamiding - This will allow you to stack positions. By default this is off.
• Select Hard Exits - You can also think of these as Take Profits.
• Let the strategy run and take note of the display tables results.
• Portfolio - Shows each security.
• The strategy runs on each asset in your portfolio.
• The initial capital is equally distributed across each security.
So if you have 5 securities and a starting capital of 100,000$ then each security will run the strategy starting with 20,000$
The total row will aggregate the results on a bar by bar basis showing the total results of your initial capital.
• Net Profit (NP) - Shows profitability.
• Number of Trades (#T) - Shows # of trades taken during backtesting period.
• Typically will want to see this number greater than 100 on the "Total" row.
• Average Trade Length (ATL) - Shows average # of days in a trade.
• Maximum Drawdown (MD ) - Max peak-to-valley equity drawdown during backtesting period.
• This number defines the minimum amount of capital required to trade the system.
• Typically, this shouldn’t be lower than 34% and we will want to allow for at least 50% beyond this number.
• Maximum Loss (ML) - Shows largest loss experienced on a per-trade basis.
• Normally, don’t want to exceed more than 1-2 % of equity.
• Maximum Drawdown Duration (MDD) - The longest duration of a drawdown in equity prior to a new equity peak.
• This number is important to help us psychologically understand how long we can expect to wait for a new peak in account equity.
• Maximum Consecutive Losses (MCL) - The max consecutive losses endured throughout the backtesting period.
• Another important metric for trader psychology, this will help you understand how many losses you should be prepared to handle.
• Profit to Maximum Drawdown (P:MD) - A ratio for the average profit to the maximum drawdown.
• The higher the ratio is, the better. Large profits and small losses contribute to a good PMD.
• This metric allows us to examine the profit with respect to risk.
• Profit Loss Ratio (P:L) - Average profit over the average loss.
• Typically this number should be higher in trend following systems.
• Mean reversion systems show lower values, but compensate with a better win %.
• Percent Winners (% W) - The percentage of winning trades.
• Trend systems will usually have lower win percentages, since statistically the market is only trending roughly 30% of the time.
• Mean reversion systems typically should have a high % W.
• Time Percentage (Time %) - The amount of time that the system has an open position.
• The more time you are in the market, the more you are exposed to market risk, not to mention you could be using that money for something else right?
• Return on Investment (ROI) - Your Net Profit over your initial investment, represented as a percentage.
• You want this number to be positive and high.
• Open Profit (OP) - If the strategy has any open positions, the floating value will be represented here.
• Trading Days (TD) - An important metric showing how many days the strategy was active.
• This is good to know and will be valuable in understanding how long you will need to run this strategy in order to achieve results.
█ FEATURES
These are additional features that extend the original `BTE` features.
- Portfolio backtesting.
- Color coded performance results.
- Circuit Breakers that will stop trading.
- Position reversals on exit. (Simulating the function of always in the market. Similar to strategy.entry functionality)
- Whipsaw Filter
- Moving Average Filter
- Minimum Change Filter
- % Gain Equity Exit
- Popular strategies, (MACD, MA cross, supertrend)
Below are features that were excluded from the original `BTE`
- 2 stage in-trade stops with kick-in rules (This was a subjective decision to remove. I found it to be complex and thwarted my use of the `BTE` for some time.)
- Simple conversion from Study to Strategy modes. (Not possible with multiple securities)
- Coupling with your own external indicator (Not really practical to use with multiple securities, but could be used if signals were generated based on some indicator which was not based on the current chart)
- Use of the Data Window to show detailed bar by bar trade information and global statistics.
- Post Exit Analysis.
- Plotting of reminders and generation of alerts on in-trade events.
- Alerts (These may be added in the future by request when I find the time.)
█ THANKS
The whole PineCoders team for all their shared knowledge and original publication of the BTE and Richard Weismann for his ideas on building robust strategies.
═════════════════════════════════════════════════════════════════════════

RedK Portfolio Tracker [Table Version]RedK Portfolio Tracker is a simple tool that enables a trader to monitor and track a portfolio of up to 10 holdings (+ free cash) in real time - directly on the chart
Now that we have tables in Pine, this is a table version of my previously published Portfolio Tracker
- The table works better in visualizing the various table elements (title row, column labels..etc), and is more flexible in allowing color coding of gain/loss. for many traders, myself included, these simple visual signals are valuable in helping timely trading decisions.
I'll come back and improve this script as i'm really enjoying the ability to track things this way - if you liked this and want to receive the updates, please flag / favorite it below and you'll get notified when i publish new versions.
Some new features for the table version:
- ability to change default color of various table elements (text, default background, title background, gain/loss color, border..etc)
- ability to change the text size to suit your monitor and visual preference
- ability to change table position
The "portfolio-specific" inputs are similar to the previous version - we get the ability to enter up to 10 positions, entry price and qty, then also add the free cash
- also a change from prior version, this table will plot by default on the price chart, but will have no scale - the portfolio ploy itself will also show (blue/orange stepping line) but the PnL plot will be hidden by default -- how we plot the portfolio & P/L is possibly one of the areas for improvements for next versions - also thinking of other adding valuable data i track in my own trading, like the quarterly dividends for the held positions .. we'll see - this is just a start
hope some will find this useful. feel free to comment.

Tabular Portfolio by CJS V1This is a useful indicator that sits on top of the charts, in the right hand bottom corner and shows the current price, profit or loss in value and percent of upto 20 scrips fed in, in a Tabular form using tables feature.
Allows to mark a/c id also if you have multiple broker or individual accounts.
Colors are customisable.
Stocks get updated no matter what is your current selected scrip.
Gives total investment and total PnL also in percent.
Useful to monitor your portfolio status in once screen and while you are looking at charts.
Give feedback for improvement or issues, if any.
Credits to RedKTrader from where the idea was picked up.
Move visual order to front, if the charts and other indicators overlap the table view.
Combo Month-to-Month % ReturnA combined version of two already published indicators:
Combo Month-to-Month % Return (January - June)
Combo Month-to-Month % Return (July - December)
Allows to compare an asset's monthly returns over years.
Includes:
Customizable columns
Up to 20 columns per each chart
Customizable Min, Max, Mean, Median and Standard Deviation lines
Customizable labels

RedK_Portfolio Tracker v2: few enhancements and display optionsThis is an update for the PTracker v1 that I published couple of days ago. wanted to publish this as a separate script to get a chance to show how the new Portfolio Summary Infobox can be displayed on the price chart as an option. In my opinion, that info box is the most important element in this tool and that's the piece i was most looking for.
quick note here: you can track your portfolio (if not so many positions) by entering something like (without the brackets) in TradingView's chart symbol area - TradingView will resolve these symbols and chart the total -- there's a nice post by our friend @boji1 about this in a lot more details - however, that wouldn't show the stats that i need to look at to track my portfolio on daily basis.
i also made couple of other enhancements, like adding the ability to include "free cash" in the portfolio - While this free cash value will impact the Total P/L and P/L %, as part of the overall portfolio (and the denominator), it will not impact the "cost of positions" or the (current) "value of positions" -- also "Cash" will not count towards the total 10 positions that we can track with this tool.
Using Portfolio Tracker as a floating panel on the price chart
====================================================
By default, when the Portfolio Tracker is added to the chart, it will occupy its own lower panel like the picture above.
if your charts are already busy (like mine :)) - you most probably already have a couple of lower studies and it's crowded there.
in this case, you can use the Object Tree tool after adding the PTracker, to drag it onto the price panel, or you can also do that by right-clicking on the infobox and choose to move up to the price panel.
when you do that, remember to also use the Style settings of PTracker to hide both Portfolio and PnL plots, and choose Scale = no scale - this way you get the infobox to work like a floating panel on the price chart
here's a screenshot that shows this scenario - also shows how the infobox color can be easily changed from the PTracker settings to suit your chart background and for best visibility
i hope this is useful in your trading - i look forward to @TradingView team surprising us with a real portfolio tracking capability soon :)
good luck.
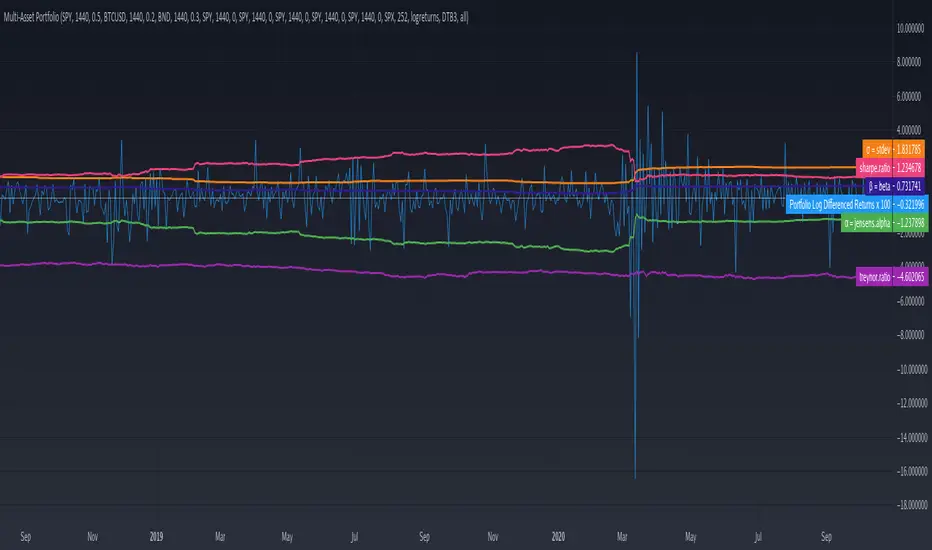
Multi-Asset PortfolioWith thanks to luminaryfi for this indicator calculates basic metrics and statistics for a multi-asset portfolio. Note that returns are plotted after being multiplied by 100 in order allow the series to be visible against the other statistics.
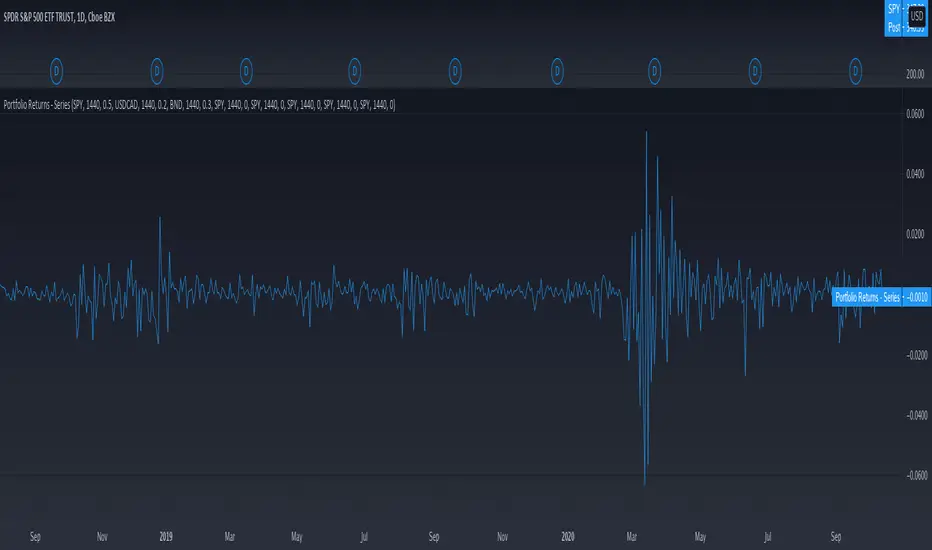
Portfolio Log Returns - SeriesPlot a series of your portfolio! Merely calculate the (constant) weights (ensuring that they sum to one) and plug in along with the corresponding symbols in order to visualize your portfolio returns as a series. Experimenting before settling on a portfolio? Calculate your theoretical weights using tools online for mean-variance optimization, Black-Litterman allocation, or the like!
Portfolio Backtester [MS]Portfolio Backtester (with rebalancing) for any assets you choose.
Simple to use, input any assets and their percentage allocations, choose a rebalance interval, then see how that portfolio performs over time.
To compare two or more portfolios, add this indicator multiple times, click and drag one on top of the other (into the same pane), then pin both to the same scale .
Its recommended to view this "indicator" on an asset with lots of historical data in order to have the most flexibility in a Start Date. Calculations are limited by chart you're viewing.
Settings
• Input the portfolio's assets
• Input the assets' allocations
• Input start and end dates
• Set the initial capital investment
• Set the rebalancing period (visualized as dots on the chart)
• Display Performance label
• Display Rebalancing labels
Things To Note
• The Start Date will be the later of the date you enter and the first candle of the chart you're viewing.
• If an asset's data doesn't exist at the start or any rebalance, it's percentage allocation will go to cash.
• The backtester calculates purely on asset price, and does not take into account any commissions, fees, dividends, or any other extra additions or deductions.
Version 1: only supports whole-shares, and not fractional-shares of assets.
PM us with any questions about this indicator.
