Pengurusan portfolio
RDT Buy/Sell Signals Scalp 1MExit alerts for scalps for the 1m chart.
An alert is triggered, if a 1m candle ended and a 3/8 EMA cross was created in the according direction (depending on whether Long or Short Exit alert is set).
Entry alerts basically work the same. I've never ever used them so far though, since it never made sense the way I trade.
More infos: www.reddit.com

15/30M Alerts"X Candle Close":
Same as in 5m Enter alert: it's really helpful to wait for a 15m/30m candle to be confirmed, to see f. e. whether a candle really broke a support / resistance or not - and to prevent making bad decisions.
More infos: www.reddit.com

1D Exit Alerts"A Daily Exit LONG" + "B Daily Exit SHORT":
I'm not using this one anymore since they often make me worry more than necessary, and I focus more on aiming to reach specific price targets, or using the 5m Exit alerts instead.
Also swing trades require less time-sensitive operations than day trades, so for me personally they felt a bit redundant.
But maybe it helps some of you:
There are 4 conditions that trigger it. As with 5m Exit Alerts, the triggering reasons show up in the exit alert message (unfortunately only as a number, since alert messages can't have "dynamic text" in TradingView).
Here are the conditions sorted from best to worst:
Gap Up / Down. Better check SPY and the stock whether a Gap Reversal is likely to happen (aka get out) or whether the stock will keep going higher / lower.
Earnings: End of day or Tomorrow morning. Alert is triggered at beginning of morning before earnings, and then again 15m before market close.
Mental stop loss: Broke daily EMA 8 or SMA - in the wrong direction....
Wrong direction: Broke below / above yesterday's Low / High. It's not immediately triggered, but only after re-touching VWAP again, to prevent too impulsive exits.
As with 5m Exit alerts: Always consider how the market and stock looks like, then decide whether to exit or not! These are meant to make you look at the chart, not to FOMO-exit.
"X Candle Close":
Same as in 1D Enter alert: Is triggered 15m before market close (I put it in here as well because I kept forgetting whether I put this one into Enter or Exit alerts...)
More infos: www.reddit.com
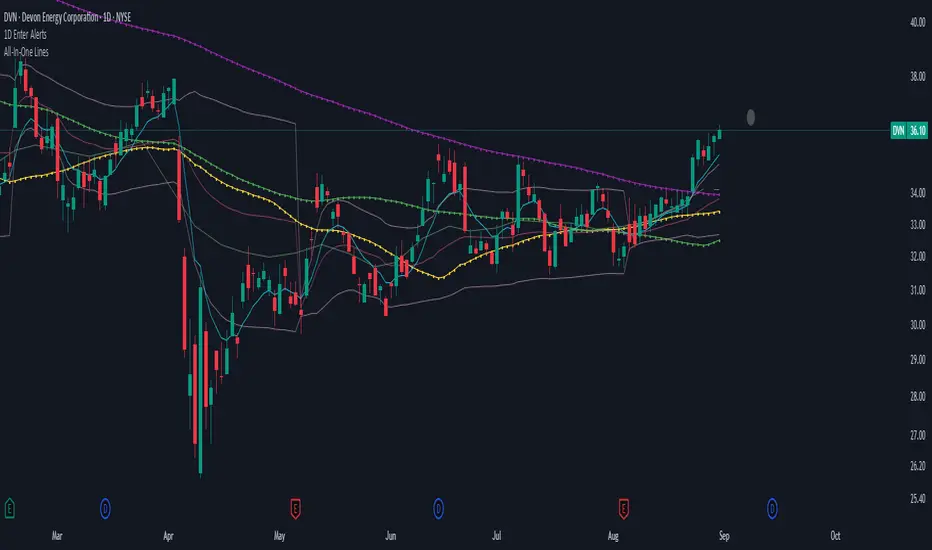
1D Enter AlertsThis is only a remaining of an experiment. I had real swing enter alerts, but it just made more sense to use classic TradingView alerts for horizontal / trendline / SMA breaks.
(Btw you can set up a horizontal alert in TradingView just by hovering the mouse on the chart so it's at the price point you aim for, and pressing "Alt + A").
Once this horizontal alert triggered I would usually wait for confirmation of the move on the 5m. If it's f. e. a break of an SMA and I'm not convinced yet, I might wait until end of the day. For exactly that purpose the following alert comes in handy:
"X Candle Close":
Is triggered 15m before market close - good reminder to check a stock again to see whether a resistance / support break was valid - and the stock should be entered as a swing, or maybe whether it should be closed as a loss.
"Z Trend Change: UP" + "Z Trend Change: DOWN":
Same as on 5m Exit Alert: meant to be only applied on SPY, and to have it set up to never end!
Criteria:
SPY broke through daily EMA 8 or daily SMA today, indicating an important short-term change on the daily chart.
Is triggered 15m before market close
More infos: www.reddit.com
5m Exit AlertsThese can help a lot with Daytrading if you don't have a price target in mind when there's no clear resistance / support nearby, and you don't trust the market enough to hold it as a swing trade.
Keep in mind that its main purpose is to give you a "warning" that it might be good to look at your screen, instead of guaranteeing you "now is the best time to exit". You won't reach high winning stats by blindly following this alert.
"A Exit LONG":
(I'm using letters instead of numbers for all Exit alerts to make sure I don't accidentally confuse Enter and Exit alerts).
There are 4 conditions that might trigger it. The reasons show up in the exit alert message (unfortunately only as a number, since alert messages can't have "dynamic text" in TradingView), and can also be displayed as symbols in the chart (see image above - make sure to enable "Show Signals" in the indicator settings first though).
Here are the conditions sorted from best to worst:
Technical reversal: Bearish Hammer candle with Volume > 2 * avg volume (of last 30 candles), when 5m candle closed. Reversal very likely. This is usually the best time to take your gains for the rest of the day.
EMA 3/8 cross: standard 5m EMA 3/8 cross, indicating a trend reversal, or at least a pullback. Can also be helpful to detect double tops / double bottoms.
Trailing Stop Loss: Crossed below 30m EMA 8, 5m candle closed. This is a "fallback" alert in case EMA 3 was already below EMA 8 before you set up the alert. It's not unlikely that the stock might go further down to VWAP, so depending on the chart and market this might be a good opportunity to save the gains you have left.
"Final" Stop Loss: Crossed below VWAP. Usually not a good sign. If you entered around VWAP your losses shouldn't be big yet, but if you plan on holding the stock the Daily chart and market outlook should better be quite convincing, and you wouldn't have needed to use this alert in the first place.
Keep in mind these work of course best if you picked a "good" stock: clear movement, tidy price action, high volume. Otherwise alerts are more likely to be triggered redundantly.
Always consider how the market and stock looks like, then decide whether to exit or not! Usually it makes sense to wait a bit to see f. e. whether the stock bounces off the 30m EMA 8, and it's just a pullback.
"B Enter SHORT":
Similar, but for shorts...
"C 1m Scalp LONG" + "D 1m Scalp SHORT":
Simple Scalping alert for EMA 3/8 cross on a 1m chart - but without needing to use a 1m chart to set it up!
Unfortunately it's not as accurate as manually setting this alert up on a 1m chart. It might be an advantage though that it sometimes is triggered 1-2 min later, since this means there are less redundant triggerings.
It can be useful esp. on high momentum trades, but I honestly haven't used it in a looong while.
"X Candle Close":
same as in 5m Entry indicator: triggered when 5m candle is confirmed
"Z Trend Change: UP" + "Z Trend Change: DOWN":
This one is meant to be used only on SPY: It alerts you when SPY is changing its trending direction, which might mean entering or closing existing trades.
I have therefore set it up to never end (by setting it to "Once Per Bar Close" in the alert settings).
It's based on DMI positive or negative being > 25. I had it based on VWAP at the beginning, but there were days where it was triggered every 5 minutes...
More infos: www.reddit.com

5m Enter AlertsThese alerts work really well to help you find good entries on the 5m chart:
"1 Enter LONG":
This one I use more often than any other alert. It's really great if the stock looks good but is currently overextended on the 5m, or looks like it's starting to pull back. It's triggered right after the stock pulled back to the VWAP or 15m EMA 8 and is about to continue.
All these criteria need to be met for the alert to be triggered on a VWAP pullback:
Crossed up VWAP or VWAP + half ATR recently (so it's also triggered even if it doesn't cross below VWAP on a pullback)
Above 5m EMA 8 (since this indicates it will likely continue higher up)
Closed above highest High of last 3 candles (to prevent premature alerts while the price started pulling back into the range of VWAP + half ATR)
Candle is confirmed (5m ended)
For the 15m EMA 8 pullback it's the same, except for that the 15m EMA 8 also still needs to be above VWAP (otherwise you wouldn't want to enter yet anyways).
"2 Enter SHORT":
Similar, but for shorts...
"3 High Volume Candle":
Detects High Volume Candles on the 5m chart. Can be helpful to get informed that a resistance / support finally broke on high volume, or to be notified about a potential reversal. Can therefore also be useful if applied on SPY.
Criteria:
Candle's volume > 1.2 * avg volume (of last 30 candles)
"X Candle Close":
This one I use quite often as well: it's really helpful to wait for a 5m candle to be confirmed, to see f. e. whether a candle really broke a support / resistance or not - and to prevent making bad decisions.
Criteria:
5m candle closed
More infos: www.reddit.com

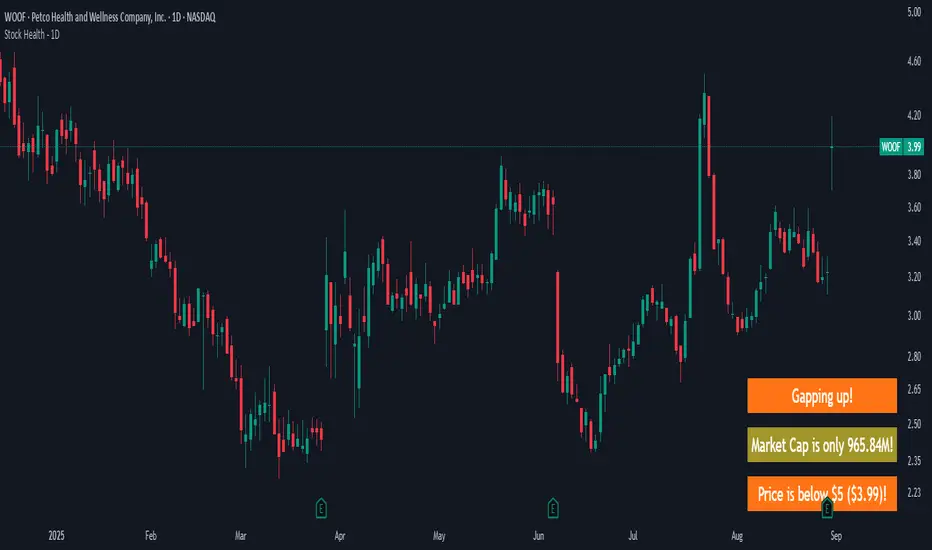
Stock Health - 1DWarns you if you look at a "bad" stock, meaning:
Market cap is < 1B (and more intrusive warning if < 500M)
Price is < 10$ (more intrusive if < 5$)
Yesterday's Daily Volume was < 1M (more instrusive if < 500K)
There are earnings end of the day / tomorrow morning
There's a Gap up/down - because I likely shouldn't jump in already but see how it develops
Meant to be used on a 1D chart.
More infos: www.reddit.com
Stock Health - 5mWarns if you are about to trade before 45 min passed since market open.
Good reminder if you are impatient / have ADHD...
Meant to be used on a 5m chart.
More infos: www.reddit.com

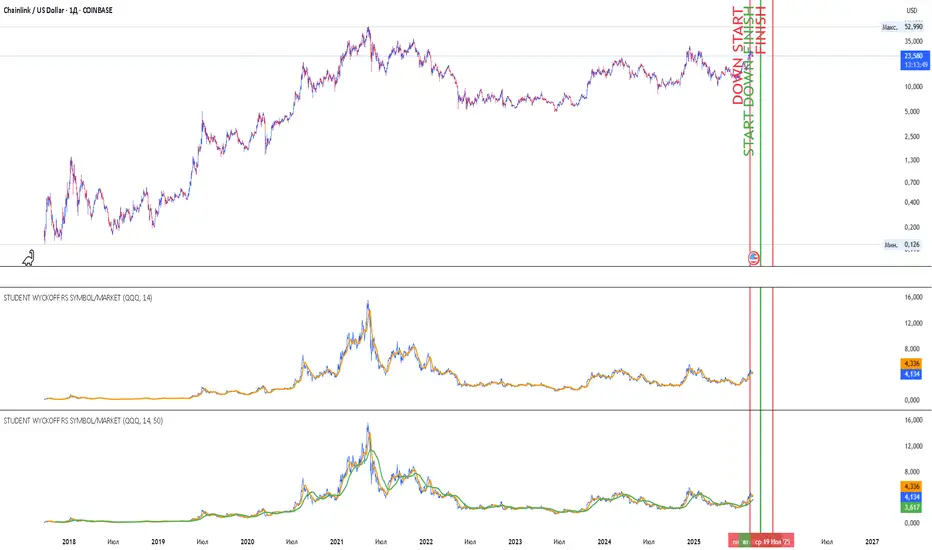
Student Wyckoff RS Symbol/MarketRelative Strength Indicator STUDENT WYCKOFF RS SYMBOL/MARKET
Description
The Relative Strength (RS) Indicator compares the price performance of the current financial instrument (e.g., a stock) against another instrument (e.g., an index or another stock). It is calculated by dividing the closing price of the first instrument by the closing price of the second, then multiplying by 100. This provides a percentage ratio that shows how one instrument outperforms or underperforms another. The indicator helps traders identify strong or weak assets, spot market leaders, or evaluate an asset’s performance relative to a benchmark.
Key Features
Relative Strength Calculation: Divides the closing price of the current instrument by the closing price of the second instrument and multiplies by 100 to express the ratio as a percentage.
Simple Moving Average (SMA): Applies a customizable Simple Moving Average (default period: 14) to smooth the data and highlight trends.
Visualization: Displays the Relative Strength as a blue line, the SMA as an orange line, and colors bars (blue for rising, red for falling) to indicate changes in relative strength.
Flexibility: Allows users to select the second instrument via an input field and adjust the SMA period.
Applications
Market Comparison: Assess whether a stock is outperforming an index (e.g., S&P 500 or MOEX) to identify strong assets for investment.
Sector Analysis: Compare stocks within a sector or against a sector ETF to pinpoint leaders.
Trend Analysis: Use the rise or fall of the RS line and its SMA to gauge the strength of an asset’s trend relative to another instrument.
Trade Timing: Bar coloring helps quickly identify changes in relative strength, aiding short-term trading decisions.
Interpretation
Rising RS: Indicates the first instrument is outperforming the second (e.g., a stock growing faster than an index).
Falling RS: Suggests the first instrument is underperforming.
SMA as a Trend Filter: If the RS line is above the SMA, it may signal strengthening performance; if below, weakening performance.
Settings
Instrument 2: Ticker of the second instrument (default: QQQ).
SMA Period: Period for the Simple Moving Average (default: 14).
Notes
The indicator works on any timeframe but requires accurate ticker input for the second instrument.
Ensure data for both instruments is available on the selected timeframe for precise analysis.
Crypto Perp Calc v1Advanced Perpetual Position Calculator for TradingView
Description
A comprehensive position sizing and risk management tool designed specifically for perpetual futures trading. This indicator eliminates the confusion of calculating leveraged positions by providing real-time position metrics directly on your chart.
Key Features:
Interactive Price Selection: Click directly on chart to set entry, stop loss, and take profit levels
Accurate Lot Size Calculation: Instantly calculates the exact position size needed for your margin and leverage
Multiple Entry Support: DCA into positions with up to 3 entry points with customizable allocation
Multiple Take Profit Levels: Scale out of positions with up to 3 TP targets
Comprehensive Risk Metrics: Shows dollar P&L, account risk percentage, and liquidation price
Visual Risk/Reward: Color-coded boxes and lines display your trade setup clearly
Real-time Info Table: All critical position data in one organized panel
Perfect for traders using perpetual futures who need precise position sizing with leverage.
---------
How to Use
Quick Start (3 Clicks)
1. Add the indicator to your chart
2. Click three times when prompted:
First click: Set your entry price
Second click: Set your stop loss
Third click: Set your take profit
3. Read the TOTAL LOTS value from the info table (highlighted in yellow)
4. Use this lot size in your exchange when placing the trade
Detailed Setup
Step 1: Configure Your Account
Enter your account balance (total USDT in account)
Set your margin amount (how much USDT to risk on this trade)
Choose your leverage (1x to 125x)
Select Long or Short position
Step 2: Set Price Levels
Main levels use interactive clicking (Entry, SL, TP)
For multiple entries or TPs, use the settings panel to manually input prices and percentages
Step 3: Read the Results
The info table shows:
TOTAL LOTS - The position size to enter on your exchange
Margin Used - Your actual capital at risk
Notional - Total position value (margin × leverage)
Max Risk - Dollar amount you'll lose at stop loss
Total Profit - Dollar amount you'll gain at take profit
R:R Ratio - Risk to reward ratio
Account Risk - Percentage of account at risk
Liquidation - Price where position gets liquidated
Step 4: Advanced Features (Optional)
Multiple Entries (DCA):
Enable "Use Multiple Entries"
Set up to 3 entry prices
Allocate percentage for each (must total 100%)
See individual lot sizes for each entry
Multiple Take Profits:
Enable "Use Multiple TPs"
Set up to 3 TP levels
Allocate percentage to close at each level (must total 100%)
View profit at each target
Visual Elements
Blue lines/labels: Entry points
Red lines/labels: Stop loss
Green lines/labels: Take profit targets
Colored boxes: Visual risk (red) and reward (green) zones
Info table: Can be positioned anywhere on screen
Alerts
Set price alerts for:
Entry zones reached
Stop loss approached
Take profit levels hit
Works with TradingView's alert system
Tips for Best Results
Always verify the lot size matches your intended risk
Check the liquidation price stays far from your stop loss
Monitor the account risk percentage (recommended: keep under 2-3%)
Use the warning indicators if risk exceeds margin
For quick trades, use single entry/TP; for complex strategies, use multiple levels
Example Workflow
Find your trade setup using your analysis
Add this indicator and click to set levels
Check risk metrics in the table
Copy the TOTAL LOTS value
Enter this exact position size on your exchange
Set alerts for key levels if desired
This tool bridges the gap between TradingView charting and exchange execution, ensuring your position sizing is always accurate when trading with leverage.
Disclaimer, this was coded with help of AI, double check calculations if they are off.

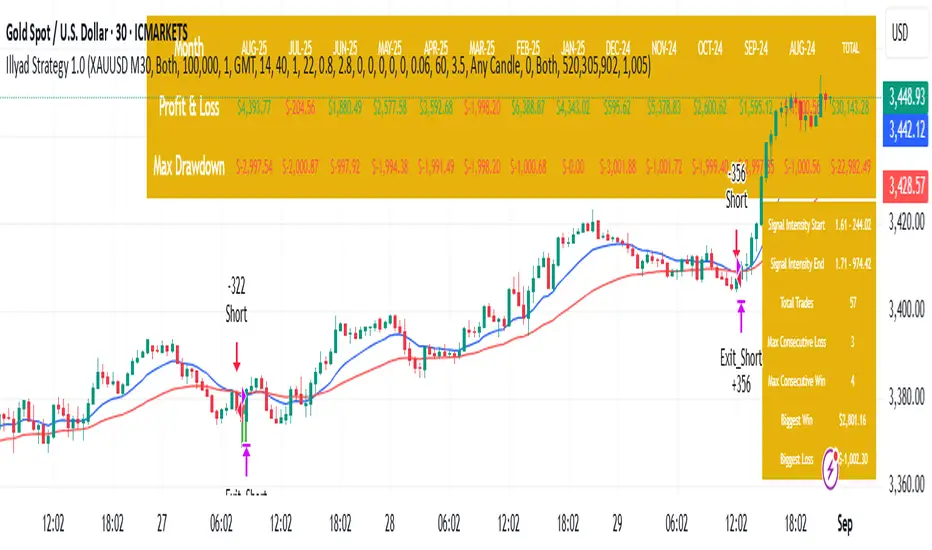
Optimised XAU/USD (Gold, IC Markets, 30m)The Illyad Strategy 1.0 optimised for XAU/USD (Gold) on the 30-minute timeframe (IC Markets feed).
📊 Backtest Results (Jan 2024 – Aug 2025):
✅ Total P&L: +30,143.28 USD (+30.14%)
📉 Max Drawdown: 3.60% (3,945.84 USD)
🔁 Total Trades: 57
📈 Win Rate: 42.11% (24/57 trades)
⚖️ Profit Factor: 1.91
This setup shows steady performance and low drawdown on Gold — ideal for traders wanting to capture volatility while maintaining consistency.
🔧 Optimisation Notes:
Works best on the 30m timeframe.
Each instrument (forex, indices, commodities, stocks) has unique behaviour.
To maximise results, always optimise the parameters per symbol — e.g., Gold requires a different configuration than GBP/USD or NASDAQ.
💡 Best Use Cases:
Prop firm challenges & scaling funded accounts.
Long-term compounding with low risk.
Automated execution via TradingView alerts → MT5 for hands-free trading.
⚠️ Disclaimer:
This strategy is for educational purposes only. Past results do not guarantee future performance. Always backtest and forward-test before going live.
📲 Next Steps:
This example demonstrates the Gold (XAU/USD) optimisation. The Illyad Strategy can be tuned for any forex pair, index, or commodity with proper optimisation.
👉 Visit my profile for full automation solutions.
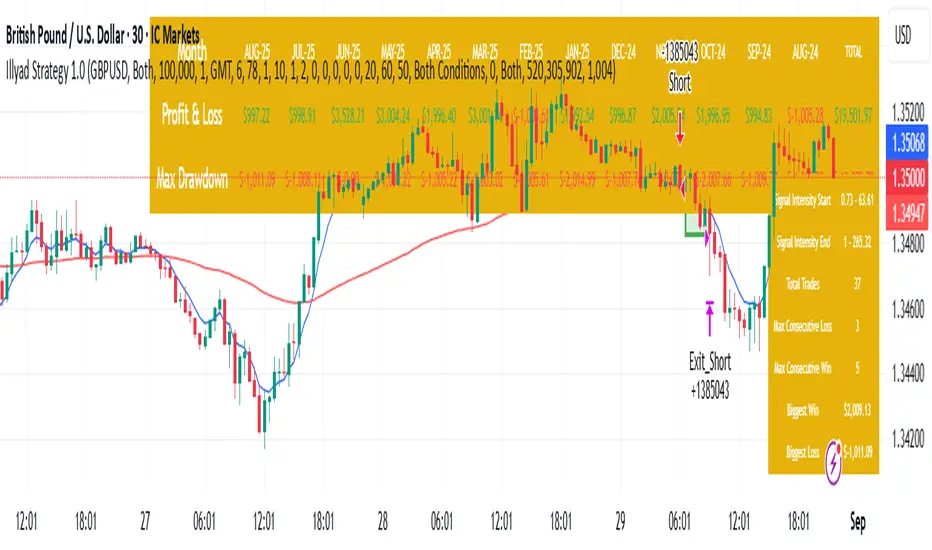
Optimised GBP/USD (IC Markets, 30m)This is the Illyad Strategy 1.0 optimised for GBP/USD on the 30-minute timeframe (IC Markets feed).
📊 Backtest Results (Jan 2024 – Aug 2025):
✅ Total P&L: +19,501.97 USD (+19.50%)
📉 Max Drawdown: 3.57% (3,607.64 USD)
🔁 Total Trades: 37
📈 Win Rate: 51.35% (19/37 trades)
⚖️ Profit Factor: 2.08
This version shows steady profitability with controlled drawdown, making it highly effective for prop firm evaluations and scaling accounts.
🔧 Optimisation Notes:
Works best on the 30-minute timeframe.
Each symbol behaves differently — always optimise the algo per instrument (e.g. GBP/USD vs EUR/GBP vs Gold).
Parameters such as moving averages, risk, and SL/TP ratios can be tuned to maximise performance.
💡 Best Use Cases:
Prop firm challenges (FTMO, AquaFunded, MyForexFunds, etc.).
Scaling funded capital by trading multiple accounts simultaneously.
Full automation via TradingView alerts → MT5 integration.
⚠️ Disclaimer:
This script is for educational purposes only. Past results do not guarantee future performance. Always backtest and forward-test on demo before going live.
📲 Next Steps:
This setup demonstrates the GBP/USD optimisation. The Illyad Strategy can be adjusted to perform across any forex pair, index, or stock with proper optimisation.
👉 Check my profile for full automation solutions.
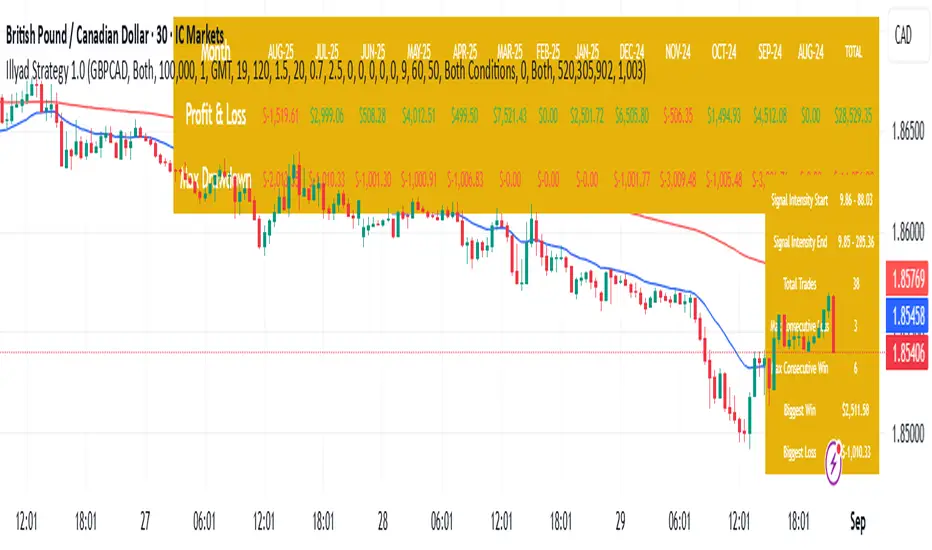
Optimised GBP/CAD (IC Markets, 30m) - Automated TradingHere’s the Illyad Strategy 1.0 optimised for GBP/CAD on the 30-minute timeframe (IC Markets feed).
📊 Backtest Results (Jan 2024 – Aug 2025):
✅ Total P&L: +28,529.35 CAD (+28.53%)
📉 Max Drawdown: 3.61% (3,822.27 CAD)
🔁 Total Trades: 38
📈 Win Rate: 50.00% (19/38 trades)
⚖️ Profit Factor: 2.49
This setup shows strong performance with low drawdown, making it well-suited for prop firm trading and long-term portfolio compounding.
🔧 Optimisation Notes:
Works best on the 30-minute timeframe.
Each symbol has unique volatility and structure. To maximise results, you must optimise the algo per symbol (e.g., GBP/CAD vs EUR/USD vs NASDAQ).
Parameters such as moving averages, signal intensity, and SL/TP levels should be tuned to the instrument.
💡 Best Use Cases:
Prop firm challenges (FTMO, AquaFunded, MyForexFunds alternatives).
Running across multiple accounts simultaneously for compounding.
Automated execution via TradingView alerts → MT5 integration.
⚠️ Disclaimer:
This script is provided for educational purposes only. Past results do not guarantee future performance. Always backtest and forward-test on demo before live trading.
📲 Next Steps:
This version demonstrates the GBP/CAD optimisation. The Illyad Strategy can be tuned to work on any symbol (forex, indices, or stocks).
👉 Visit my profile for full automation solutions (TradingView → MT5)
Optimised EURGBP (IC Markets, 30m)Illyad Strategy 1.0 – Optimised EURGBP (IC Markets, 30m)
Description:
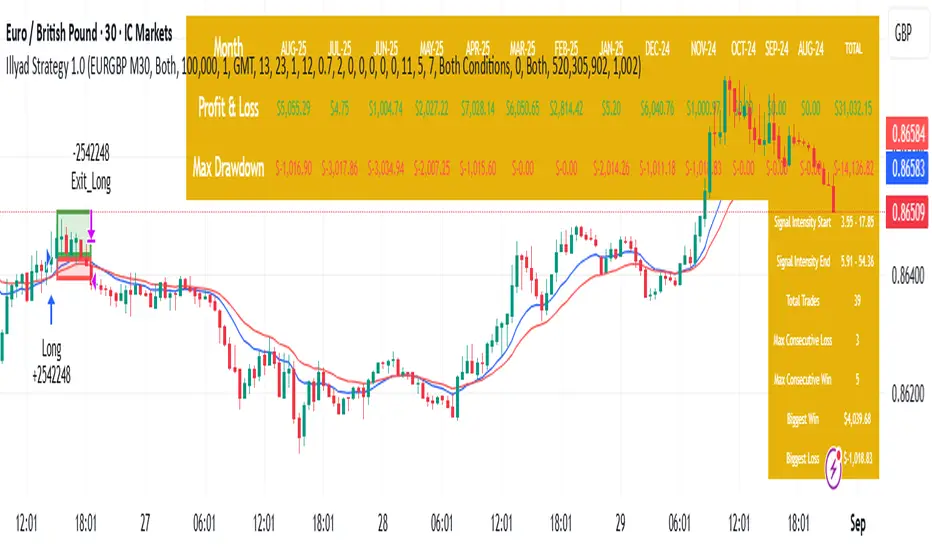
This is the Illyad Strategy 1.0 optimised for EURGBP on the 30-minute timeframe (IC Markets feed).
📊 Results (Jan 2024 – Aug 2025):
✅ Total P&L: +£31,032.15 (+31.03%)
📉 Max Drawdown: 2.86% (£3,576.85)
🔁 Total Trades: 39
📈 Win Rate: 58.97%
⚖️ Profit Factor: 2.92
This strategy focuses on controlled drawdown + consistent growth, making it ideal for prop trading challenges and long-term account compounding.
🔧 Optimisation:
Works best on the 30m timeframe.
Each symbol behaves differently — for maximum performance, you should optimise the parameters (MAs, SL/TP, intensity) to the instrument you want to trade.
Example: The EURGBP setup shown here differs from what you’d use on NASDAQ, XAUUSD, or stocks like Tesla.
💡 Best Use Cases:
Passing and scaling prop firm accounts (FTMO, AquaFunded, etc.).
Automated alerts → MT5 integration (hands-free trading).
Consistent, rule-based trading without emotion.
⚠️ Disclaimer:
This script is for educational purposes only. Past results don’t guarantee future performance. Always backtest and forward-test on demo before live trading.
📲 Next Steps:
This version shows the EURGBP optimisation. If you want to run it on other pairs, indices, or stocks → simply optimise parameters for that symbol.
👉 For full automation (TradingView → MT5 execution), check my profile for details.
Illyad Strategy 1.0 - Automate your alerts by connecting to MT5Illyad Strategy 1.0 – Automated Prop Trading System (30m Timeframe)
Description:
The Illyad Strategy 1.0 is a rule-based automated trading system designed for serious traders and prop-firm challenges.
🔑 Key Features:
Optimised to work best on the 30-minute timeframe.
Built-in money management to keep drawdown controlled.
Dynamic stop-loss / take-profit levels.
Works across forex, indices, and stocks.
Compatible with TradingView alerts → MT5 automation.
⚙️ Optimisation:
Each symbol has its own behaviour. For best results, you should optimise the parameters (moving averages, signal intensity, SL/TP ratios) on the symbol you want to trade. The algo adapts differently to EURUSD vs NASDAQ vs stocks like TSLA, so proper tuning is critical.
💡 Best Use Case:
Prop firm accounts (FTMO, MyForexFunds, AquaFunded, etc.).
Consistent returns without emotional decision-making.
Traders who want to scale multiple accounts at once.
⚠️ Disclaimer:
This script is for educational purposes. Past results do not guarantee future returns. Always backtest and forward test on demo before going live.
📲 Next Step:
This is the public version. If you’d like to connect it directly to MT5/MT4 for fully automated trading, visit my profile or contact me for details.

Trade Size Calculator By Skapez Trade Size Calculator By Skapez — ARM it, Drag & Trade!
A simple, position-sizing calculator for easy trader sizing.
It plots Entry / Stop / TP lines, sizes your trade to a fixed % risk (e.g., 2%), calculates leverage, and shows clean labels (Risk $, TP $, Position $, Leverage ×). You can ARM a setup, drag the lines to fine-tune, and (optionally) trigger alerts for webhooks.
What it does:
Fixed-fractional risk : sizes position so SL equals your chosen % of account (e.g., 2%).
Leverage cap & lot rounding : respects your max leverage and exchange lot step.
Drag-to-edit : move Entry/Stop; TP and sizing update automatically.
Swing-stop helper (optional): snap SL to recent swing low/high or nearest pivot. (Auto stop loss finder)
Valid-until window: auto-expires stale setups (e.g., after 120 minutes).
Alerts-ready: add your own JSON in the alert to send to a bot/webhook.
Quick start (60 seconds)
Add to chart and open Settings.
In Risk, set:
Account Balance (USD) and Risk % (e.g., 2.0).
Side (Long/Short).
In Levels:
Put an Entry price (or leave 0 to use current price when you ARM).
Choose Stop: type it manually or toggle Swing stop helper.
Pick your Target R multiple (e.g., 3.0 for 3:1).
In Leverage, set:
Leverage Cap (e.g., 10×) and Min/Step Size (e.g., 0.001 BTC).
Toggle ARM on. Three lines appear. Drag the blue/red lines if needed; the green TP and all numbers update.
Tip: Pin the indicator to the Right Price Scale (format icon → “Pin to scale”) so everything lines up perfectly.
On-chart visuals
Blue = Entry (label shows Position $ and Leverage × to the far right).
Red = Stop (label shows Risk $).
Green = TP (label shows TP P&L $).
Works on any symbol/timeframe; prices are rounded to the symbol’s tick size.
That’s it—arm, drag, and go.

Simple MADSimple MAD is a lightweight and customizable indicator that calculates the Median Absolute Deviation (MAD) over a configurable period to measure market volatility. It dynamically displays Stop-Loss (SL) and Take-Profit (TP) levels based on MAD multipliers, both in absolute price and percentage terms.
The indicator includes a clean, watermark-style table with full layout controls — allowing you to adjust position, text size, alignment, and colors. It supports both manual entry price and automatic use of the latest close, making it ideal for traders who want to manage risk with precision and clarity.
Perfect for swing traders, volatility-based strategies, and anyone looking to integrate MAD into their decision-making.

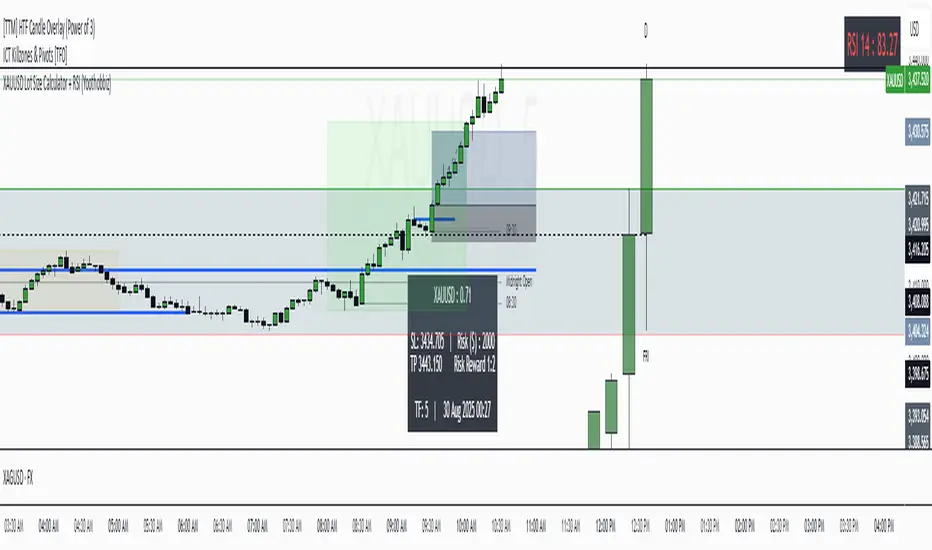
XAUUSD Lot Size Calculator + RSI (Yoothobbiz)This indicator is designed for Gold traders on the 5-minute timeframe (M5) who want a clear and editable lot size, stop loss, and take profit calculator directly on their chart.
✨ Features:
📌 Dynamic Lot Size Calculation – based on account capital, chosen risk %, and stop loss distance.
⚖️ Risk/Reward Management – automatically displays TP level using a customizable risk/reward ratio (e.g., 1:2, 1:3, etc.).
🛑 Stop Loss in Points & Price – calculates SL from recent M5 highs/lows, including spread.
🎯 Take Profit in Price & Points – automatically adjusted to your risk/reward ratio.
💵 Risk in USD – instantly shows how much capital is at risk per trade.
🕒 Custom Time Zone Support – displays the real trading time (default UTC-4 for New York), fully editable for any user.
⏱ Timeframe Label – clearly shows the working timeframe (M5 by default).
🎨 Fully Editable Display Panel:
Position (6 corners available).
Font family, size, style (bold/italic).
Text and background colors.
Adjustable spacing between lines.
🔑 How to Use:
Set your capital and risk % in the settings.
Adjust spread (in points) if needed.
Choose your risk/reward ratio.
The panel will display:
Recommended lot size for XAUUSD
Stop loss (price + points)
Take profit (price + ratio)
Risk in $
Timeframe & real-time clock
📍 Notes:
Optimized for XAUUSD (Gold) and the 5M timeframe.
Works on any asset/timeframe, but SL logic is based on M5 candle highs/lows.
Ideal for traders who want a fast and disciplined risk management tool right on their chart.
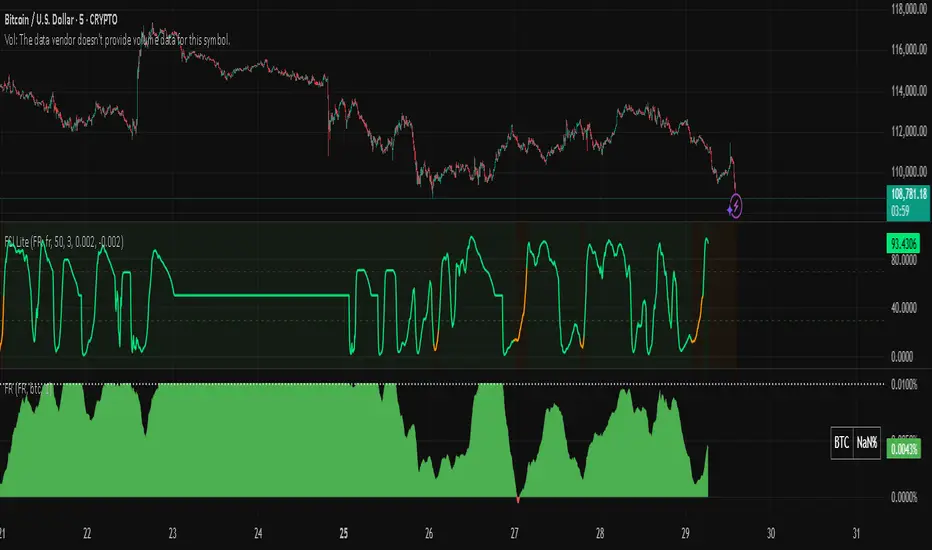
Snapfront Funding Stress IndexThe Funding Stress Index (FSI Lite) transforms raw funding rate data into a clear, intuitive stress gauge for crypto perpetual markets.
🔹 What it does:
Normalizes funding rates against their rolling baseline
Highlights extreme positive/negative funding as “stress zones”
Uses φ²-based coherence mapping for a sharper, sentiment-driven signal
Helps detect periods where traders are overpaying to stay long or short
🔹 How to use:
Add a Funding Rate feed (Bybit, Binance, OKX, etc.) to your chart.
Apply FSI Lite on top of it (Indicator on Indicator).
Watch stress levels as they enter:
🟢 High stress (positive funding) → longs paying shorts heavily, often overheated market.
🔴 Low stress (negative funding) → shorts paying longs, capitulation signals.
🟠 Neutral zone → balanced, less directional pressure.
🔹 Best for:
Identifying overheated long/short positioning
Timing entries around liquidation clusters
Adding funding context to your trading strategy
⚠️ Note: This is the Lite (free) version. It is educational only and not financial advice.
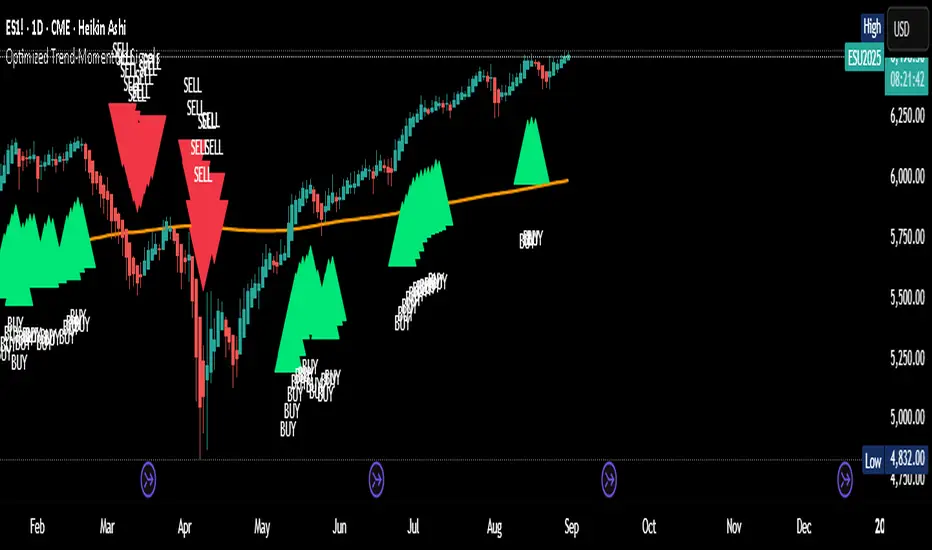
Optimized Trend-Momentum SignalsThis indicator combines trend, momentum, and volume-strength factors into a single buy/sell signal system. It integrates:
SMA 200 → Identifies the long-term trend (price above = bullish bias, below = bearish bias).
MACD (12,26,9) → Confirms momentum direction with line crossovers.
RSI (7) → Filters strength (above 50 = bullish, below 50 = bearish).
ROC (45) → Validates positive or negative rate of change.
Signal Logic:
Buy Signal → Price above SMA 200, MACD bullish, RSI > 50, and ROC > 0.
Sell Signal → Price below SMA 200, MACD bearish, RSI < 50, and ROC < 0.
Features:
Clear arrows for BUY and SELL signals.
Long-term SMA plotted for trend visualization.
Alerts built-in for real-time notifications.
This tool helps traders filter out noise and act only when all major confirmation factors align, reducing false signals and improving decision-making.
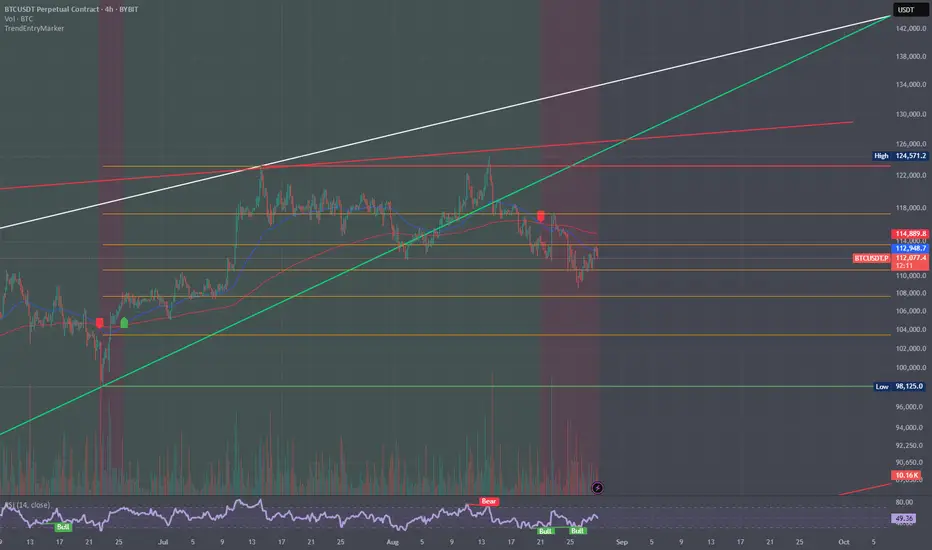
Trend and Entry Marker with MA, Supports, Fib, and Trend LinesJust a little indicator I made when I was bored ...
Helps you find entries for trades!