Technology Stocks RSPSTechnology Stocks RSPS Indicator - TradingView Description
Overview
The Technology Stocks RSPS (Relative Strength Portfolio System) indicator is a sophisticated portfolio allocation tool designed specifically for technology sector stocks. It calculates relative strength positions and provides dynamic allocation recommendations based on technical price momentum analysis.
Key Features
- Relative Strength Analysis: Compares 15 major technology stocks and the XLK sector ETF
against each other and gold as a baseline
- Dynamic Portfolio Allocation: Automatically calculates optimal position sizes based on relative
performance
- Visual Portfolio Performance: Tracks cumulative portfolio returns with color-coded
performance indicators
- Customizable Table Display: Shows real-time allocation percentages and optional cash values
for each position
- Technical Momentum Filtering: Uses normalized indicators to identify strength and filter out
weak positions
Included Assets
Sector ETF: XLK
Major Tech Stocks: AAPL, MSFT, NVDA, AVGO, CRM, ORCL, CSCO, ADBE, ACN, AMD, IBM, INTC, NOW, TXN
Benchmark: Gold (TVC:GOLD)
How It Works
The indicator calculates a relative strength score for each asset by comparing it against:
Gold (baseline commodity)
All other technology stocks in the pool
The XLK sector ETF
Assets with positive relative strength receive portfolio allocations proportional to their strength scores. Weak or negative performers are automatically filtered out (allocated 0%).
Visual Elements
Red Area: Aggregate strength of major technology stocks
Navy Blue Area: Overall technical positioning index (TPI)
Performance Line: Cumulative portfolio return (blue = cash-heavy, red = equity-heavy)
Allocation Table: Bottom-left display showing current recommended positions
Important Limitations
This indicator primarily uses technical data and has significant limitations:
❌ No fundamental economic data (ISM, CLI, etc.)
❌ Limited monetary data - missing critical components:
comprehensive monetary data
Funding rates
Detailed bond spreads analysis
Collateral data
❌ No sentiment indicators
❌ No options flow or derivatives data
❌ No earnings or valuation metrics
The indicator focuses purely on price-based relative strength and technical momentum. Users should combine this tool with fundamental analysis, economic data, and proper risk management for complete investment decisions.
Settings
Plot Table: Toggle allocation table visibility
Use Cash: Enable to display dollar amounts based on portfolio size
Cash Amount: Set your total portfolio value for cash allocation calculations
Use Cases
Sector rotation within technology stocks
Relative strength-based portfolio rebalancing
Technical momentum screening for tech sector
Dynamic position sizing based on price trends
Technical Notes
The script avoids for-loops to reduce calculation errors and noise
Uses semi-individual calculations for each asset
Requires the Unicorpus/NormalizedIndicators/1 library for normalized momentum calculations
Maximum lookback: 100 bars
Disclaimer: This indicator is a technical tool only and should not be used as the sole basis for investment decisions. It does not incorporate fundamental, economic, or comprehensive monetary data. Always conduct thorough research and consider your risk tolerance before making investment decisions.
Pengurusan portfolio


AbundanceThis tool is purpose-built for the Indian market landscape.
Tailored for dedicated long-term market participants, this indicator assists with investment decisions in both shares and ETFs. The script harnesses a blend of technical elements—Super Trend, RSI, multiple EMAs, and their dynamic relationships (for example, a 50 EMA positioned above 200 EMA indicates bullish momentum).
Through actionable notifications and buy cues on daily charts, the indicator supports anyone aiming to build a resilient portfolio. The indicator caters both high risk and risk averse investors.
Every mechanism is intended to deliver an actionable perspective, ensuring a comprehensive approach for those seeking effective capital growth.
Designed specifically for the daily timeframe , this indicator places buy signals as color-coded arrows exclusively on daily candles.
The tool functions as an all-inclusive solution for both stock and ETF investors, applying tailored accumulation logic to each asset category.
Some context of the Indicator used and what they imply:
• 50 EMA (Daily) – Measures intermediate trends
• 200 EMA (Daily) – Gauges long-term direction
• Daily timeframe – Identifies short-term movement
• Weekly timeframe – Assesses intermediate perspective
• Monthly timeframe – Reveals long-term context
ETF Module
ETF Selection Logic: The script implements explicit screening for ETFs, allowing users to operate with greater nuance through four unique accumulation intensity levels.
• Purple Arrow: Signals mild accumulation opportunities for aggressive dip-buyers—triggered when the 50 EMA is above the 200 EMA (i.e., uptrend), daily RSI drops below 40, the ETF price closes between the two EMAs, and weekly RSI remains above 50. If weekly RSI fails this threshold, signals are withheld to maintain trend integrity.
• Green Arrow: Indicates moderate accumulation, appearing in downtrends (200 EMA above 50 EMA) when daily RSI is in the oversold area and the price dips below 200 EMA.
• Blue Arrow: Represents strong accumulation. Both daily and weekly RSIs fall below 40 and the script’s close is under 200 EMA. Optimized for patient investors looking to accumulate during medium-term weakness.
• Red Arrow: Marks rare, very strong accumulation zones. RSIs across daily, weekly, and monthly timeframes must all read oversold with the price below 200 EMA, signifying potential long-term undervaluation but also substantial weakness. Patience is vital, as recovery may require extended periods.
Stock Module
Ideal for application on stocks within the Nifty 200—a universe proven through liquidity and market record. Stock accumulation signals come in two calibrated levels:
• Level 1 – Purple Arrow (early, mild accumulation): Suited for investors who have missed prior reversal zones or want additional entries in ongoing uptrends. Requires weekly and monthly RSI values above 50—i.e., no medium or long-term weakness. Accumulation signals occur when the stock trades below its 50 EMA but above its 200 EMA (with 50 EMA above 200 EMA indicating a healthy uptrend), and ADX reads below 22 (confirming the decline is not part of an accelerating downtrend).
• Level 2 – High conviction, Potential Reversal: Designed for risk-averse users, this level targets stocks that have corrected significantly and approach the 200 EMA on daily charts. Accumulation is triggered only when short-term downtrends reverse (Super Trend indicator shifts from red to green). Orange upward triangles serve as a preparatory signal for anticipated reversals, while green upward triangles mark confirmed buy events. If Super Trend returns to red after an alert but before a buy, the sequence is invalidated, limiting false signals.
All signals aim to provide precise market timing without exposing conservative investors to unnecessary risk.
Arrow colors are visually summarized on the right panel for constant reference for both ETFs and Stocks.

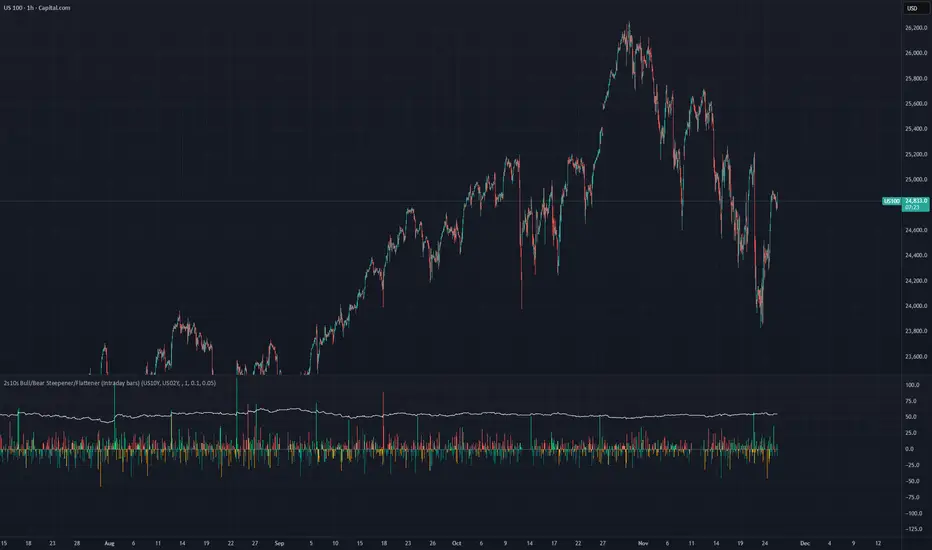
2s10s Bull/Bear Steepener/Flattener (Intraday bars)A simple indicator that tracks the curve of the US2y and US10y
Marcaj Ore 07:00 și 18:00 (Stabil v2)For backtesting and remember times that you can be active in the market.

Oracle Protocol — Arch Public (Testing Clone) Oracle Protocol — Arch Public Series (testing clone)
This model implements the Arch Public Oracle structure: a systematic accumulation-and-distribution engine built around a dynamic Accumulation Cost Base (ACB), strict profit-gate exit logic, and a capital-bounded flywheel reinvestment system.
It is designed for transparent execution, deterministic behaviour, and rule-based position management.
Core Function Set
1. Accumulation Framework (ACB-Driven)
The accumulation engine evaluates market movement against defined entry conditions, including:
Percentage-based entry-drop triggers
Optional buy-below-ACB mode
Capital-gated entries tied to available ledger balance
Fixed-dollar and min-dollar entry rules (as seen in Arch public materials)
Automated sizing through flywheel capital
Range-bounded ledger for controlled backtesting input
Each qualifying buy updates the live ACB, maintains the internal ledger, and forms the next reference point for exit evaluation.
No forecasting mechanisms are included.
2. Profit-Gate Exit System
Exits are governed by the standard Arch public approach:
A sealed ACB reference for threshold evaluation
Optional live-ACB visibility
Profit-gate triggers defined per asset class
Candle-confirmation integration (“ProfitGate + Candle” mode)
Distribution only when the smallest active threshold is met
This provides a consistent cadence with published Arch diagrams and PDFs.
3. Once-Per-Rally Governance
After a distribution, the algorithm locks until price retraces below the most recent accumulation base.
Only after re-arming can the next profit gate activate.
This prevents over-frequency selling and aligns with the public-domain Oracle behaviour.
4. Quiet-Bars & Threshold Cluster Control
A volatility-stabilisation layer prevents multiple exits from micro-fluctuations or transient spikes.
This ensures clean execution during fast markets and high volatility.
5. Flywheel Reinvestment
Distribution proceeds automatically return to the capital pool where permitted, creating a closed system of:
Entry sizing
Exit proceeds
Ledger-managed capital state
All sizing respects capital boundaries and does not breach dollar floors or overrides.
6. Automation Hooks and Integration
The script exposes:
3Commas-compatible JSON sizing
Entry/exit signalling via alertcondition()
Deterministic event reporting suitable for external automation
This allows consistent deployment across automated execution environments.
7. Visual Tooling
Optional displays include:
Live ACB line
Exit-guide markers
Capital, state, and ledger panels
Realized/unrealized outcome tracking based on internal logic only
Visual components do not influence execution rules.
Operating Notes
This model is rule-based, deterministic, and non-predictive.
It executes only according to the explicit thresholds, capital limits, and state transitions defined within the script.
No discretionary or forward-looking logic is included.

[GetSparx] Nova Pro⚡ Nova Pro – Position Calculator
This indicator is a user-friendly TradingView indicator designed to help traders plan and visualize their entry and exit points, calculate position sizing, and instantly display key risk metrics. By simply entering three price levels (Entry, Take Profit and Stop Loss) along with a risk amount in USD, the indicator draws color-coded lines and labels on the chart, and generates a concise table with all computed values. This allows you to assess the risk-reward profile of any trade at a glance, without performing manual calculations.
⚙️ How It Works
When the indicator is added to the chart it will ask to specify the price inputs and the risk amount in USD.
Price Inputs (Entry, TP, SL)
• You specify three price levels: the entry price, the profit target (Take Profit) and the loss threshold (Stop Loss).
• Inputs use TradingView’s native price-picker fields. Any change is immediately reflected on the chart.
Visual Display
• Each level is plotted as a line stretching into the future for enough room.
• Labels on the right show the exact price, color-coded: orange for Entry, green for TP and red for SL.
• Previous lines and labels are automatically removed when parameters change, ensuring the chart remains clean.
Risk Calculations
• The entered risk amount (in USD) is combined with the distance between Entry and SL to compute the optimal number of units (Qty) to trade.
• The script automatically detects whether it’s a long or short trade based on the relative positions of Entry and TP.
• Note that the risk and reward calculations do not factor in exchange fees, slippage, funding rates or any other trading costs. Actual profit and loss may differ once transaction fees and market execution variances are applied, so be sure to adjust your position sizing and expectations accordingly.
🎯 What You Can Do With It
• Consistent Position Sizing
Automate your position size so you consistently risk the same dollar amount, regardless of price volatility or stop distance.
• Clear Risk Management
Instantly view your Reward-to-Risk ratio, potential profit in USD and exact risk amount, so you make well-informed decisions.
• Rapid Scenario Analysis
Adjust TP, SL or Entry on the fly to see how each change affects your potential profit, loss and RR ratio.
• Publication-Ready Charts
The visual elements and integrated table are optimized for TradingView publications, giving your analysis a professional, polished look.
📊 Explanation of Table Values
• Entry
Calculation: rounded to the nearest tick of your entered entry price.
Marks the exact level at which you initiate the trade and serves as the reference point for all further risk and reward calculations.
• Quantity (Qty)
Calculation: Risk USD ÷ (Entry − Stop Loss).
Determines how many units, contracts or shares to trade so that a stop-out at your SL equals exactly your predefined dollar risk, resulting in consistent per-trade exposure.
• Risk to Reward (RR)
Calculation: (Take Profit − Entry) ÷ (Entry − Stop Loss).
Expresses how many dollars of potential profit you target for each dollar you risk. Values above 1 mean the reward exceeds the risk, guiding you to favorable setups.
• Take Profit (TP)
Calculation: rounded to the nearest tick of your entered take-profit price.
Your target exit level for booking gains, highlighted in green on the chart. Shows where you plan to capture profits if the market moves in your favor.
• Profit
Calculation: Qty × (Take Profit − Entry).
Gives the absolute potential gain in USD if price reaches your TP. Useful for comparing total return across different instruments or setups.
• Stop Loss (SL)
Calculation: rounded to the nearest tick of your entered stop-loss price.
The level at which your trade is automatically closed to cap losses, highlighted in red on the chart. Ensures you never lose more than your defined risk amount.
• Risk
Calculation: equals the entered Risk USD.
The maximum dollar amount you’re willing to lose on this trade. Acts as the upper boundary for your exposure, keeping your position sizing disciplined.
📝 Examples
• Long Example 1: Bitcoin/USD
Entry: $11851.1
Take Profit: $123853.9
Stop Loss: $115467.7
Risk USD: $500
The Risk to Reward ratio results in 2.25, which means the reward exceeds the risk.
For each dollar you risk, this setup has potential gains of 2.25 dollars.
• Long Example 2: Algorand/USD
Entry: $0.2919
Take Profit: $0.3491
Stop Loss: $0.2655
Risk USD: $1000
The Risk to Reward ratio on this trade results in 2.17 and has a potential profit target of $2166.67. With a risk of $1000 USD the table conveniently shows a quantity of 37878 ALGO is needed for the trade.
• Short Example 1: Forex EUR/USD
Entry: $1.16666
Take Profit: $1.15459
Stop Loss: $1.17374
Risk USD: $200
With a risk of $200 USD and a RR of 2.17, this example shows how a short trade can be accomplished on EUR/USD.
• Short Example 2: Gold
Entry: $3366.29
Take Profit: $3272.01
Stop Loss: $3386.87
Risk USD: $1500
Within this short setup a risk of $1500 USD is used, which results in a RR of 4.58. The potential profit for this trade is $6871.72.
⚠ Disclaimer
This tool is for educational and analytical use only. It does not provide financial advice or trading signals. Always use proper risk management and do your own due diligence.

BTST Stats BTST Statistical Edge Analyzer — VCR · Volume · SMA · RSI Filtered
This indicator isn’t a trading signal generator.
It’s a research framework designed to answer a simple but valuable question:
“Does Buy-Today-Sell-Tomorrow (BTST) have statistical edge under specific market conditions?”
Most traders assume BTST works because they feel markets gap.
This script measures whether that belief holds true — and under what filters.
🔍 What the Indicator Does
For each bar, the script simulates a BTST trade:
Entry: previous bar’s close
Exit: current bar’s open
Result: Open(next day) − Close(previous day)
But a BTST trade is only counted if the entry bar satisfies the filter logic.
🎯 Entry Filters You Can Tune
A trade is included only if ALL activated conditions are satisfied:
Filter Rule
VCR Filter Candle volatility ratio must exceed threshold: `(High−Low) /
Volume Filter Volume must be greater than n × AverageVolume
SMA Trend Filter (Optional) Close must be above a user-selected SMA length
RSI Condition (Optional) RSI must be between a user-defined min/max band
This allows testing BTST under different volatility, trend, and momentum conditions.
📊 What the Table Shows
For all qualifying trades inside the chosen lookback window, the indicator displays:
Metric Meaning
Profitable Trades Count of BTST trades with positive overnight return
Losing Trades Count of negative overnight returns
Avg Profit Average upside gain on winner trades
Avg Loss Average downside loss on losing trades
Avg Net per Trade Overall expectancy across all trades
Avg High After Entry Average maximum price movement above entry (potential upside)
Avg Low After Entry Average price movement against the entry (risk exposure)
Winner-Only High/Low Stats How far good trades move and how much heat they take
Loser-Only High/Low Stats How bad trades behave, including early fake-outs
Together, these reveal:
Opportunity potential
Risk exposure
Whether trades behave cleanly or chaotically
Whether exits are leaving money on the table
🧠 Why This Matters
BTST edges change drastically across:
Market regimes
Trend direction
Volatility clusters
Earnings cycles
Volume surges
This tool helps identify when BTST should be traded — and when it should be avoided entirely.
Rather than guessing, traders can:
Validate if their BTST assumptions hold,
Apply filters until the expectancy improves,
Rank symbols and conditions where the system performs best.
🚫 Not a Buy/Sell Indicator
This script does not place arrows, signals, alerts, or entries.
It exists for analysis and system development, not live execution.
Use it to:
Build ideas
Validate hypotheses
Compare symbols
Optimize BTST frameworks
Decide if BTST belongs in your playbook — or in the trash
🔧 Who This Is For
✔ System traders
✔ Quant-minded traders
✔ Options/Index traders who rely on gaps
✔ Swing traders testing overnight holds
✔ Developers building automated BTST logic
Final Thought
BTST isn’t magic — it’s just a behavior pattern.
Some markets reward it.
Some punish it.
Some reward it only under the right volatility and volume conditions.
This tool tells you which is which.

Stochastic Hash Strat [Hash Capital Research]# Stochastic Hash Strategy by Hash Capital Research
## 🎯 What Is This Strategy?
The **Stochastic Slow Strategy** is a momentum-based trading system that identifies oversold and overbought market conditions to capture mean-reversion opportunities. Think of it as a "buy low, sell high" approach with smart mathematical filters that remove emotion from your trading decisions.
Unlike fast-moving indicators that generate excessive noise, this strategy uses **smoothed stochastic oscillators** to identify only the highest-probability setups when momentum truly shifts.
---
## 💡 Why This Strategy Works
Most traders fail because they:
- **Chase prices** after big moves (buying high, selling low)
- **Overtrade** in choppy, directionless markets
- **Exit too early** or hold losses too long
This strategy solves all three problems:
1. **Entry Discipline**: Only trades when the stochastic oscillator crosses in extreme zones (oversold for longs, overbought for shorts)
2. **Cooldown Filter**: Prevents revenge trading by forcing a waiting period after each trade
3. **Fixed Risk/Reward**: Pre-defined stop-loss and take-profit levels ensure consistent risk management
**The Math Behind It**: The stochastic oscillator measures where the current price sits relative to its recent high-low range. When it's below 25, the market is oversold (time to buy). When above 70, it's overbought (time to sell). The crossover with its moving average confirms momentum is shifting.
---
## 📊 Best Markets & Timeframes
### ⭐ OPTIMAL PERFORMANCE:
**Crude Oil (WTI) - 12H Timeframe**
- **Why it works**: Oil markets have predictable volatility patterns and respect technical levels
**AAVE/USD - 4H to 12H Timeframe**
- **Why it works**: DeFi tokens exhibit strong momentum cycles with clear extremes
### ✅ Also Works Well On:
- **BTC/USD** (12H, Daily) - Lower frequency but high win rate
- **ETH/USD** (8H, 12H) - Balanced volatility and liquidity
- **Gold (XAU/USD)** (Daily) - Classic mean-reversion asset
- **EUR/USD** (4H, 8H) - Lower volatility, requires patience
### ❌ Avoid Using On:
- Timeframes below 4H (too much noise)
- Low-liquidity altcoins (wide spreads kill performance)
- Strongly trending markets without pullbacks (Bitcoin in 2021)
- News-driven instruments during major events
---
## 🎛️ Understanding The Settings
### Core Stochastic Parameters
**Stochastic Length (Default: 16)**
- Controls the lookback period for price comparison
- Lower = faster reactions, more signals (10-14 for volatile markets)
- Higher = smoother signals, fewer trades (16-21 for stable markets)
- **Pro tip**: Use 10 for crypto 4H, 16 for commodities 12H
**Overbought Level (Default: 70)**
- Threshold for short entries
- Lower values (65-70) = more trades, earlier entries
- Higher values (75-80) = fewer but higher-conviction trades
- **Sweet spot**: 70 works for most assets
**Oversold Level (Default: 25)**
- Threshold for long entries
- Higher values (25-30) = more trades, earlier entries
- Lower values (15-20) = fewer but stronger bounce setups
- **Sweet spot**: 20-25 depending on market conditions
**Smooth K & Smooth D (Default: 7 & 3)**
- Additional smoothing to filter out whipsaws
- K=7 makes the indicator slower and more reliable
- D=3 is the signal line that confirms the trend
- **Don't change these unless you know what you're doing**
---
### Risk Management
**Stop Loss % (Default: 2.2%)**
- Automatically exits losing trades
- Should be 1.5x to 2x your average market volatility
- Too tight = death by a thousand cuts
- Too wide = uncontrolled losses
- **Calibration**: Check ATR indicator and set SL slightly above it
**Take Profit % (Default: 7%)**
- Automatically exits winning trades
- Should be 2.5x to 3x your stop loss (reward-to-risk ratio)
- This default gives 7% / 2.2% = 3.18:1 R:R
- **The golden rule**: Never have R:R below 2:1
---
### Trade Filters
**Bar Cooldown Filter (Default: ON, 3 bars)**
- **What it does**: Forces you to wait X bars after closing a trade before entering a new one
- **Why it matters**: Prevents emotional revenge trading and overtrading in choppy markets
- **Settings guide**:
- 3 bars = Standard (good for most cases)
- 5-7 bars = Conservative (oil, slow-moving assets)
- 1-2 bars = Aggressive (only for experienced traders)
**Exit on Opposite Extreme (Default: ON)**
- Closes your long when stochastic hits overbought (and vice versa)
- Acts as an early profit-taking mechanism
- **Leave this ON** unless you're testing other exit strategies
**Divergence Filter (Default: OFF)**
- Looks for price/momentum divergences for additional confirmation
- **When to enable**: Trending markets where you want fewer but higher-quality trades
- **Keep OFF for**: Mean-reverting markets (oil, forex, most of the time)
---
## 🚀 Quick Start Guide
### Step 1: Set Up in TradingView
1. Open TradingView and navigate to your chart
2. Click "Pine Editor" at the bottom
3. Copy and paste the strategy code
4. Click "Add to Chart"
5. The strategy will appear in a separate pane below your price chart
### Step 2: Choose Your Market
**If you're trading Crude Oil:**
- Timeframe: 12H
- Keep all default settings
- Watch for signals during London/NY overlap (8am-11am EST)
**If you're trading AAVE or crypto:**
- Timeframe: 4H or 12H
- Consider these adjustments:
- Stochastic Length: 10-14 (faster)
- Oversold: 20 (more aggressive)
- Take Profit: 8-10% (higher targets)
### Step 3: Wait for Your First Signal
**LONG Entry** (Green circle appears):
- Stochastic crosses up below oversold level (25)
- Price likely near recent lows
- System places limit order at take profit and stop loss
**SHORT Entry** (Red circle appears):
- Stochastic crosses down above overbought level (70)
- Price likely near recent highs
- System places limit order at take profit and stop loss
**EXIT** (Orange circle):
- Position closes either at stop, target, or opposite extreme
- Cooldown period begins
### Step 4: Let It Run
The biggest mistake? **Interfering with the system.**
- Don't close trades early because you're scared
- Don't skip signals because you "have a feeling"
- Don't increase position size after a big win
- Don't revenge trade after a loss
**Follow the system or don't use it at all.**
---
### Important Risks:
1. **Drawdown Pain**: You WILL experience losing streaks of 5-7 trades. This is mathematically normal.
2. **Whipsaw Markets**: Choppy, range-bound conditions can trigger multiple small losses.
3. **Gap Risk**: Overnight gaps can cause your actual fill to be worse than the stop loss.
4. **Slippage**: Real execution prices differ from backtested prices (factor in 0.1-0.2% slippage).
---
## 🔧 Optimization Guide
### When to Adjust Settings:
**Market Volatility Increased?**
- Widen stop loss by 0.5-1%
- Increase take profit proportionally
- Consider increasing cooldown to 5-7 bars
**Getting Too Few Signals?**
- Decrease stochastic length to 10-12
- Increase oversold to 30, decrease overbought to 65
- Reduce cooldown to 2 bars
**Getting Too Many Losses?**
- Increase stochastic length to 18-21 (slower, smoother)
- Enable divergence filter
- Increase cooldown to 5+ bars
- Verify you're on the right timeframe
### A/B Testing Method:
1. **Run default settings for 50 trades** on your chosen market
2. Document: Win rate, profit factor, max drawdown, emotional tolerance
3. **Change ONE variable** (e.g., oversold from 25 to 20)
4. Run another 50 trades
5. Compare results
6. Keep the better version
**Never change multiple settings at once** or you won't know what worked.
---
## 📚 Educational Resources
### Key Concepts to Learn:
**Stochastic Oscillator**
- Developed by George Lane in the 1950s
- Measures momentum by comparing closing price to price range
- Formula: %K = (Close - Low) / (High - Low) × 100
- Similar to RSI but more sensitive to price movements
**Mean Reversion vs. Trend Following**
- This is a **mean reversion** strategy (price returns to average)
- Works best in ranging markets with defined support/resistance
- Fails in strong trending markets (2017 Bitcoin, 2020 Tech stocks)
- Complement with trend filters for better results
**Risk:Reward Ratio**
- The cornerstone of profitable trading
- Winning 40% of trades with 3:1 R:R = profitable
- Winning 60% of trades with 1:1 R:R = breakeven (after fees)
- **This strategy aims for 45% win rate with 2.5-3:1 R:R**
### Recommended Reading:
- *"Trading Systems and Methods"* by Perry Kaufman (Chapter on Oscillators)
- *"Mean Reversion Trading Systems"* by Howard Bandy
- *"The New Trading for a Living"* by Dr. Alexander Elder
---
## 🛠️ Troubleshooting
### "I'm not seeing any signals!"
**Check:**
- Is your timeframe 4H or higher?
- Is the stochastic actually reaching extreme levels (check if your asset is stuck in middle range)?
- Is cooldown still active from a previous trade?
- Are you on a low-liquidity pair?
**Solution**: Switch to a more volatile asset or lower the overbought/oversold thresholds.
---
### "The strategy keeps losing money!"
**Check:**
- What's your win rate? (Below 35% is concerning)
- What's your profit factor? (Below 0.8 means serious issues)
- Are you trading during major news events?
- Is the market in a strong trend?
**Solution**:
1. Verify you're using recommended markets/timeframes
2. Increase cooldown period to avoid choppy markets
3. Reduce position size to 5% while you diagnose
4. Consider switching to daily timeframe for less noise
---
### "My stop losses keep getting hit!"
**Check:**
- Is your stop loss tighter than the average ATR?
- Are you trading during high-volatility sessions?
- Is slippage eating into your buffer?
**Solution**:
1. Calculate the 14-period ATR
2. Set stop loss to 1.5x the ATR value
3. Avoid trading right after market open or major news
4. Factor in 0.2% slippage for crypto, 0.1% for oil
---
## 💪 Pro Tips from the Trenches
### Psychological Discipline
**The Three Deadly Sins:**
1. **Skipping signals** - "This one doesn't feel right"
2. **Early exits** - "I'll just take profit here to be safe"
3. **Revenge trading** - "I need to make back that loss NOW"
**The Solution:** Treat your strategy like a business system. Would McDonald's skip making fries because the cashier "doesn't feel like it today"? No. Systems work because of consistency.
---
### Position Management
**Scaling In/Out** (Advanced)
- Enter 50% position at signal
- Add 50% if stochastic reaches 10 (oversold) or 90 (overbought)
- Exit 50% at 1.5x take profit, let the rest run
**This is NOT for beginners.** Master the basic system first.
---
### Market Awareness
**Oil Traders:**
- OPEC meetings = volatility spikes (avoid or widen stops)
- US inventory reports (Wed 10:30am EST) = avoid trading 2 hours before/after
- Summer driving season = different patterns than winter
**Crypto Traders:**
- Monday-Tuesday = typically lower volatility (fewer signals)
- Thursday-Sunday = higher volatility (more signals)
- Avoid trading during exchange maintenance windows
---
## ⚖️ Legal Disclaimer
This trading strategy is provided for **educational purposes only**.
- Past performance does not guarantee future results
- Trading involves substantial risk of loss
- Only trade with capital you can afford to lose
- No one associated with this strategy is a licensed financial advisor
- You are solely responsible for your trading decisions
**By using this strategy, you acknowledge that you understand and accept these risks.**
---
## 🙏 Acknowledgments
Strategy development inspired by:
- George Lane's original Stochastic Oscillator work
- Modern quantitative trading research
- Community feedback from hundreds of backtests
Built with ❤️ for retail traders who want systematic, disciplined approaches to the markets.
---
**Good luck, stay disciplined, and trade the system, not your emotions.**

Macro Risk Trinity [OAS|VIX|MOVE]The Obsolescence of Single-Metric Risk Models
For decades, the CBOE VIX served as the undisputed "fear gauge" of Wall Street. However, the modern financial market structure has evolved to a point where relying on a single univariate indicator is not only insufficient but potentially dangerous. Two structural shifts have fundamentally altered the predictive power of the VIX:
The 0DTE Blind Spot: The VIX calculates implied volatility based on options expiring in 23 to 37 days. Today, massive institutional hedging flows occur intraday via 0DTE (Zero Days to Expiration) options. This creates a "Gamma Suppression" effect: Market makers hedging these short-term flows often dampen realized volatility intraday, effectively bypassing the VIX calculation window. This leads to a suppression of the index, masking risk even during fragile market phases (Bandi et al., 2023).
Goodhart’s Law: "When a measure becomes a target, it ceases to be a good measure." Because algorithmic volatility targeting strategies and risk-parity funds use the VIX as a mechanical trigger to deleverage, market participants have developed an incentive to suppress implied volatility via short-volatility strategies to prevent triggering cascading margin calls.
The Theoretical Framework: Why this Model Works
To accurately navigate this complex environment, the Macro Risk Trinity moves beyond simple price action. It employs a multivariate analysis of the financial system's three core pillars: Rates, Credit, and Equity. The logic is derived from three specific areas of financial research:
1. The Origin of Shock: Volatility Spillover Theory
Macroeconomic shocks typically do not start in the stock market; they originate in the US Treasury market. The MOVE Index acts as the "VIX for Bonds." Research by Choi et al. (2022) demonstrates that bond variance risk premiums are a leading indicator for equity distress. Since the "Risk-Free Rate" is the denominator in every Discounted Cash Flow (DCF) model, instability here forces a repricing of all risk assets downstream.
2. The Foundation: Structural Credit Models (Merton)
While stock prices are often driven by sentiment and liquidity, corporate bond spreads ( High Yield Option Adjusted Spread ) are driven by balance sheets and math. Based on the seminal Merton Model (1974), equity can be viewed as a call option on a firm's assets, while debt carries a short put option risk.
The Thesis: If the VIX (Equity) is low, but OAS (Credit) is widening, a divergence occurs. Mathematically, credit spreads cannot widen indefinitely without eventually pulling equity valuations down. This indicator identifies that specific divergence.
3. The Fragility: Knightian Uncertainty
By monitoring the VVIX (Volatility of Volatility), we detect demand for tail-risk protection. When the VIX is suppressed (low) but VVIX is rising, it signals that "Smart Money" is buying Out-of-the-Money crash protection despite calm waters. This is often a precursor to liquidity events where the VIX "uncoils" violently.
The Solution: Dual Z-Score Normalization
You cannot simply overlay the VIX (an index) with a Credit Spread (a percentage). To make them comparable, this script utilizes a Dual Z-Score Engine.
It calculates the statistical deviation from both a Fast (Quarterly/63-day) and a Slow (Yearly/252-day) mean. This standardizes all data into a single "Stress Unit," allowing us to see exactly when Credit Stress exceeds Equity Fear.
Decoding the Macro Regimes
The indicator aggregates these data streams to visualize the current market regime via the chart's background color:
Systemic Shock (Red Background): The critical convergence. Both Credit Spreads (Solvency) and Equity Volatility (Fear) spike simultaneously beyond extreme statistical thresholds (> 2.0 Sigma). Correlations approach 1, and liquidity evaporates.
Macro Risk / Rates Shock (Yellow Background): Equities are calm, but the MOVE Index is panicking. A warning signal from the plumbing of the financial system regarding inflation or Fed policy errors.
Credit Stress (Maroon Background): The "Silent Killer." The VIX is low (often suppressed), but Credit Spreads (OAS) are widening. This signals a deterioration of the real economy ("Slow Bleed") while the stock market is in denial.
Structural Fragility (Purple Background): VIX is low, but VVIX is rising. A sign of excessive leverage and "Volmageddon" risk (Gamma Squeeze).
Bull Cycle (Green Background): The "Buy the Dip" signal. Even if prices fall and VIX spikes, the background remains green as long as Corporate Credit (OAS) remains stable. This indicates the sell-off is technical, not fundamental.
Technical Specifications
Engineered for the Daily (1D) timeframe.
Institutional Lookbacks: 63 Days (Quarterly) / 252 Days (Yearly).
OAS Lag Buffer: Includes logic to handle the ~24h reporting delay of Federal Reserve (FRED) data to prevent signal flickering.
Scientific Bibliography
This tool is not based on heuristics but on peer-reviewed financial literature:
Bandi, F. M., et al. (2023). The spectral properties of 0DTE options and their impact on VIX. Journal of Econometrics.
Choi, J., Mueller, P., & Vedolin, A. (2022). Bond Variance Risk Premiums. Review of Finance.
Cremers, M., et al. (2008). Explaining the Level and Time-Variation of Credit Spreads. Review of Financial Studies.
Griffin, J. M., & Shams, A. (2018). Manipulation in the VIX? The Review of Financial Studies.
Merton, R. C. (1974). On the Pricing of Corporate Debt. The Journal of Finance.
Author's Note: The Reality of Markets & Overfitting
While this tool is built on robust academic principles, we must address the reality of quantitative modeling: There is no Holy Grail.
This indicator relies on Z-Scores, which assume that future volatility distributions will somewhat resemble the past (Mean Reversion). In data science, calibrating lookback periods (like 63/252 days) always carries a risk of Overfitting to past cycles.
Markets are adaptive systems. If the correlation between Credit Spreads and Equity Volatility breaks (e.g., due to massive fiscal intervention/QE or new derivative products), signals may temporarily diverge. This tool is designed to identify stress, not to predict the future price. It will rhyme with the market, but it will not always repeat it perfectly.
Use it as a compass to gauge the environment, not as an autopilot for your trading.
Use responsibly and always manage your risk.
Disclaimer: This indicator relies on external data feeds from FRED and CBOE. Data availability is subject to TradingView providers.

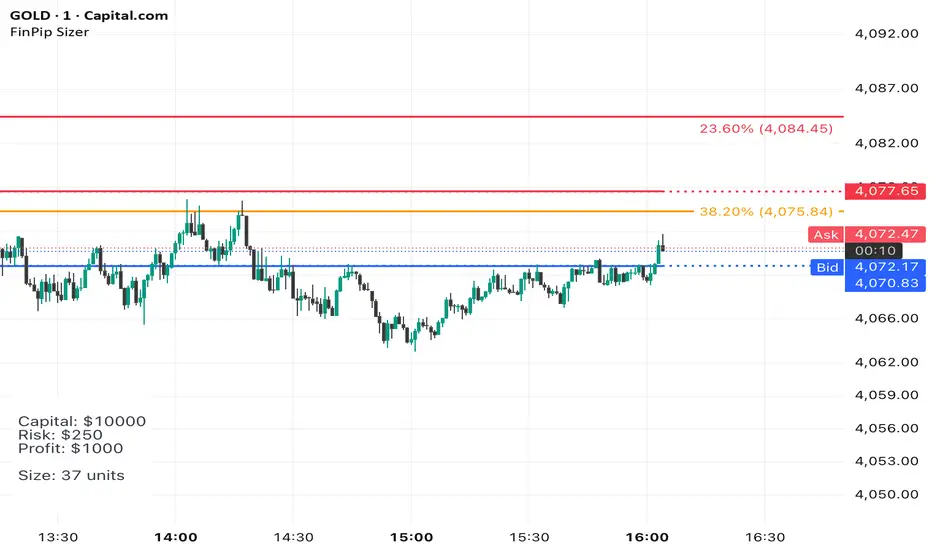
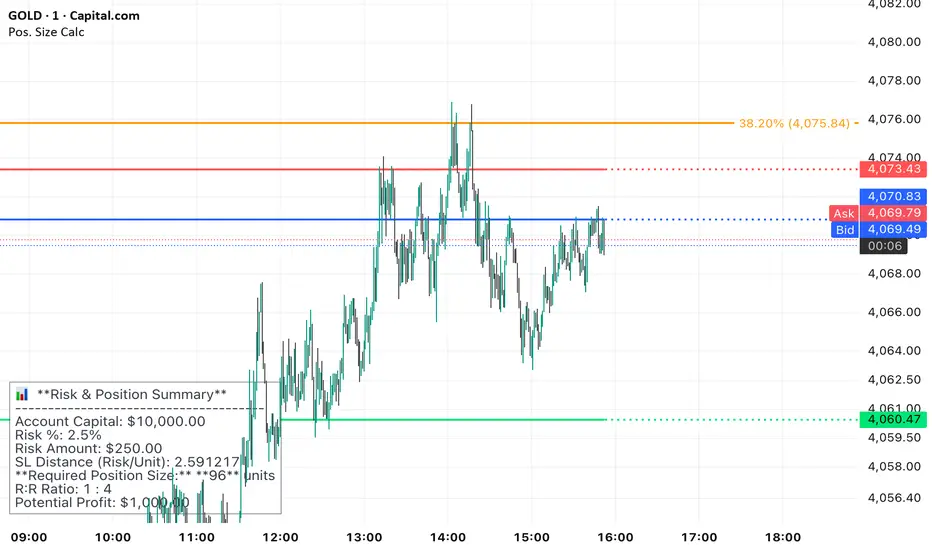
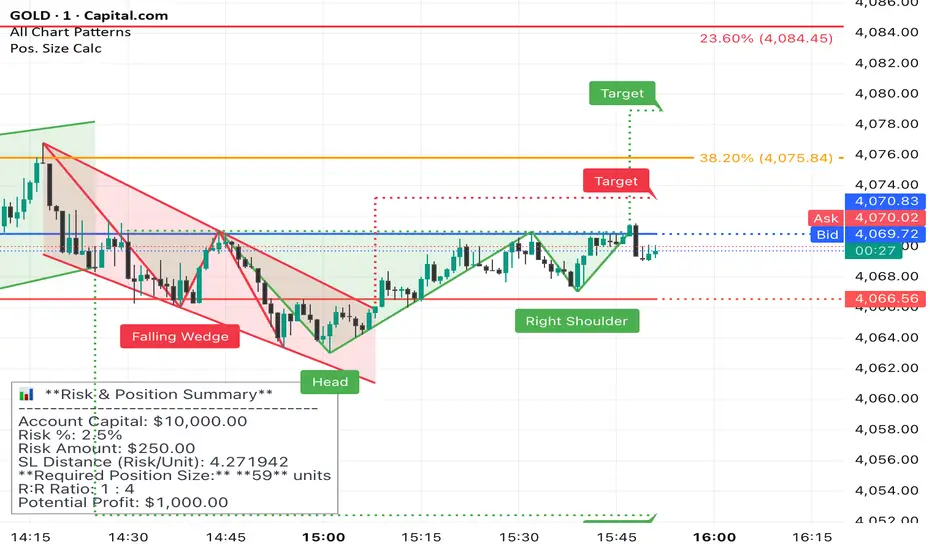
Position Sizer (FinPip)Position Sizer (FinPip)
The Position Sizer (FinPip) indicator is a crucial, all-in-one risk management tool designed to calculate the precise trade size required to limit your risk to a predetermined percentage of your total account capital.
This indicator helps you consistently execute sound risk management, regardless of the instrument's volatility or the trade's price levels.
Key Features:
Calculates Position Size: Based on your configurable Account Capital, desired Risk Percentage (default 2.5%), and the price distance between your Entry and Stop-Loss levels.
Visual Trade Planning: Plots three clear levels directly on the chart for easy visualization:
Entry Price (Blue)
Stop-Loss Price (SL) (Red)
Profit Target (Lime Green, calculated using the Reward:Risk Ratio).
Custom Risk Management: Easily adjust the Risk Percentage and the Reward:Risk Ratio (default 4.0) in the indicator's settings.
Heads-Up Display (HUD): A clean, fixed table in the bottom-left corner of the chart clearly displays all calculated metrics, including your Required Position Size (in units/shares/contracts), Risk Amount, and Potential Profit.
How to Use:
Enter your Account Capital and desired Risk % in the settings panel.
Set your desired Entry Price and Stop-Loss Price.
The indicator immediately calculates and displays the exact number of units you need to trade to maintain your risk limit.
The Position Sizer (FinPip)The Position Sizer (FinPip) indicator is a crucial, all-in-one risk management tool designed to calculate the precise trade size required to limit your risk to a predetermined percentage of your total account capital.
This indicator helps you consistently execute sound risk management, regardless of the instrument's volatility or the trade's price levels.
Key Features:
Calculates Position Size: Based on your configurable Account Capital, desired Risk Percentage (default 2.5%), and the price distance between your Entry and Stop-Loss levels.
Visual Trade Planning: Plots three clear levels directly on the chart for easy visualization:
Entry Price (Blue)
Stop-Loss Price (SL) (Red)
Profit Target (Lime Green, calculated using the Reward:Risk Ratio).
Custom Risk Management: Easily adjust the Risk Percentage and the Reward:Risk Ratio (default 4.0) in the indicator's settings.
Heads-Up Display (HUD): A clean, fixed table in the bottom-left corner of the chart clearly displays all calculated metrics, including your Required Position Size (in units/shares/contracts), Risk Amount, and Potential Profit.
How to Use:
Enter your Account Capital and desired Risk % in the settings panel.
Set your desired Entry Price and Stop-Loss Price.
The indicator immediately calculates and displays the exact number of units you need to trade to maintain your risk limit.
Position Sizer (FinPip)The Position Sizer (FinPip) indicator is a crucial, all-in-one risk management tool designed to calculate the precise trade size required to limit your risk to a predetermined percentage of your total account capital.
This indicator helps you consistently execute sound risk management, regardless of the instrument's volatility or the trade's price levels.
Key Features:
Calculates Position Size: Based on your configurable Account Capital, desired Risk Percentage (default 2.5%), and the price distance between your Entry and Stop-Loss levels.
Visual Trade Planning: Plots three clear levels directly on the chart for easy visualization:
Entry Price (Blue)
Stop-Loss Price (SL) (Red)
Profit Target (Lime Green, calculated using the Reward:Risk Ratio).
Custom Risk Management: Easily adjust the Risk Percentage and the Reward:Risk Ratio (default 4.0) in the indicator's settings.
Heads-Up Display (HUD): A clean, fixed table in the bottom-left corner of the chart clearly displays all calculated metrics, including your Required Position Size (in units/shares/contracts), Risk Amount, and Potential Profit.
How to Use:
Enter your Account Capital and desired Risk % in the settings panel.
Set your desired Entry Price and Stop-Loss Price.
The indicator immediately calculates and displays the exact number of units you need to trade to maintain your risk limit.
Hash Supertrend [Hash Capital Research]Hash Supertrend Strategy by Hash Capital Research
Overview
Hash Supertrend is a professional-grade trend-following strategy that combines the proven Supertrend indicator with institutional visual design and flexible time filtering.
The strategy uses ATR-based volatility bands to identify trend direction and executes position reversals when the trend flips.This implementation features a distinctive fluorescent color system with customizable glow effects, making trend changes immediately visible while maintaining the clean, professional aesthetic expected in quantitative trading environments.
Entry Signals:
Long Entry: Price crosses above the Supertrend line (trend flips bullish)
Short Entry: Price crosses below the Supertrend line (trend flips bearish)
Controls the lookback period for volatility calculation
Lower values (7-10): More sensitive to price changes, generates more signals
Higher values (12-14): Smoother response, fewer signals but potentially delayed entries
Recommended range: 7-14 depending on market volatility
Factor (Default: 3.0)
Restricts trading to specific hours
Useful for avoiding low-liquidity sessions, overnight gaps, or known choppy periods
When disabled, strategy trades 24/7
Start Hour (Default: 9) & Start Minute (Default: 30)
Define when the trading session begins
Uses exchange timezone in 24-hour format
Example: 9:30 = 9:30 AM
End Hour (Default: 16) & End Minute (Default: 0)
Controls the vibrancy of the fluorescent color system
1-3: Subtle, muted colors
4-6: Balanced, moderate saturation
7-10: Bright, highly saturated fluorescent appearance
Affects both the Supertrend line and trend zones
Glow Effect (Default: On)
Adds luminous halo around the Supertrend line
Creates a multi-layered visual with depth
Particularly effective during strong trends
Glow Intensity (Default: 5.0)
Displays tiny fluorescent dots at entry points
Green dot below bar: Long entry
Red dot above bar: Short entry
Provides clear visual confirmation of executed trades
Show Trend Zone (Default: On)
Strong trending markets (2020-style bull runs, sustained bear markets)
Markets with clear directional bias
Instruments with consistent volatility patterns
Timeframes: 15m to Daily (optimal on 1H-4H)
Challenging Conditions:
Choppy, range-bound markets
Low volatility consolidation periods
Highly news-driven instruments with frequent gaps
Very low timeframes (1m-5m) prone to noise
Recommended AssetsCryptocurrency:

GVI-1 - Guendogan Valuation Index 1The Guendogan Valuation Index 1 (GVI-1) incorporates the total market capitalization of all U.S. companies, U.S. GDP, and the share of revenues generated outside the United States to provide an undistorted long-term valuation of the U.S. equity market across the past decades.
Disclaimer: The Guendogan Valuation Index 1 (GVI-1) is a research-based macro indicator provided solely for educational and informational purposes. It does not constitute financial advice, investment advice, trading advice, or a recommendation to buy or sell any asset. Financial markets involve risk, and past performance does not guarantee future results. All users are solely responsible for their own investment decisions.

GVI – Guendogan Valuation IndexGlobalization-adjusted valuation indicator modeling rising international revenue exposure since 1990. Includes a long-term fair-value framework.

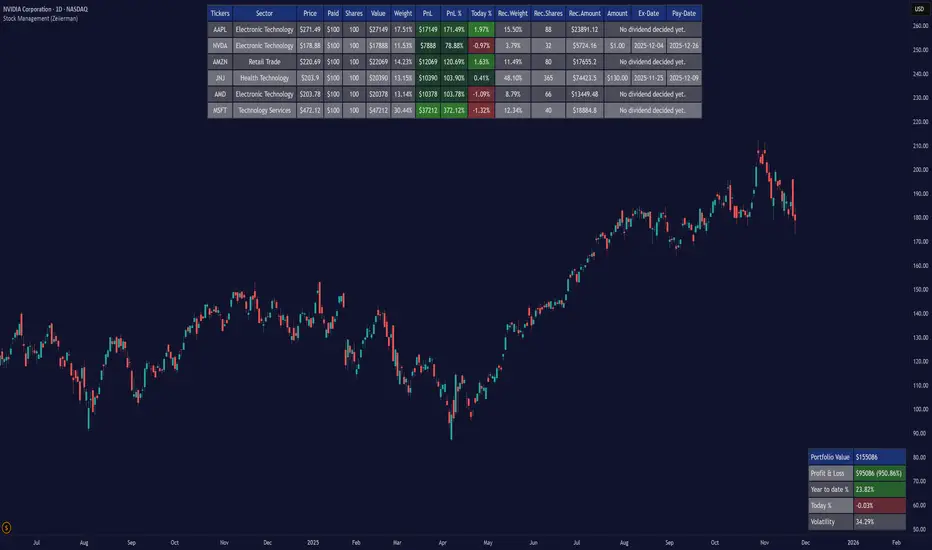
Stock Management (Zeiierman)█ Overview
Stock Management (Zeiierman) gives investors a complete, real-time view of their portfolio directly inside TradingView. It tracks performance, allocation, volatility, and dividends in one unified interface, making it easy to understand both how your portfolio is performing and how it behaves in terms of risk and exposure.
Rather than analyzing each chart in isolation, Stock Management (Zeiierman) turns TradingView into a lightweight portfolio cockpit. You can define up to 20 stock positions (ticker, shares, average cost), and the tool will:
Normalize all positions into a single user-selected currency
Calculate live position value, PnL, PnL%, and daily movement
Compute total portfolio value, performance, and volatility
Optionally generate a risk-parity style Recommended Allocation
Display upcoming dividend amounts, ex-dates, and pay-dates for your holdings
All of this appears as clean on-chart tables, including a main portfolio table, an optional dividend table, and an optional summary panel, allowing you to manage your portfolio while still watching price action. It is a visual portfolio layer built entirely around your own inputs, integrated seamlessly into the TradingView environment.
⚪ Why This One Is Unique
Most investors rely on basic broker dashboards that show position values but provide little insight into risk, exposure, or how each holding interacts with the rest of the portfolio. Stock Management (Zeiierman) goes far beyond that by building an intelligent, unified portfolio layer directly inside TradingView.
It automatically normalizes global holdings into a single reporting currency using live FX data, stabilizes allocation with a volatility-aware weighting engine, and structures your information through an adaptive column framework that highlights performance and risk in real time. A weighted summary blends portfolio movement, volatility, and long-horizon behavior into a clean snapshot, while dividend schedules and projected payouts are fully integrated into the same interface.
█ Main Features
⚪ 1. Portfolio Tracker
The core of Stock Management (Zeiierman) is a dynamic, real-time portfolio table that brings all key position data into one intelligent view. Each holding is displayed with:
Ticker
Sector
Price
Average Paid Price
Shares
Position Value
Position Weight
Profit & Loss
Profit & Loss %
Today % Change
Recommended Allocation
The table updates continuously with market prices, giving investors an immediate understanding of performance, exposure, and risk across all positions.
⚪ 2. Dividend Information
Dividend data for your holdings is automatically fetched, organized, and presented alongside your positions. This includes dividend amount, ex-date, and pay-date, along with projected payouts based on your share count. All dividend-related information is integrated directly into the portfolio view, so you can plan cash flow without switching tools.
⚪ 3. Portfolio Summary
A dedicated summary panel consolidates the entire portfolio into a single snapshot: total value, total PnL, YTD %, today’s change, and overall volatility. The volatility reading is particularly valuable, providing a quick gauge of your portfolio’s risk level and how sensitive it may be to market movement.
⚪ 4. Portfolio Weight Recommendation
An intelligent weighting engine reviews your current allocations and highlights where your portfolio is overexposed or underweighted. It offers recommended allocation levels designed to reduce concentration risk and improve balance, giving you a clearer path toward a more stable long-term positioning.
█ How to Use
⚪ Performance Tracking
Quickly assess your entire portfolio’s profit, loss, daily movement, and volatility from one centralized dashboard. The summary panel gives you an instant read on how your holdings are performing and how sensitive they are to market swings.
⚪ Dividend Management
Monitor upcoming dividend amounts, ex-dates, and pay-dates directly inside your portfolio table. This ensures you never miss a payout opportunity and can plan your expected cash flow with complete clarity.
⚪ Risk Management & Optimization
Use portfolio-wide volatility and the intelligent Recommended Allocation engine to identify imbalances in your holdings. These insights help you adjust position sizes, reduce concentration risk, and maintain a more stable long-term portfolio profile.
⚪ Currency Comparison
Switch between different base currencies to evaluate performance in local or international terms. All positions are automatically normalized using live FX data, making global portfolio management effortless.
█ How It Works
Stock Management (Zeiierman) continuously gathers price, currency, dividend, and volatility data for every ticker you track. All values are automatically converted into your selected reporting currency, so global holdings remain comparable in one unified view.
It builds a live portfolio snapshot of each bar, updating position values, PnL, daily returns, YTD performance, and overall volatility. This gives you an always-current understanding of how your portfolio is performing and how each holding contributes to risk and exposure.
An intelligent, volatility-aware allocation model generates recommended portfolio weights and position sizes, helping you identify where you may be overexposed or underweighted. Dividend information is integrated directly into the table, projecting future payouts and highlighting upcoming ex-dates and pay-dates.
-----------------
Disclaimer
The content provided in my scripts, indicators, ideas, algorithms, and systems is for educational and informational purposes only. It does not constitute financial advice, investment recommendations, or a solicitation to buy or sell any financial instruments. I will not accept liability for any loss or damage, including without limitation any loss of profit, which may arise directly or indirectly from the use of or reliance on such information.
All investments involve risk, and the past performance of a security, industry, sector, market, financial product, trading strategy, backtest, or individual's trading does not guarantee future results or returns. Investors are fully responsible for any investment decisions they make. Such decisions should be based solely on an evaluation of their financial circumstances, investment objectives, risk tolerance, and liquidity needs.
Kill Zone GridCaca Poo-Poo Kill Zone (12pm–4pm) — Avoid the Death Hours
This indicator highlights the worst trading window of the day — the midday chop zone where liquidity dies, algo volume disappears, spreads widen, and your account slowly bleeds out from boredom and paper cuts.
From 12pm to 4pm (New York Time) the script:
• Shades the background with a bold kill-zone color
• Adds red gridline stripes to visually scream “STOP TRADING, YOU DONKEY”
• Makes the entire chart look hostile so you avoid revenge trading, boredom trading, and all forms of midday stupidity
Perfect for scalpers and trend traders who only want the clean morning moves and want a visual reminder to step away, go outside, touch grass, eat lunch, or hit the gym instead of forcing trades in garbage hours.
If you trade futures, options, or zero-day anything — this script will save you money, sanity, and years off your life.

Mini Checklist (Left-side, static)It's a mini checklist on the left side of the chart serving as a note for when you trade.
Pretty simple

ATH대비 지정하락률에 도착 시 매수 - 장기홀딩 선물 전략(ATH Drawdown Re-Buy Long Only)본 스크립트는 과거 하락 데이터를 이용하여, 정해진 하락 %가 발생하는 경우 자기 자본의 정해진 %만큼을 진입하게 설계되어진 스트레티지입니다.
레버리지를 사용할 수 있으며 기본적으로 셋팅해둔 값이 내장되어있습니다.(자유롭게 바꿔서 쓰시면 됩니다.) 추가적으로 2번의 진입 외에도 다른 진입 기준, 진입 %를 설정하실 수 있으며 - ChatGPT에게 요청하면 수정해줄 것입니다.
실제 사용용도로는 KillSwitch 기능을 꺼주세요. 바 돋보기 기능을 켜주세요.
ATH Drawdown Re-Buy Long Only 전략 설명
1. 전략 개요
ATH Drawdown Re-Buy Long Only 전략은 자산의 역대 최고가(ATH, All-Time High)를 기준으로 한 하락폭(드로우다운)을 활용하여,
특정 구간마다 단계적으로 롱 포지션을 구축하는 자동 재매수(Long Only) 전략입니다.
본 전략은 다음과 같은 목적을 가지고 설계되었습니다.
급격한 조정 구간에서 체계적인 분할 매수 및 레버리지 활용
ATH를 기준으로 한 명확한 진입 규칙 제공
실시간으로
평단가
레버리지
청산가 추정
계좌 MDD
수익률
등을 시각적으로 제공하여 리스크와 포지션 상태를 직관적으로 확인할 수 있도록 지원
※ 본 전략은 교육·연구·백테스트 용도로 제공되며,
어떠한 형태의 투자 권유 또는 수익을 보장하지 않습니다.
2. 전략의 핵심 개념
2-1. ATH(역대 최고가) 기준 드로우다운
전략은 차트 상에서 항상 가장 높은 고가(High)를 ATH로 기록합니다.
새로운 고점이 형성될 때마다 ATH를 갱신하고, 해당 ATH를 기준으로 다음을 계산합니다.
현재 바의 저가(Low)가 ATH에서 몇 % 하락했는지
현재 바의 종가(Close)가 ATH에서 몇 % 하락했는지
그리고 사전에 설정한 두 개의 드로우다운 구간에서 매수를 수행합니다.
1차 진입 구간: ATH 대비 X% 하락 시
2차 진입 구간: ATH 대비 Y% 하락 시
각 구간은 ATH가 새로 갱신될 때마다 한 번씩만 작동하며,
새로운 ATH가 생성되면 다시 “1차 / 2차 진입 가능 상태”로 초기화됩니다.
2-2. 첫 포지션 100% / 300% 특수 규칙
이 전략의 중요한 특징은 **“첫 포지션 진입 시의 예외 규칙”**입니다.
전략이 현재 어떠한 포지션도 들고 있지 않은 상태에서
최초로 롱 포지션을 진입하는 시점(첫 포지션)에 대해:
기본적으로는 **자산의 100%**를 기준으로 포지션을 구축하지만,
만약 그 순간의 가격이 ATH 대비 설정값 이상(예: 약 –72.5% 이상 하락한 상황) 이라면
→ 자산의 300% 규모로 첫 포지션을 진입하도록 설계되어 있습니다.
이 규칙은 다음과 같이 동작합니다.
첫 진입이 1차 드로우다운 구간에서 발생하든,
첫 진입이 2차 드로우다운 구간에서 발생하든,
현재 하락폭이 설정된 기준 이상(예: –72.5% 이상) 이라면
→ “이 정도 하락이면 첫 진입부터 더 공격적으로 들어간다”는 의미로 300% 규모로 진입
그 이하의 하락폭이라면
→ 첫 진입은 100% 규모로 제한
즉, 전략은 다음 두 가지 모드로 동작합니다.
일반적인 상황의 첫 진입: 자산의 100%
심각한 드로우다운 구간에서의 첫 진입: 자산의 300%
이 특수 규칙은 깊은 하락에서는 공격적으로, 평소에는 상대적으로 보수적으로 진입하도록 설계된 것입니다.
3. 전략 동작 구조
3-1. 매수 조건
차트 상 High 기준으로 ATH를 추적합니다.
각 바마다 해당 ATH에서의 하락률을 계산합니다.
사용자가 설정한 두 개의 드로우다운 구간(예시):
1차 구간: 예를 들어 ATH – 50%
2차 구간: 예를 들어 ATH – 72.5%
각 구간에 대해 다음과 같은 조건을 확인합니다.
“이번 ATH 구간에서 아직 해당 구간 매수를 한 적이 없는 상태”이고,
현재 바의 저가(Low)가 해당 구간 가격 이하를 찍는 순간
→ 해당 바에서 매수 조건 충족으로 간주
실제 주문은:
해당 구간 가격에 맞춰 롱 포지션 진입(리밋/시장가 기반 시뮬레이션) 으로 처리됩니다.
3-2. ATH 갱신과 진입 기회 리셋
차트 상에서 새로운 고점(High)이 기존 ATH를 넘어서는 순간,
ATH가 갱신되고,
1차 / 2차 진입 여부를 나타내는 내부 플래그가 초기화됩니다.
이를 통해, 시장이 새로운 고점을 돌파해 나갈 때마다,
해당 구간에서 다시 한 번씩 1차·2차 드로우다운 진입 기회를 갖게 됩니다.
4. 포지션 사이징 및 레버리지
4-1. 계좌 자산(Equity) 기준 포지션 크기 결정
전략은 현재 계좌 자산을 다음과 같이 정의하여 사용합니다.
현재 자산 = 초기 자본 + 실현 손익 + 미실현 손익
각 진입 구간에서의 포지션 가치는 다음과 같이 결정됩니다.
1차 진입 구간:
“자산의 몇 %를 사용할지”를 설정값으로 입력
설정된 퍼센트를 계좌 자산에 곱한 뒤,
다시 전략 내 레버리지 배수(Leverage) 를 곱하여 실제 포지션 가치를 계산
2차 진입 구간:
동일한 방식으로, 독립된 퍼센트 설정값을 사용
즉, 포지션 가치는 다음과 같이 계산됩니다.
포지션 가치 = 현재 자산 × (해당 구간 설정 % / 100) × 레버리지 배수
그리고 이를 해당 구간의 진입 가격으로 나누어 실제 수량(토큰 단위) 를 산출합니다.
4-2. 첫 포지션의 예외 처리 (100% / 300%)
첫 포지션에 대해서는 위의 일반적인 퍼센트 설정 대신,
다음과 같은 고정 비율이 사용됩니다.
기본: 자산의 100% 규모로 첫 포지션 진입
단, 진입 시점의 ATH 대비 하락률이 설정값 이상(예: –72.5% 이상) 일 경우
→ 자산의 300% 규모로 첫 포지션 진입
이때 역시 다음 공식을 사용합니다.
포지션 가치 = 현재 자산 × (100% 또는 300%) × 레버리지
그리고 이를 가격으로 나누어 실제 진입 수량을 계산합니다.
이 규칙은:
첫 진입이 1차 구간이든 2차 구간이든 동일하게 적용되며,
“충분히 깊은 하락 구간에서는 첫 진입부터 더 크게,
평소에는 비교적 보수적으로” 라는 운용 철학을 반영합니다.
4-3. 실레버리지(Real Leverage)의 추적
전략은 각 바 단위로 다음을 추적합니다.
바가 시작할 때의 기존 포지션 크기
해당 바에서 새로 진입한 수량
이를 바탕으로, 진입이 발생한 시점에 다음을 계산합니다.
실제 레버리지 = (포지션 가치 / 현재 자산)
그리고 차트 상에 예를 들어:
Lev 2.53x 와 같은 형식의 레이블로 표시합니다.
이를 통해, 매수 시점마다 실제 계좌 레버리지가 어느 정도였는지를 직관적으로 확인할 수 있습니다.
5. 시각화 및 모니터링 요소
5-1. 차트 상 시각 요소
전략은 차트 위에 다음과 같은 정보를 직접 표시합니다.
ATH 라인
High 기준으로 계산된 역대 최고가를 주황색 선으로 표시
평단가(평균 진입가) 라인
현재 보유 포지션이 있을 때,
해당 포지션의 평균 진입가를 노란색 선으로 표시
추정 청산가(고정형 청산가) 라인
포지션 수량이 변화하는 시점을 감지하여,
당시의 평단가와 실제 레버리지를 이용해 근사적인 청산가를 계산
이를 빨간색 선으로 차트에 고정 표시
포지션이 없거나 레버리지가 1배 이하인 경우에는 청산가 라인을 제거
매수 마커 및 레이블
1차/2차 매수 조건이 충족될 때마다 해당 지점에 매수 마커를 표시
"Buy XX% @ 가격", "Lev XXx" 형태의 라벨로
진입 비율과 당시 레버리지를 함께 시각화
레이블의 위치는 설정에서 선택 가능:
바 아래 (Below Bar)
바 위 (Above Bar)
실제 가격 위치 (At Price)
5-2. 우측 상단 정보 테이블
차트 우측 상단에는 현재 계좌·포지션 상태를 요약한 정보 테이블이 표시됩니다.
대표적으로 다음 항목들이 포함됩니다.
Pos Qty (Token)
현재 보유 중인 포지션 수량(토큰 기준, 절대값 기준)
Pos Value (USDT)
현재 포지션의 시장 가치 (수량 × 현재 가격)
Leverage (Now)
현재 실레버리지 (포지션 가치 / 현재 자산)
DD from ATH (%)
현재 가격 기준, 최근 ATH에서의 하락률(%)
Avg Entry
현재 포지션의 평균 진입 가격
PnL (%)
현재 포지션 기준 미실현 손익률(%)
Max DD (Equity %)
전략 전체 기간 동안 기록된 계좌 기준 최대 손실(MDD, Max Drawdown)
Last Entry Price
가장 최근에 포지션을 추가로 진입한 직후의 평균 진입 가격
Last Entry Lev
위 “Last Entry Price” 시점에서의 실레버리지
Liq Price (Fixed)
위에서 설명한 고정형 추정 청산가
Return from Start (%)
전략 시작 시점(초기 자본) 대비 현재 계좌 자산의 총 수익률(%)
이 테이블을 통해 사용자는:
현재 계좌와 포지션의 상태
리스크 수준
누적 성과
를 직관적으로 파악할 수 있습니다.
6. 시간 필터 및 라벨 옵션
6-1. 전략 동작 기간 설정
전략은 옵션으로 특정 기간에만 전략을 동작시키는 시간 필터를 제공합니다.
“Use Date Range” 옵션을 활성화하면:
시작 시각과 종료 시각을 지정하여
해당 구간에 한해서만 매매가 발생하도록 제한
옵션을 비활성화하면:
전략은 전체 차트 구간에서 자유롭게 동작
6-2. 진입 라벨 위치 설정
사용자는 매수/레버리지 라벨의 위치를 선택할 수 있습니다.
바 아래 (Below Bar)
바 위 (Above Bar)
실제 가격 위치 (At Price)
이를 통해 개인 취향 및 차트 가독성에 맞추어
시각화 방식을 유연하게 조정할 수 있습니다.
7. 활용 대상 및 사용 예시
본 전략은 다음과 같은 목적에 적합합니다.
현물 또는 선물 롱 포지션 기준 장기·스윙 관점 추매 전략 백테스트
“고점 대비 하락률”을 기준으로 한 규칙 기반 운용 아이디어 검증
레버리지 사용 시
계좌 레버리지·청산가·MDD를 동시에 모니터링하고자 하는 경우
특정 자산에 대해
“새로운 고점이 형성될 때마다
일정한 규칙으로 깊은 조정 구간에서만 분할 진입하고자 할 때”
실거래에 그대로 적용하기보다는,
전략 아이디어 검증 및 리스크 프로파일 분석,
자신의 성향에 맞는 파라미터 탐색 용도로 사용하는 것을 권장합니다.
8. 한계 및 유의사항
백테스트 결과는 미래 성과를 보장하지 않습니다.
과거 데이터에 기반한 시뮬레이션일 뿐이며,
실제 시장에서는
유동성
슬리피지
수수료 체계
강제청산 규칙
등 다양한 변수가 존재합니다.
청산가는 단순화된 공식에 따른 추정치입니다.
거래소별 실제 청산 규칙, 유지 증거금, 수수료, 펀딩비 등은
본 전략의 계산과 다를 수 있으며,
청산가 추정 라인은 참고용 지표일 뿐입니다.
레버리지 및 진입 비율 설정에 따라 손실 폭이 매우 커질 수 있습니다.
특히 **“첫 포지션 300% 진입”**과 같이 매우 공격적인 설정은
시장 급락 시 계좌 손실과 청산 리스크를 크게 증가시킬 수 있으므로
신중한 검토가 필요합니다.
실거래 연동 시에는 별도의 리스크 관리가 필수입니다.
개별 손절 기준
포지션 상한선
전체 포트폴리오 내 비중 관리 등
본 전략 외부에서 추가적인 안전장치가 필요합니다.
9. 결론
ATH Drawdown Re-Buy Long Only 전략은 단순한 “저가 매수”를 넘어서,
ATH 기준으로 드로우다운을 구조적으로 활용하고,
첫 포지션에 대한 **특수 규칙(100% / 300%)**을 적용하며,
레버리지·청산가·MDD·수익률을 통합적으로 시각화함으로써,
하락 구간에서의 규칙 기반 롱 포지션 구축과
리스크 모니터링을 동시에 지원하는 전략입니다.
사용자는 본 전략을 통해:
자신의 시장 관점과 리스크 허용 범위에 맞는
드로우다운 구간
진입 비율
레버리지 설정
다양한 시나리오에 대한 백테스트와 분석
을 수행할 수 있습니다.
다시 한 번 강조하지만,
본 전략은 연구·학습·백테스트를 위한 도구이며,
실제 투자 판단과 책임은 전적으로 사용자 본인에게 있습니다.
/ENG Version.
This script is designed to use historical drawdown data and automatically enter positions when a predefined percentage drop from the all-time high occurs, using a predefined percentage of your account equity.
You can use leverage, and default parameter values are provided out of the box (you can freely change them to suit your style).
In addition to the two main entry levels, you can add more entry conditions and custom entry percentages – just ask ChatGPT to modify the script.
For actual/live usage, please turn OFF the KillSwitch function and turn ON the Bar Magnifier feature.
ATH Drawdown Re-Buy Long Only Strategy
1. Strategy Overview
The ATH Drawdown Re-Buy Long Only strategy is an automatic re-buy (Long Only) system that builds long positions step-by-step at specific drawdown levels, based on the asset’s all-time high (ATH) and its subsequent drawdown.
This strategy is designed with the following goals:
Systematic scaled buying and leverage usage during sharp correction periods
Clear, rule-based entry logic using drawdowns from ATH
Real-time visualization of:
Average entry price
Leverage
Estimated liquidation price
Account MDD (Max Drawdown)
Return / performance
This allows traders to intuitively monitor both risk and position status.
※ This strategy is provided for educational, research, and backtesting purposes only.
It does not constitute investment advice and does not guarantee any profits.
2. Core Concepts
2-1. Drawdown from ATH (All-Time High)
On the chart, the strategy always tracks the highest high as the ATH.
Whenever a new high is made, ATH is updated, and based on that ATH the following are calculated:
How many percent the current bar’s Low is below the ATH
How many percent the current bar’s Close is below the ATH
Using these, the strategy executes buys at two predefined drawdown zones:
1st entry zone: When price drops X% from ATH
2nd entry zone: When price drops Y% from ATH
Each zone is allowed to trigger only once per ATH cycle.
When a new ATH is created, the “1st / 2nd entry possible” flags are reset, and new opportunities open up for that ATH leg.
2-2. Special Rule for the First Position (100% / 300%)
A key feature of this strategy is the special rule for the very first position.
When the strategy currently holds no position and is about to open the first long position:
Under normal conditions, it builds the position using 100% of account equity.
However, if at that moment the price has dropped by at least a predefined threshold from ATH (e.g. around –72.5% or more),
→ the strategy will open the first position using 300% of account equity.
This rule works as follows:
Whether the first entry happens at the 1st drawdown zone or at the 2nd drawdown zone,
If the current drawdown from ATH is at or below the threshold (e.g. –72.5% or worse),
→ the strategy interprets this as “a sufficiently deep crash” and opens the initial position with 300% of equity.
If the drawdown is less severe than the threshold,
→ the first entry is capped at 100% of equity.
So the strategy has two modes for the first entry:
Normal market conditions: 100% of equity
Deep drawdown conditions: 300% of equity
This special rule is intended to be aggressive in extremely deep crashes while staying more conservative in normal corrections.
3. Strategy Logic & Execution
3-1. Entry Conditions
The strategy tracks the ATH using the High price.
For each bar, it calculates the drawdown from ATH.
The user defines two drawdown zones, for example:
1st zone: ATH – 50%
2nd zone: ATH – 72.5%
For each zone, the strategy checks:
If no buy has been executed yet for that zone in the current ATH leg, and
If the current bar’s Low touches or falls below that zone’s price level,
→ That bar is considered to have triggered a buy condition.
Order simulation:
The strategy simulates entering a long position at that zone’s price level
(using a limit/market-like approximation for backtesting).
3-2. ATH Reset & Entry Opportunity Reset
When a new High goes above the previous ATH:
The ATH is updated to this new high.
Internal flags that track whether the 1st and 2nd entries have been used are reset.
This means:
Each time the market makes a new ATH,
The strategy once again has a fresh opportunity to execute 1st and 2nd drawdown entries for that new ATH leg.
4. Position Sizing & Leverage
4-1. Position Size Based on Account Equity
The strategy defines current equity as:
Current Equity = Initial Capital + Realized PnL + Unrealized PnL
For each entry zone, the position value is calculated as follows:
The user inputs:
“What % of equity to use at this zone”
The strategy:
Multiplies current equity by that percentage
Then multiplies by the strategy’s leverage factor
Thus:
Position Value = Current Equity × (Zone % / 100) × Leverage
Finally, this position value is divided by the entry price to determine the actual position size in tokens.
4-2. Exception for the First Position (100% / 300%)
For the very first position (when there is no open position),
the strategy does not use the zone % parameters. Instead, it uses fixed ratios:
Default: Enter the first position with 100% of equity.
If the drawdown from ATH at that moment is greater than or equal to a predefined threshold (e.g. –72.5% or more)
→ Enter the first position with 300% of equity.
The position value is computed as:
Position Value = Current Equity × (100% or 300%) × Leverage
Then it is divided by the entry price to obtain the token quantity.
This rule:
Applies regardless of whether the first entry occurs at the 1st zone or 2nd zone.
Embeds the philosophy:
“In very deep crashes, go much larger on the first entry; otherwise, stay more conservative.”
4-3. Tracking Real Leverage
On each bar, the strategy tracks:
The existing position size at the start of the bar
The newly added size (if any) on that bar
When a new entry occurs, it calculates the real leverage at that moment:
Real Leverage = (Position Value / Current Equity)
This is then displayed on the chart as a label, for example:
Lev 2.53x
This makes it easy to see the actual leverage level at each entry point.
5. Visualization & Monitoring
5-1. On-Chart Visual Elements
The strategy plots the following directly on the chart:
ATH Line
The all-time high (based on High) is plotted as an orange line.
Average Entry Price Line
When a position is open, the average entry price of that position is plotted as a yellow line.
Estimated Liquidation Price (Fixed) Line
The strategy detects when the position size changes.
At each size change, it uses the current average entry price and real leverage to compute an approximate liquidation price.
This “fixed liquidation price” is then plotted as a red line on the chart.
If there is no position, or if leverage is 1x or lower, the liquidation line is removed.
Entry Markers & Labels
When 1st/2nd entry conditions are met, the strategy:
Marks the entry point on the chart.
Displays labels such as "Buy XX% @ Price" and "Lev XXx",
showing both entry percentage and real leverage at that time.
The label placement is configurable:
Below Bar
Above Bar
At Price
5-2. Information Table (Top-Right Panel)
In the top-right corner of the chart, the strategy displays a summary table of the current account and position status. It typically includes:
Pos Qty (Token)
Absolute size of the current position (in tokens)
Pos Value (USDT)
Market value of the current position (qty × current price)
Leverage (Now)
Current real leverage (position value / current equity)
DD from ATH (%)
Current drawdown (%) from the latest ATH, based on current price
Avg Entry
Average entry price of the current position
PnL (%)
Unrealized profit/loss (%) of the current position
Max DD (Equity %)
The maximum equity drawdown (MDD) recorded over the entire backtest period
Last Entry Price
Average entry price immediately after the most recent add-on entry
Last Entry Lev
Real leverage at the time of the most recent entry
Liq Price (Fixed)
The fixed estimated liquidation price described above
Return from Start (%)
Total return (%) of equity compared to the initial capital
Through this table, users can quickly grasp:
Current account and position status
Current risk level
Cumulative performance
6. Time Filters & Label Options
6-1. Strategy Date Range Filter
The strategy provides an option to restrict trading to a specific time range.
When “Use Date Range” is enabled:
You can specify start and end timestamps.
The strategy will only execute trades within that range.
When this option is disabled:
The strategy operates over the entire chart history.
6-2. Entry Label Placement
Users can customize where entry/leverage labels are drawn:
Below Bar (Below Bar)
Above Bar (Above Bar)
At the actual price level (At Price)
This allows you to adjust visualization according to personal preference and chart readability.
7. Use Cases & Applications
This strategy is suitable for the following purposes:
Long-term / swing-style re-buy strategies for spot or futures long positions
Testing rule-based strategies that rely on “drawdown from ATH” as a main signal
Monitoring account leverage, liquidation price, and MDD when using leverage
Handling situations where, for a given asset:
“Every time a new ATH is formed,
you want to wait for deep corrections and enter only at specific drawdown zones”
It is generally recommended to use this strategy not as a direct plug-and-play live system, but as a tool for:
Strategy idea validation
Risk profile analysis
Parameter exploration to match your personal risk tolerance and style
8. Limitations & Warnings
Backtest results do not guarantee future performance.
They are based on historical data only.
In live markets, additional factors exist:
Liquidity
Slippage
Fee structures
Exchange-specific liquidation rules
Funding fees, etc.
The liquidation price is only an approximate estimate, derived from a simplified formula.
Actual liquidation rules, maintenance margin requirements, fees, and other details differ by exchange.
The liquidation line should be treated as a reference indicator, not an exact guarantee.
Depending on the configured leverage and entry percentages, losses can be very large.
In particular, extremely aggressive settings such as “first position 300% of equity” can greatly increase the risk of large account drawdowns and liquidation during sharp market crashes.
Use such settings with extreme caution.
For live trading, additional risk management is essential:
Your own stop-loss rules
Maximum position size limits
Portfolio-level exposure controls
And other external safety mechanisms beyond this strategy
9. Conclusion
The ATH Drawdown Re-Buy Long Only strategy goes beyond simple “buy the dip” logic. It:
Systematically utilizes drawdowns from ATH as a structural signal
Applies a special first-position rule (100% / 300%)
Integrates visualization of leverage, liquidation price, MDD, and returns
All of this supports rule-based long position building in drawdown phases and comprehensive risk monitoring.
With this strategy, users can:
Explore different:
Drawdown zones
Entry percentages
Leverage levels
Run various backtests and scenario analyses
Better understand the risk/return profile that fits their own market view and risk tolerance
Once again, this strategy is intended for research, learning, and backtesting only.
All real trading decisions and their consequences are solely the responsibility of the user.

Liquidation Cascade Detector [QuantAlgo]🟢 Overview
The Liquidation Cascade Detector employs multi-dimensional microstructure analysis to identify forced liquidation events by synthesizing volume anomalies, price acceleration dynamics, and volatility regime shifts. Unlike conventional momentum indicators that merely track directional bias, this indicator isolates the specific market conditions where leveraged positions experience forced unwinding, creating asymmetric opportunities for mean reversion traders and market makers to take advantage of temporary liquidity imbalances.
These liquidation cascades manifest through various catalysts: overwhelming spot selling coupled with leveraged long liquidation forced unwinding creates downward spirals where organic sell pressure triggers margin calls, which generate additional selling that triggers more margin calls. Conversely, sudden large buy orders or coordinated buying can squeeze overleveraged shorts, forcing buy-to-cover orders that push price higher, triggering additional short stops in a self-reinforcing feedback loop. The indicator captures both scenarios, regardless of whether the initial catalyst is organic flow or forced liquidation.
For sophisticated traders/market makers deploying amplification strategies, this indicator serves as an early warning system for distressed order flow. By detecting the moments when cascading stop-losses and margin calls create self-reinforcing price movements, the system enables traders to: (1) identify forced participants experiencing capital pressure, (2) strategically add liquidity in the direction of panic flow to amplify displacement, (3) accumulate contra-positions during the overshoot phase, and (4) capture mean reversion profits as equilibrium pricing reasserts itself. This approach transforms destructive liquidation events into potential profit opportunities by systematically front-running and then fading coordinated forced selling/buying.
🟢 How It Works
The detection engine operates through a three-tier confirmation framework that validates liquidation events only when multiple independent market stress indicators align simultaneously:
► Tier 1: Volume Anomaly Detection
The system calculates bar-to-bar volume ratios to identify abnormal participation spikes characteristic of forced liquidations. The Volume Spike threshold filters for transactions where current volume significantly exceeds previous bar volume. When leveraged positions hit stop-losses or margin requirements, their simultaneous unwinding creates distinctive volume signatures absent during organic price discovery. This metric isolates moments when market makers face one-sided order flow from distressed participants unable to control execution timing, whether triggered by whale orders absorbing liquidity or cascading margin calls creating relentless directional pressure.
► Tier 2: Price Acceleration Measurement
By comparing current bar's absolute body size against the previous bar's movement, the algorithm quantifies momentum acceleration. The Price Acceleration threshold identifies scenarios where price velocity increases dramatically, a hallmark of cascading liquidations where each stop-loss triggers additional stops in a feedback loop. This calculation distinguishes between gradual trend development (irrelevant for amplification attacks) and explosive moves driven by forced order flow requiring immediate liquidity provision. The metric captures both panic selling scenarios where spot sellers overwhelm bid liquidity triggering long liquidations, and short squeeze dynamics where aggressive buying exhausts offer-side depth forcing short covering.
► Tier 3: Volatility Expansion Analysis
The indicator measures bar range expansion by computing the current high-low range relative to the previous bar. The Volatility Spike threshold captures regime shifts where intrabar price action becomes erratic, evidence that market depth has evaporated and order book imbalance is driving price. Combined with body-to-range analysis indicating strong directional conviction, this metric confirms that volatility expansion reflects genuine liquidation pressure rather than random noise or low-volume chop.
*Supplementary Confirmation Metrics
Beyond the three primary detection tiers, the system analyzes additional candle characteristics that distinguish genuine liquidation events from ordinary volatility:
► Candle Strength: Measures the ratio of candle body size to total bar range. High readings (above 60%) indicate strong directional conviction where price moved decisively in one direction with minimal retracement. During liquidations, distressed traders execute market orders that drive price aggressively without the normal back-and-forth of balanced trading. Strong-bodied candles with minimal wicks confirm forced participants are accepting any available price rather than attempting to minimize slippage, validating that observed volume and price acceleration stem from liquidation pressure rather than routine trading.
► Volume Climax: Identifies when current volume reaches the highest level within recent history. Climax volume events mark terminal liquidation phases where maximum panic or squeeze intensity occurs. These extreme participation spikes typically represent the final wave of forced exits as the last remaining stops are triggered or the final shorts capitulate. For mean reversion traders, volume climax signals provide optimal reversal entry timing, as they mark maximum displacement from equilibrium when all forced sellers/buyers have been exhausted.
*Directional Classification
The system categorizes cascades into two actionable classes:
1. Short Liquidation (Bullish Cascade): Upward price movement combined with cascade patterns equals forced short covering. This occurs when aggressive spot buying (often from whales placing large market orders) or coordinated buy programs exhaust available offer liquidity, spiking price upward and triggering clustered short stop-losses. Short sellers experiencing margin pressure must buy-to-close regardless of price, creating artificial demand spikes that compound the initial buying pressure. The combination of organic buying and forced covering creates explosive upward moves as each liquidated short adds buy-side pressure, triggering additional shorts in a self-reinforcing loop. Market makers can amplify this by lifting offers ahead of forced buy orders, then selling into the exhaustion at elevated levels.
2. Long Liquidation (Bearish Cascade): Downward price movement combined with cascade patterns equals forced long liquidation. This manifests when heavy spot selling (panic sellers, large institutional unwinds, or coordinated distribution) overwhelms bid-side liquidity, breaking through support levels where long stop-losses cluster. Over-leveraged longs facing margin calls must sell-to-close at any price, generating artificial supply waves that compound the initial selling pressure. The dual force of organic selling coupled with forced long liquidation creates downward spirals where each margin call triggers additional margin calls through further price deterioration. Amplification opportunities exist by hitting bids ahead of panic selling, accumulating long positions during the capitulation, and reversing as sellers exhaust.
🟢 How to Use
1. For Mean Reversion Traders
When the indicator highlights a short liquidation cascade (green background), this signals that shorts are experiencing forced buy-to-cover pressure, often initiated by whale bids or aggressive spot buying that triggered the squeeze. Mean reversion traders can interpret this as a temporary upward dislocation from fair value. As the dashboard shows declining momentum metrics and the cascade highlighting stops, this represents a potential fade opportunity. Enter short positions expecting price to revert back toward pre-cascade levels once the forced buying exhausts and the initial large buyer completes their accumulation.
When a long liquidation cascade triggers (red background), longs are undergoing forced sell-to-close liquidation, typically catalyzed by overwhelming spot selling that breached key support levels. This creates artificial downward pressure disconnected from fundamental value, as margin-driven forced selling compounds organic sell flow. Mean reversion traders wait for the cascade to complete (dashboard transitions from active liquidation status to neutral), then enter long positions anticipating snap-back toward equilibrium pricing as panic subsides and forced sellers are exhausted.
You can also monitor the dashboard's Volume Climax indicator. When it displays "YES" during an active cascade, this suggests the liquidation is reaching its terminal phase, whether driven by the final shorts being squeezed out or the last leveraged longs capitulating. Mean reversion entries become highest probability at this point, as maximum displacement from fair value has occurred. Wait for the next 1-3 bars after climax confirmation, then enter contra-trend positions with tight stops.
The Candle Strength metric also helps validate entry timing. When candle strength readings drop significantly after maintaining elevated levels during the cascade, this divergence indicates absorption is occurring. Market makers are stepping in to provide liquidity, supporting your mean reversion thesis. Strong candle bodies during the cascade followed by weaker bodies signal the forced flow is diminishing.
2. For Momentum & Trend Following Traders
When price breaks through a significant resistance level and immediately triggers a short liquidation cascade (green background), this confirms breakout validity through forced participation. Shorts positioned against the breakout are now experiencing margin pressure from the combination of breakout momentum and potential whale buying, creating self-reinforcing buying that propels price higher. Enter long positions during the cascade or immediately after, as the forced covering provides fuel for extended momentum continuation.
Conversely, when price breaks below key support and triggers a long liquidation cascade (red background), the breakdown is validated by forced selling from trapped longs. Heavy spot selling coupled with margin liquidations creates accelerated downside momentum as liquidations cascade through clustered stop-loss levels. Enter short positions as the cascade develops, riding the combined force of organic selling and forced liquidation for extended trend moves.
3. For Sophisticated Traders & Market Makers
► Amplification Attack Execution
Sophisticated operators can exploit cascades through systematic amplification positioning. When a short liquidation is detected (green highlight activating), often initiated by whale bids absorbing offer liquidity, place aggressive buy orders to front-run and amplify the forced short covering. This exacerbates upward pressure, pushing price further from equilibrium and triggering additional clustered stops. Simultaneously begin accumulating short positions at these artificially elevated levels. As dashboard metrics indicate cascade exhaustion (volume spike declining, climax signal appearing, candle strength weakening), flatten amplification longs and hold accumulated shorts into the mean reversion.
For long liquidations (red highlight), typically catalyzed by heavy spot selling overwhelming bid depth, execute the inverse strategy. Place aggressive sell orders to compound the panic selling, amplifying downward displacement and accelerating margin call triggers. Layer long entries at depressed prices during this amplification phase as forced liquidation selling creates artificial supply. When dashboard signals cascade completion (metrics normalizing, volume climax passing), exit amplification shorts and maintain long positions for the reversal trade.
► Market Making During Liquidity Crises
During detected cascades, temporarily adjust quote placement strategy. When dashboard shows all three confirmation metrics activating simultaneously with strong candle bodies, this indicates the highest probability liquidation event, whether from whale order flow or cascading margin calls. Widen spreads dramatically to capture enhanced edge during the liquidity vacuum. Alternatively, step away from quote provision entirely on your natural inventory side (stop offering during short cascades driven by aggressive buying, stop bidding during long cascades driven by overwhelming selling) to avoid adverse selection from forced flow.
Use cascade detection to inform inventory management. During short cascades initiated by large buy orders or short squeezes, reduce existing short inventory exposure while allowing the forced buying to push price higher. Rebuild short inventory only at the inflated levels created by liquidation pressure. During long cascades where spot selling compounds leveraged liquidation, reduce long inventory and use the forced selling to reaccumulate at artificially depressed prices rather than providing stabilizing liquidity too early.
► Sequential Positioning Strategy
Advanced traders can structure trades in phases: (1) Initial amplification orders placed immediately upon cascade detection to front-run forced flow, (2) Contra-position accumulation scaled in as displacement extends and dashboard readings intensify, (3) Amplification trade exit when metrics show deceleration or candle strength weakens, (4) Contra-position hold through mean reversion, targeting pre-cascade price levels. This sequential approach extracts profit from both the dislocation phase and the subsequent equilibrium restoration.
► Risk Monitoring
If cascade highlighting persists across many consecutive bars while dashboard volume readings remain extremely elevated with sustained strong candle bodies, this suggests sustained institutional deleveraging or persistent whale activity rather than simple retail liquidation. Reduce amplification position sizing significantly, as these extended events can exhibit delayed mean reversion. Professional counter-parties may be establishing dominant positions, limiting your edge.
When volatility spike metrics decline while cascade highlighting continues, professional absorption is occurring. Proceed cautiously with amplification strategies, as intelligent liquidity providers are already positioning for the reversal, potentially front-running your intended reversal trade. Similarly, if large liquidation wicks appear during cascades, this indicates partial absorption is happening, suggesting more sophisticated players are taking the opposite side of distressed flow.

Calc. Risco/Lote – Multi Ativos (v2)Works for:
Forex (EURUSD, GBPUSD, USDCHF, USDCAD, USDJPY etc.)
Indices (US30, NAS100, GER40…)
Gold (XAUUSD), etc.
You manually enter:
Cash / Balance (USD)
Risk per trade (%)
Direction (Buy/Sell)
Entry Price
Stop Price (SL)
Target Price (TP)
The indicator calculates:
Distance between SL and TP in points
Value per point (automatic per asset)
Ideal lot / position size
Loss if SL hits (USD)
Profit if TP hits (USD)
Risk/Reward (R:R)
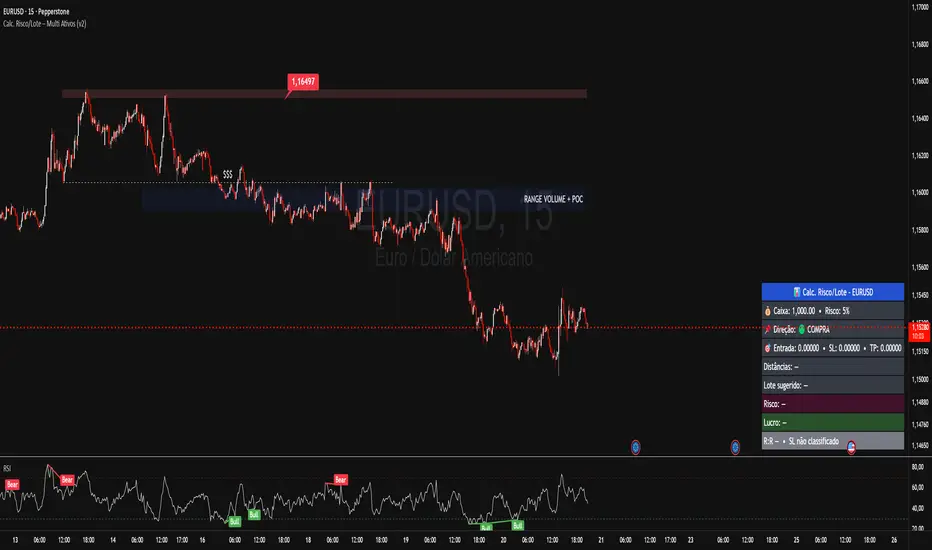
Multi-Asset % Performance Table | v2.1 | TCP Multi-Asset % Performance Table | v2.1 | TCP
ESSENTIAL SUMMARY:
Multi-Asset % Performance Table eliminates the need to manually draw and manage individual "Price Range" tools for every asset. It automatically tracks up to 15 tickers independently in a single dashboard, calculating a TOTAL SCORE (Portfolio Average) for you. Unlike manual drawings, it supports a Global Range while allowing Custom Dates for specific assets, ensuring each ticker is calculated based on its own precise entry/exit. The Smart Visuals dynamically draw the correct date lines only for the ticker you are currently viewing, keeping your chart automatic, accurate, and clutter-free.
FUL DESCRIPTION:
📊 What is this tool?
The Multi-Asset % Performance Table is a powerful portfolio dashboard designed to track the percentage performance of up to 15 different assets simultaneously.
Instead of checking tickers one by one or manually drawing price ranges, this indicator aggregates everything into a single, clean table. It allows you to compare the ROI (Return on Investment) of a basket of coins or stocks over a specific time period and calculates an aggregate TOTAL SCORE (Average %) for your selection.
🚀 Key Features
15 Asset Slots: Monitor up to 15 different tickers (Crypto, Stocks, Forex, etc.) in one view.
Global vs. Custom Dates: Set a "Global" start/end date for the whole portfolio, but override specific assets with Custom Dates if they entered the portfolio at a different time.
Smart Visuals: Automatically draws vertical dashed lines on your chart representing the start and end dates of the ticker you are currently viewing.
Total Score Calculation: Calculates the average percentage change of your portfolio. You can dynamically include or exclude specific assets from this average using the settings.
Status Column: A quick visual reference (✔ or ✘) in the table showing which assets are currently included in the Total Score calculation.
⚙️ How it Works
Data Fetching: The script pulls "Close" prices from the Daily timeframe to ensure accuracy across long periods.
Smart Matching: The visual lines automatically detect which asset you are viewing. For example, if you are looking at BTCUSDT and have custom dates set for it, the vertical lines will jump to those specific dates. If you view a ticker not in your list, it defaults to the Global dates.
Visual Protection: The script uses advanced logic to ensure only one set of range lines appears on the chart at a time, keeping your workspace clean.
🛠️ Instructions & Settings
1. Setting up your Assets
Open the Settings (Cogwheel icon).
Under ASSET 1 through ASSET 15, enter the tickers you want to track (e.g., BINANCE:BTCUSDT).
Include in Avg?: Uncheck this if you want to see the asset in the table but exclude it from the "TOTAL SCORE" average.
2. Defining Time Ranges
Global Settings: Set the Global Start and Global End dates at the top. This applies to all assets by default.
Custom Dates: If a specific asset (e.g., Asset 4) was bought on a different day, check the "Custom Dates?" box for that asset and enter its specific Start/End time.
3. Reading the Table
The table appears on the chart (default: Bottom Right) with three columns:
Asset: The name of the ticker.
% Change: The percentage move from Start Date to End Date. (Green = Positive, Red = Negative).
Inc: Shows a ✔ if the asset is included in the Total Score average, or a ✘ if excluded.
4. The Visual Lines
Two vertical dashed lines will appear on your chart.
Note: These lines are visual references only. You cannot drag them to change the dates. To change the dates, you must use the Settings menu.
💡 Tips
Hover for Details: Hover your mouse over the % Change value in the table to see a tooltip showing the exact Start Price and End Price used for the calculation.
Resolution: The script defaults to 1 Day resolution for optimal accuracy on historical data.
v2.1 | TCP - Custom Built for Precision Performance Tracking
