[RS]Multiple Majors Currency Basket Power Oscillator V1Power oscillator to discern what currency's are stronger/weaker.
added option to use a smoothed source(close) for pooling the change, giving longer term directional bias, note that this causes lag in the results as MA's turn slower than price.
Power

Power Law Correlation Indicator 2.0 The Power Law Correlation Indicator is an attempt to chart when a stock/currency/futures contract goes parabolic forming a upward or downward curve that accelerates according to power laws.
I've read about power laws from Sornette Diedler ( www.marketcalls.in ). And I think the theory is a good one.
The idea behind this indicator is that it will rise to 1.0 as the curve resembles a parabolic up or down swing. When it is below zero, the stock will flatten out.
There are many ways to use this indicator. One way I am testing it out is in trading Strangles or Straddle option trades. When this indicator goes below zero and starts to turn around, it means that it has flattened out. This is like a squeeze indicator. (see the TTM squeeze indicator).
Since this indicator goes below zero and the squeeze plays tend to be mean-reverting; then its a great time to put on a straddle/strangle.
Another way to use it is to think of it in terms of trend strength. Think of it as a kind of ADX, that measures the trend strength. When it is rising, the trend is strong; when it is dropping, the trend is weak.
Lastly I think this indicator needs some work. I tried to put the power (x^n) function into it but my coding skill is limited. I am hoping that Lazy Bear or Ricardo Santos can do it some justice.
Also I think that if we can figure out how to do other power law graphs, perhaps we can plot them together on one indicator.
So far I really like this one for finding Strangle spots. So check it out.
Peace
SpreadEagle71

[RS]Linear Regression Bull and Bear Power Accumulation V1EXPERIMENTAL:
Bull and Bear power based on linear regression (this is a non lagging oscillator, the parameter are for the lookup window for the donchian extremes)
this indicator can also be used for convergence/divergence.
(accidentjev2) added multi timeframe support (indicator may repaint values)


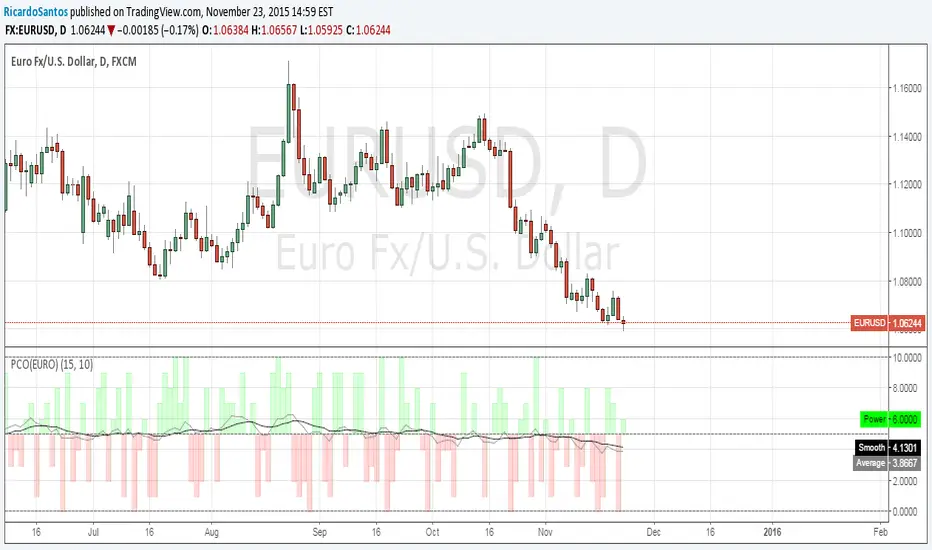
[RS]Power Correlation Oscillator (EURO) V1EXPERIMENTAL:
Added Smoother avg for a better visualization of the trending strength.
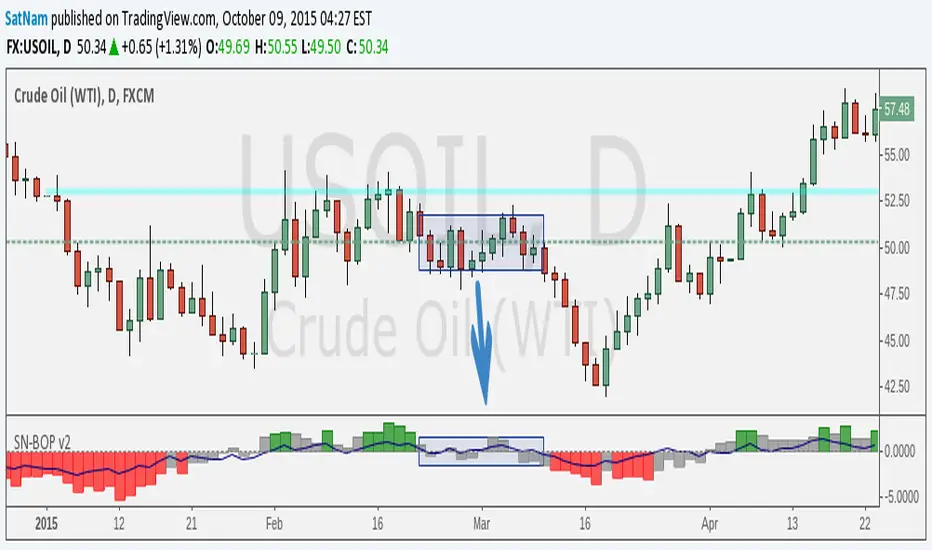
SN Smoothed Balance of Power v2Hi all,
here is an updated version of the indicator script I published yesterday.
The goal of this indicator is to try and find darkpool activity. The indicator itself is not enough to fully identify darkpool but it should be able to detect quiet accumulation. What makes this Balance of Power different from others on TV is that it is smoothed by using a moving average.
Notes:
- The values that are default are completely arbitrary except for the VWMA length (a 14-day period for the 1D chart is the norm). For instance the limit where it shows red/green I picked because it works best for the 1D chart I am using. Other TF's and charts will need tweaking of all the values you find in the options menu to get the best results.
- I modified the indicator such that it is usable on charts that do not show volume. HOWEVER, this chart is default to NYMEX: CL1!. To get different volume data this needs to be changed in the option menu.
- I am in no way an expert on darkpool/HFT trading and am merely going from the information I found on the internet. Consider this an experiment.
Credits:
- Lazybear for some of the plotting-code
- Igor Livshin for the formula
- TahaBintahir for the Symbol-code (although I'm not sure who the original author is...)
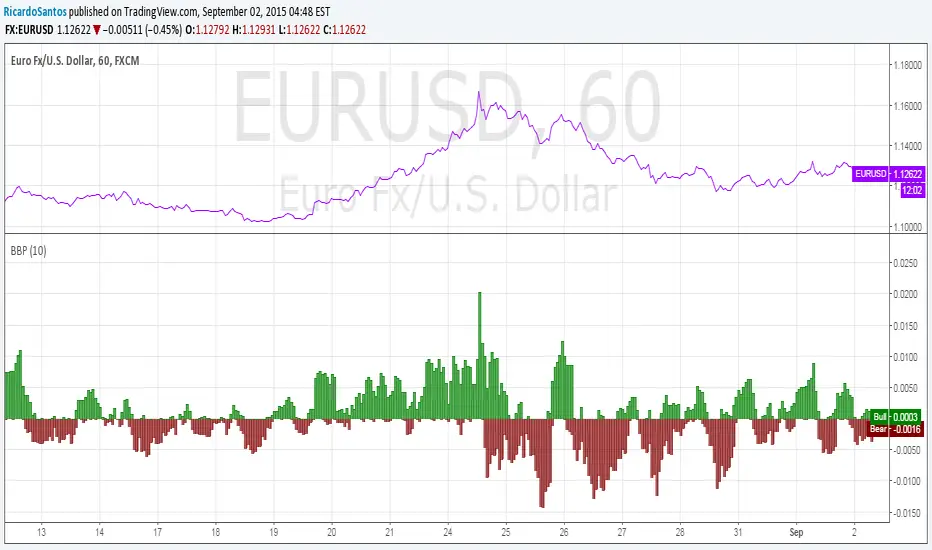
[RS]Linear Regression Bull and Bear Power V0EXPERIMENTAL:
Bull and Bear power based on linear regression (this is a non lagging oscillator, the parameter are for the lookup window for the donchian extremes)
this indicator can also be used for convergence/divergence.
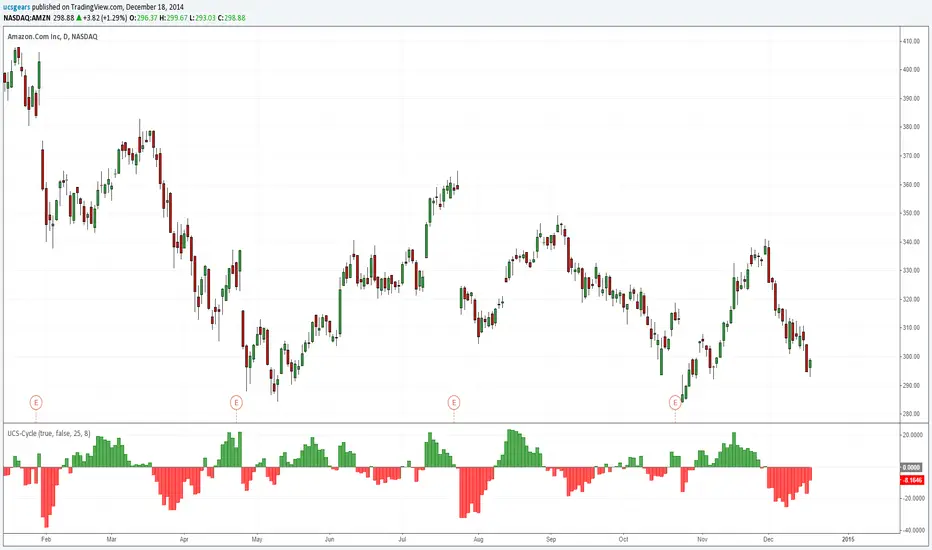
UCS_CycleThis indicator was designed to remove trend from price and make it easier to identify cycles.
Although this indicator has similarities to MACD. It is better used to identify the cycle of High and Lows based on the Statistical Data (Default is set to 25).
**** DO NOT USE THIS AS A MOMENTUM INDICATOR ****
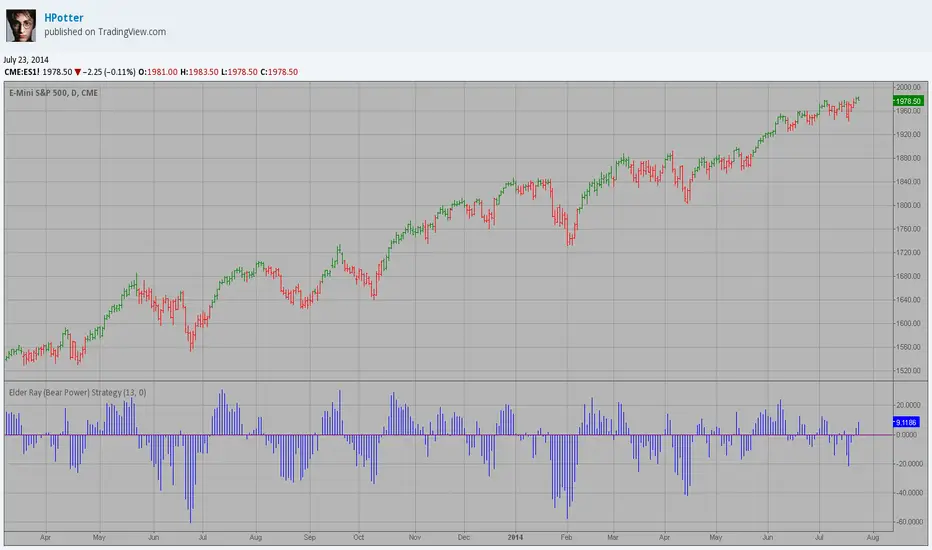
Elder Ray (Bear Power) Strategy Developed by Dr Alexander Elder, the Elder-ray indicator measures buying
and selling pressure in the market. The Elder-ray is often used as part
of the Triple Screen trading system but may also be used on its own.
Dr Elder uses a 13-day exponential moving average (EMA) to indicate the
market consensus of value. Bear Power measures the ability of sellers to
drive prices below the consensus of value. Bear Power reflects the ability
of sellers to drive prices below the average consensus of value.
Bull Power is calculated by subtracting the 13-day EMA from the day's High.
Bear power subtracts the 13-day EMA from the day's Low.
You can use in the xPrice any series: Open, High, Low, Close, HL2, HLC3, OHLC4 and ect...
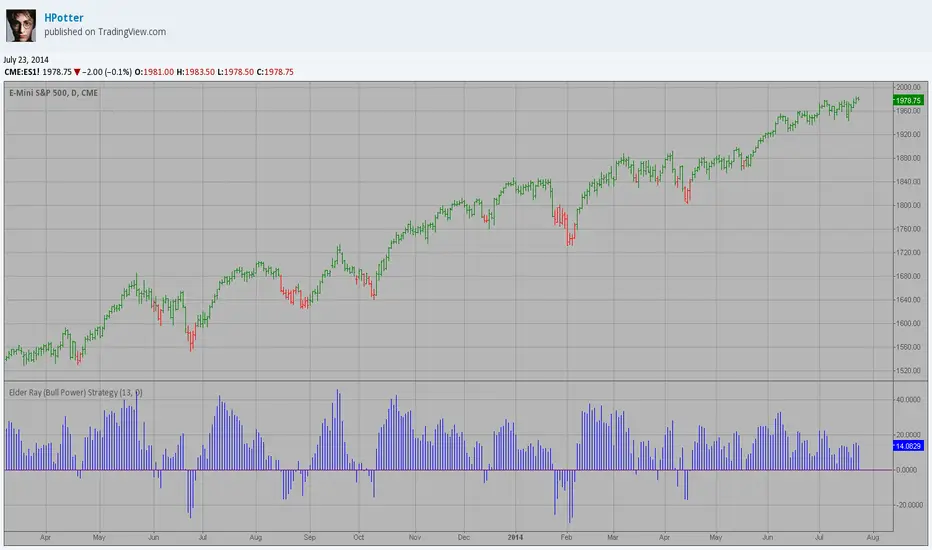
Elder Ray (Bull Power) Strategy Developed by Dr Alexander Elder, the Elder-ray indicator measures buying
and selling pressure in the market. The Elder-ray is often used as part
of the Triple Screen trading system but may also be used on its own.
Dr Elder uses a 13-day exponential moving average (EMA) to indicate the
market consensus of value. Bull Power measures the ability of buyers to
drive prices above the consensus of value. Bear Power reflects the ability
of sellers to drive prices below the average consensus of value.
Bull Power is calculated by subtracting the 13-day EMA from the day's High.
Bear power subtracts the 13-day EMA from the day's Low.
You can use in the xPrice any series: Open, High, Low, Close, HL2, HLC3, OHLC4 and ect...
Elder Ray (Bear Power) Developed by Dr Alexander Elder, the Elder-ray indicator measures buying
and selling pressure in the market. The Elder-ray is often used as part
of the Triple Screen trading system but may also be used on its own.
Dr Elder uses a 13-day exponential moving average (EMA) to indicate the
market consensus of value. Bear Power measures the ability of sellers to
drive prices below the consensus of value. Bear Power reflects the ability
of sellers to drive prices below the average consensus of value.
Bull Power is calculated by subtracting the 13-day EMA from the day's High.
Bear power subtracts the 13-day EMA from the day's Low.
You can use in the xPrice any series: Open, High, Low, Close, HL2, HLC3, OHLC4 and ect...

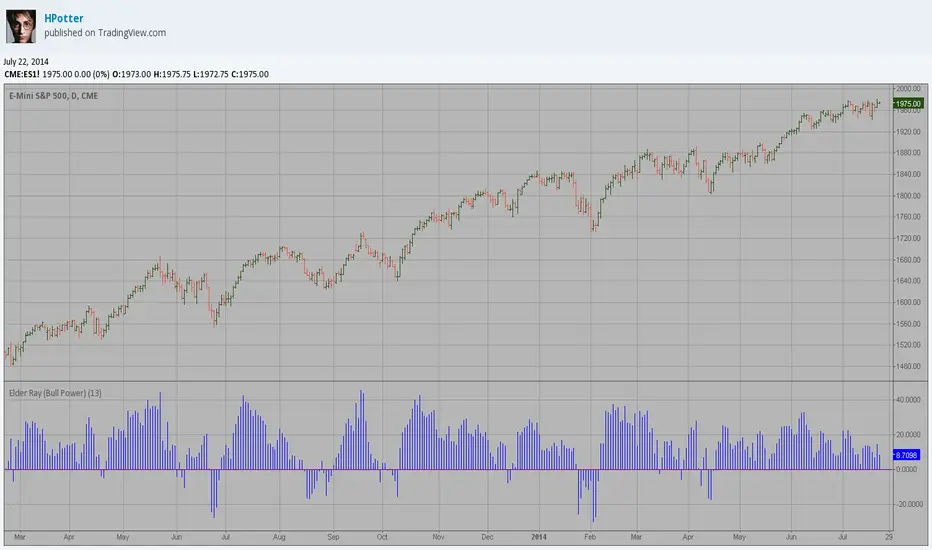
Elder Ray (Bull Power) Developed by Dr Alexander Elder, the Elder-ray indicator measures buying
and selling pressure in the market. The Elder-ray is often used as part
of the Triple Screen trading system but may also be used on its own.
Dr Elder uses a 13-day exponential moving average (EMA) to indicate the
market consensus of value. Bull Power measures the ability of buyers to
drive prices above the consensus of value. Bear Power reflects the ability
of sellers to drive prices below the average consensus of value.
Bull Power is calculated by subtracting the 13-day EMA from the day's High.
Bear power subtracts the 13-day EMA from the day's Low.
You can use in the xPrice any series: Open, High, Low, Close, HL2, HLC3, OHLC4 and ect...
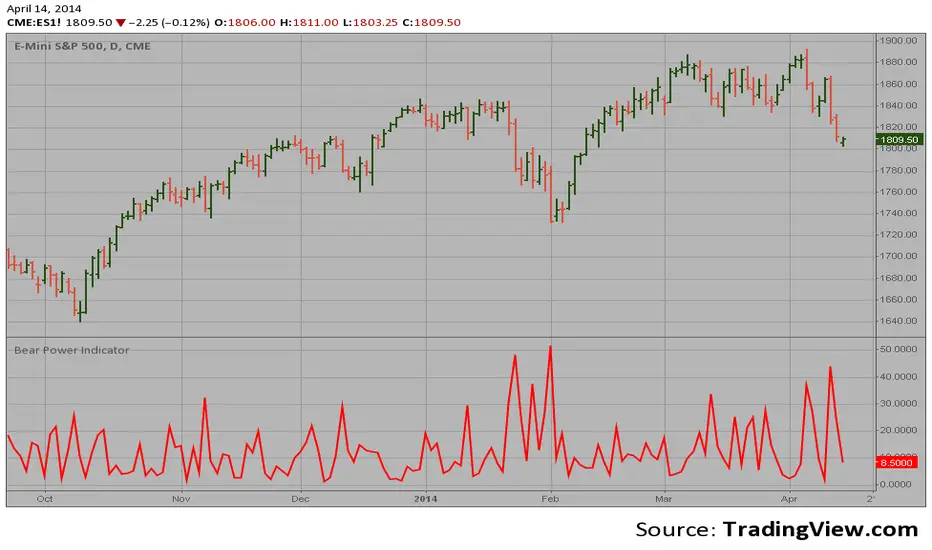
Bear Power Indicator To get more information please see "Bull And Bear Balance Indicator"
by Vadim Gimelfarb.
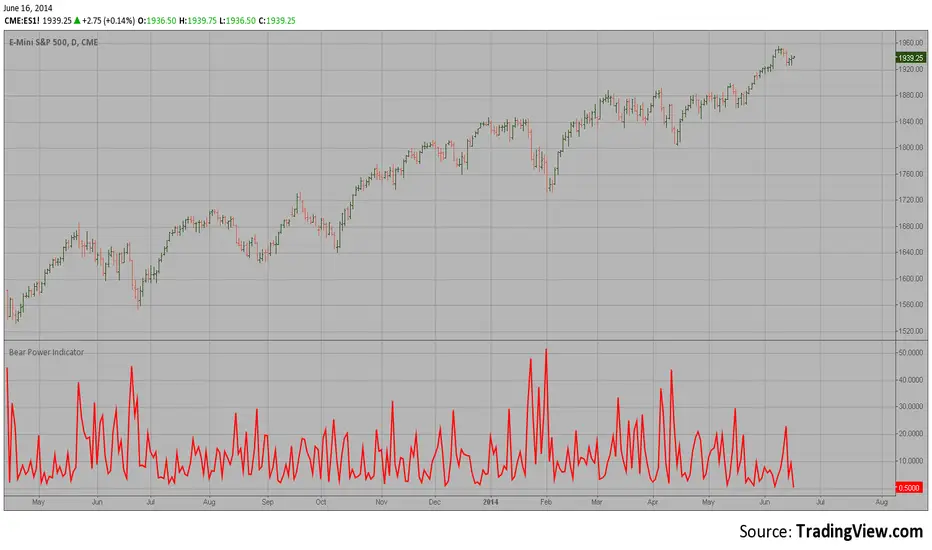
Bear Power Indicator Hi
Let me introduce my Bear Power Indicator script.
To get more information please see "Bull And Bear Balance Indicator"
by Vadim Gimelfarb.