Intraday Fibs RetracementFibonacci (Fibs) levels are often used by traders as a way to find support and resistance, based on the Fibonacci sequence. These levels are widely used in technical analysis to identify potential reversal points in the price of an asset.
Fibs retracement draws lines at these Fibs level between a significant high and low point on a price chart.
What it shows:
This indicator will automatically draw Fibs Retracement Levels on your chart without any manual work.
It is designed to be used for day trading, especially in scenarios where a ticker gaps up/down large compared to the prior day close. (i.e. scenario where the difference of day's open and prior day close is large)
The drawing will happen on each trading day the moment trading hours open, and will NOT draw during pre-market and post-market.
User can see the line of each Fibs level, labelled with the Fib percentage and price value for the corresponding levels.
User will specify a start and end point of Fibs and based on the choice the indicator will automatically compute the other user defined Fibs levels and display on the chart.
How to use it:
The Fib levels drawn can be a potential support and resistance zone. Therefore in scenario where you already have a position and are approaching one of these levels it could be a point to close out some or all the position as you are approaching a resistance. On the other hand when price do approach these levels you could enter a position for a reversal trade. These are few ways to use the indicator but there are other ways that can be used, which can be found out by researching "Fibonacci (Fibs) Retracement".
In the example on the chart you can see a price bounce from the 0.7886 Fibs level on this particular day, where the price gapped up and was coming down after market hours opened.
Key settings:
1. Fibs Retracement Start and end Point: User selects where the Fibs levels should be drawn.
Available Options are:
Start Points:
Market Open
Market Open High (Dependent on the time frame you are on)
Pre-market High
Day's High
End Points:
Previous Day Close
Previous Day Low
Previous Day High
Pre-market Low (Current Day)
Day's Low
2. Custom Fib Levels: User can manually enter the Fib levels they want to see. (Max 9)
Default values are: 0,0.236,0.382,0.5,0.618,0.786,1,1.618,2.618.
3. Display settings: User can specify the line colour, thickness and style.
4. Label Setting: User can choose to turn on/off the labels for the each Fibs Level. Label will show the fib percentage and the corresponding price. User can also choose the location of the labels, defined by an offset from the current candle.
----------------------------------------------------------------------
If anything is not clear please let me know!
Premarket

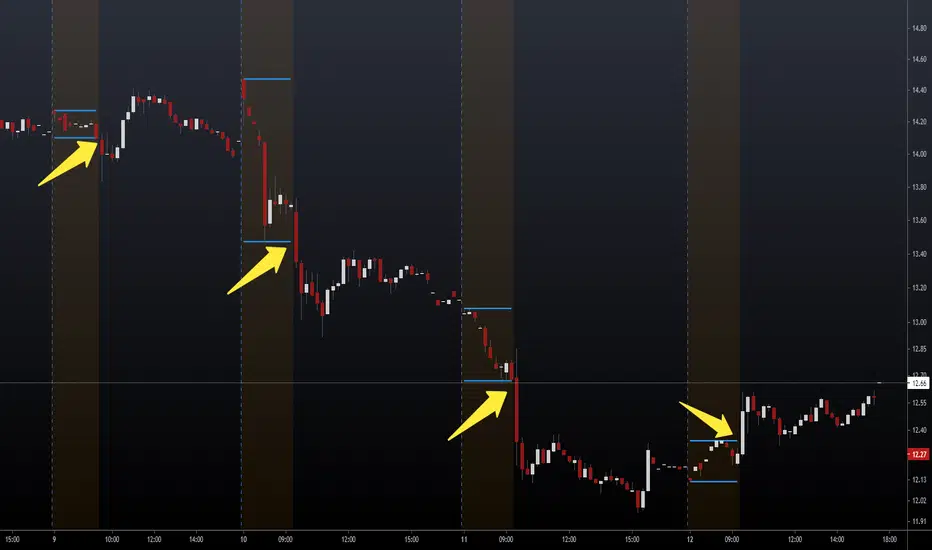
Intraday LevelsWhat it shows:
This indicator is useful for day trading, where it will track and display you important price levels which includes:
Premarket Low (PML)
Premarket High (PMH)
Previous Day Low (PDL)
Previous Day High (PDH)
Previous Day Close (PDC)
After Hours Low (AHL)
After Hours High (AHH)
Day Low (DL)
Day High (DH)
The price level lines and labels will automatically adjust itself as the price moves, eliminating the need of manually having to adjusting these levels.
How to use it:
At these levels it can act as important support resistance points during the day and can often serve as a important pivot point for any ticker. You can expect price rejection or bounce when the price approaches these levels.
Key settings:
For each of the levels, user can adjust in the settings menu:
Line Colour
Line Thickness
Line Style
Label Text
Price Labelling on Label
Label Location (Offset from current bar)
Ability to turn on/off the price level and label
Display levels for either all days or on the day

Pre-Market High/Low (Static Lines + Labels)
Pre-Market Range ✅
Draws the Pre-Market High & Low from 4:00 AM to 9:30 AM ET using accurate 1-minute intraday data.
Static Lines 📏
Plots dashed horizontal lines that remain visible all day across all timeframes — including 1m, 5m, 15m, 1h, 4h, and Daily.
Price Labels 🔖
Includes real-time price labels so you can easily reference exact pre-market levels on the chart.
Session Lock 🕒
Lines are locked in after 9:30 AM and remain visible even if you switch timeframes or turn off extended hours.
Trading Utility 🎯
Ideal for identifying key breakout levels, intraday support/resistance zones, and setting risk parameters.

Intraday Volume### Intraday Volume Indicator Explanation
--- this was Mostly created by OpenAI ChatGPT --- it's pretty good!
--- My Commentary: One of the problems I find is with Volume is - it is skewed by the overwhelming volume around the Open and Close. So, as an experiment, I asked ChatGPT to create an indicator to plot the volume everywhere BUT the open.
I added in the CandleColor() function and set the times.
I also changed the Intraday Volume calculation from Cumulative to live.
still Chat GPT - did about 90% of the heavy lift! And, wrote the summary !
----
The "Intraday Volume" indicator is a custom script designed for use on the TradingView platform. It provides a visual representation of the total accumulated trading volume during the intraday trading session, specifically between the market open and close times. Below is a detailed explanation of its functionality:
#### **Key Features:**
1. **Session Times:**
- The indicator defines the intraday session as the period between 9:30 AM EST (market open) and 4:00 PM EST (market close).
- It uses the `timestamp` function to set these times dynamically for each trading day.
2. **Intraday Volume Calculation:**
- During the defined intraday session, the indicator accumulates the trading volume from each bar (candlestick).
- Outside the intraday session, the volume is reset to `na` (not available) to ensure only intraday data is plotted.
3. **Plotting the Volume:**
- The accumulated intraday volume is plotted as a blue column chart in a separate pane below the price chart.
- This provides a clear visualization of how the trading volume evolves throughout the trading session.
4. **Horizontal Reference Line:**
- A horizontal line is added at zero as a visual reference, making it easier to interpret the volume data.
#### **Use Cases:**
- **Volume Analysis:**
- Traders can use the indicator to identify periods of high or low trading activity during the intraday session.
- Peaks in the volume chart may correspond to key market events, such as news releases or significant price movements.
- **Trend Confirmation:**
- Comparing intraday volume with price action can help traders confirm the strength of a trend or the likelihood of a reversal.
- **Custom Time Frames:**
- Although this script is tailored for regular U.S. market hours, it can be adapted for other markets or time zones by modifying the session times.
#### **Customization:**
- **Colors and Styles:**
- The plot color (blue) and style (columns) can be customized to suit user preferences.
- **Session Times:**
- Users can change the session start and end times to match their trading needs or regional market hours.
This indicator is especially useful for intraday traders seeking insights into trading volume dynamics within the trading day. By visualizing the intraday volume, traders can gain a deeper understanding of market behavior and make informed decisions.
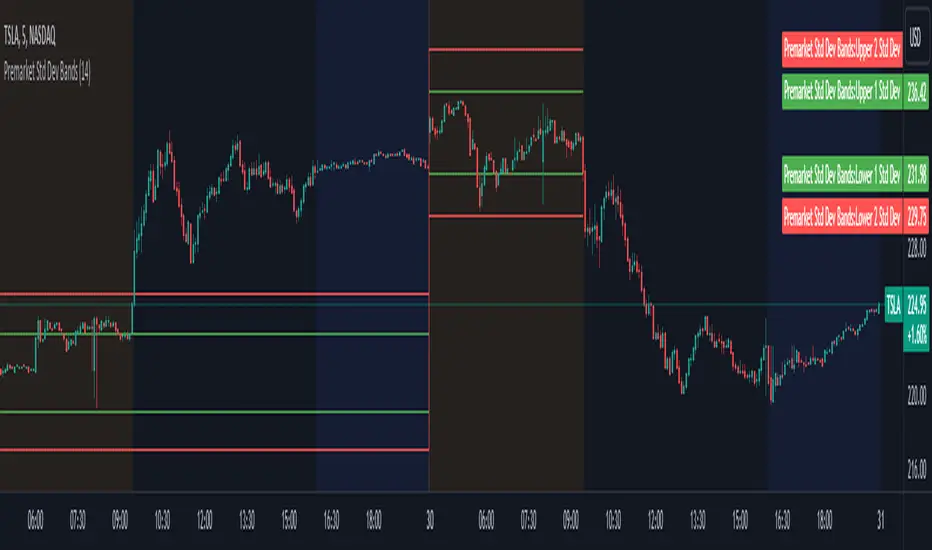
Premarket Std Dev BandsOverview
The Premarket Std Dev Bands indicator is a powerful Pine Script tool designed to help traders gain deeper insights into the premarket session's price movements. This indicator calculates and displays the standard deviation bands for premarket trading, providing valuable information on price volatility and potential support and resistance levels during the premarket hours.
Key Features
Premarket Focus: Specifically designed to analyze price movements during the premarket session, offering unique insights not available with traditional indicators.
Customizable Length: Users can adjust the averaging period for calculating the standard deviation, allowing for tailored analysis based on their trading strategy.
Standard Deviation Bands: Displays both 1 and 2 standard deviation bands, helping traders identify significant price movements and potential reversal points.
Real-Time Updates: Continuously updates the premarket open and close prices, ensuring the bands are accurate and reflective of current market conditions.
How It Works
Premarket Session Identification: The script identifies when the current bar is within the premarket session.
Track Premarket Prices: It tracks the open and close prices during the premarket session.
Calculate Premarket Moves: Once the premarket session ends, it calculates the price movement and stores it in an array.
Compute Averages and Standard Deviation: The script calculates the simple moving average (SMA) and standard deviation of the premarket moves over a specified period.
Plot Standard Deviation Bands: Based on the calculated standard deviation, it plots the 1 and 2 standard deviation bands around the premarket open price.
Usage
To utilize the Premarket Std Dev Bands indicator:
Add the script to your TradingView chart.
Adjust the Length input to set the averaging period for calculating the standard deviation.
Observe the plotted standard deviation bands during the premarket session to identify potential trading opportunities.
Benefits
Enhanced Volatility Analysis: Understand price volatility during the premarket session, which can be crucial for making informed trading decisions.
Support and Resistance Levels: Use the standard deviation bands to identify key support and resistance levels, aiding in better entry and exit points.
Customizable and Flexible: Tailor the averaging period to match your trading style and strategy, making this indicator versatile for various market conditions.
Premarket Levels [UkutaLabs]█ OVERVIEW
The Premarket Levels indicator measures the premarket high and low of any given market. The Premarket Levels creates potential strong resistance and support levels based on the premarket high and low which traders can use to gauge the market outlook ahead of the regular open.
The aim of this script is to simplify the trading experience of users by automatically identifying and displaying price levels that they should be aware of.
█ USAGE
At the beginning of the New York Session of each trading day at 1:30pm UTC time, this script will automatically identify the High and Low prices since the market opened at 10:00pm the night before. This happens automatically and in real time, ensuring that traders have access to this information as soon as the market is open.
These lines will extend until the end of the trading day, and also contain labels that display the price of each line. These labels can be disabled in the indicator's settings.
These levels indicate the total range of the market for that day until the open of the New York Session, and can be treated as levels of Support and Resistance after the market has opened.
█ SETTINGS
Configuration
• Show Labels: Determines whether labels are drawn within the range.
• Display Mode: Determines the number of days the script should load.
Range Settings
• High Color: Determines the color of the high lines and labels.
• Low Color: Determines the color of the low lines and labels.

Market Pivot Levels [Past & Live]Market Levels provide a robust view of daily pivot points of markets such as high/low/close with both past and live values shown at the same time using the recently updated system of polylines of pinescript.
The main need for this script arose from not being able to use plots for daily points because plots are inherently once drawn can't be erased and because we can't plot stuff for previous bars after values are determined we can't use them reliably. And while we can use traditional lines, because we would have extremely high amount of lines and we would have to keep removing the previous ones it wouldn't be that effective way for us. So we try to do it with the new method of polylines .
Features of this script:
- Daily High/Low Points
- Yesterday High/Low/Close Points
- Pre-Market High-Low points.
Now let's preview some of the important points of code and see how we achieve this:
With the code below we make sure no matter which chart we are using we are getting the extended hours version of sessions so our calculations are made safely for viewing pre-market conditions.
// Let's get ticker extended no matter what the current chart is
tc = ticker.new(syminfo.prefix, syminfo.ticker, session.extended)
Coding our own function to calculate high's and low's because inbuilt pinescript function cannot take series and we send this function to retrieve our high's and lows.
// On the fly function to calculate daily highlows instead of tv inbuilt because tv's length cannot take series
f_highlow(int last) =>
bardiff = last
float _low = low, float _high = high
for i = bardiff to 0 by 1
if high > _high
_high := high
if low < _low
_low := low
With doing calculations at the bars of day ending points we can retrieve the correct points and values and push them for our polylines array so it can be used in best way possible.
// Daily change points
changeD = timeframe.change("D")
// When new day starts fill polyline arrays with previous day values for polylines to draw on chart
// We also update prevtime values with current ones after we pushed to the arrays
if changeD
f_arrFill(cpArrHigh, cpArrLow, prevArrh, prevArrl, prevArrc, prevMarh, prevMarl)
valHolder.unshift(valueHold.new(_high, _low, _high, _close, _low, time, pr_h, pr_l))
The rest of the code is annotated and commented. You can let me know in comments if you have any questions. Happy trading.

Scoopy StacksWaffle Around Multiple
(Open, High, Low, Close) Stacks On
Pre/Post Market & (Daily, Weekly,
Monthly, Yearly) Sessions With
Meticulous Columns, Rows, Tooltips,
Colors, Custom Ideas, and Alerts.
Sessions Use Two Step Incremental Values
Default Value: (1) Shows Two Previous
(O, H, L, C); Increasing Value Swaps
Sessions With Next Two Stacks.
⬛️ KEY WORDS:
🟢 Crossover | 🔴 Crossunder
📗 High | 📕 Low
📔 Open | 📓 Close
🥇 First Idea | 🥈 Second Idea
🥉 Third Idea | 🎖️ Fourth Idea
🟥 ALERTS:
Default Option: (Per Bar)
Alerts Once Conditions Are Met
(Bar Close) Alerts When Bar Closes
Default Option: (Reg)
Alerts During Regular Market
Trading Hours, (0930-1600)
(Ext) Alerts During Extended
Market Hours, (1600-0930)
(24/7) Alerts All Day
Optional Preferences:
Regular Alerts - Stocks
Extended Alerts - Futures
24/7 Alerts - Crypto
🟧 STACKS:
Default Value: (1)
Incremental Stack Value, Increasing Value
Swaps Sessions With the Next Two Stacks
(✓) Swap Stacks?
Pre/Post Market High/Lows,
1-2 Day High/Lows, 1-2 Week High/Lows,
1-2 Month High/Lows, 1-2 Year High/Lows
( ) Swap Stacks?
Pre/Post Market Open/Close,
1-2 Day Open/Close, 1-2 Week Open/Close,
1-2 Month Open/Close, 1-2 Year Open/Close
🟨 EXAMPLES:
Default Stack:
🟢 | 📗 Pre Market High (PRE) | 4600.00
🔴 | 📕 Post Market Low (POST) | 420.00
Optional: (Open)
🟢 | 📔 Post Market Open (POST) | 4400.00
Optional: (Close)
🔴 | 📓 Pre Market Close (PRE) | 430.00
Default Stack Value: (1)
🔴 | 📗 1 Day High (1DH) | 460.00
Next Stack Value: (3)
🟢 | 📕 4 Day Low (4DL) | 420.00
Optional: (Open)
🔴 | 📔 2 Day Open (2DO) | 440.00
Optional: (Close)
🟢 | 📓 3 Day Close (3DC) | 430.00
Default Stack Value: (5)
🟢 | 📗 5 Week High (5WH) | 460.00
Next Stack Value: (7)
🔴 | 📕 8 Week Low (8WL) | 420.00
Optional: (Open)
🔴 | 📔 7 Week Open (7WO) | 4400.00
Optional: (Close)
🟢 | 📓 6 Week Close (6WC) | 430.00
Default Stack Value: (9)
🔴 | 📗 9 Month High (9MH) | 460.00
Next Stack Value: (11)
🟢 | 📕 12 Month Low (12ML) | 420.00
Optional: (Open)
🟢 | 📔 11 Month Open (11MO) | 4400.00
Optional: (Close)
🔴 | 📓 10 Month Close (10MC) | 430.00
Default Stack Value: (13)
🟢 | 📗 13 Year High (13YH) | 460.00
Next Stack Value: (15)
🟢 | 📕 16 Year Low (16YL) | 420.00
Optional: (Open)
🔴 | 📔 15 Year Open (15YO) | 4400.00
Optional: (Close)
🔴 | 📓 14 Year Close (14YC) | 430.00
🟩 TABLES:
Default Value: (1)
Moves Table Up, Down, Left, or Right
Based on Second Default Value
First Default Value: (Top Right)
Sets Table Placement, Middle Center
Allows Table To Move In All Directions
Second Default Value: (Default)
Fixed Table Position, Switching Values
Moves Direction of the Table
🟦 IDEAS:
(✓) Show Ideas?
Shows Four Ideas With Custom Texts
and Values; Ideas Are Based Around
Post-It Note Reminders with Alerts
Suggestions For Text Ideas:
Take Profit, Stop Loss, Trim, Hold,
Long, Short, Bounce Spot, Retest,
Chop, Support, Resistance, Buy, Sell
🟪 EXAMPLES:
Default Value: (5)
Shows the Custom Table Value For
Sorted Table Positions and Alerts
Default Text: (🥇)
Shown On First Table Cell and
Message Appearing On Alerts
Alert Shows: 🟢 | 🥇 | 5.00
Default Value: (10)
Shows the Custom Table Value For
Sorted Table Positions and Alerts
Default Text: (🥈)
Shown On Second Table Cell and
Message Appearing On Alerts
Alert Shows: 🔴 | 🥈 | 10.00
Default Value: (50)
Shows the Custom Table Value For
Sorted Table Positions and Alerts
Default Text: (🥉)
Shown On Third Table Cell and
Message Appearing On Alerts
Alert Shows: 🟢 | 🥉 | 50.00
Default Value: (100)
Shows the Custom Table Value For
Sorted Table Positions and Alerts
Default Text: (🎖️)
Shown On Fourth Table Cell and
Message Appearing On Alerts
Alert Shows: 🔴 | 🎖️ | 100.00
⬛️ REFERENCES:
Pre-market Highs & Lows on regular
trading hours (RTH) chart
By Twingall
Previous Day Week Highs & Lows
By Sbtnc
Screener for 40+ instruments
By QuantNomad
Daily Weekly Monthly Yearly Opens
By Meliksah55

Ribbit RangesBounce Around Multiple
(Open, High, Low, Close) Ranges
On Pre/Post Market & (Daily, Weekly,
Monthly, Yearly) Sessions With
Meticulous Lines, Labels, Tooltips,
Colors, Custom Ideas, and Alerts.
Sessions Use Two Step Incremental Values
Default Value: (1) Shows Two Previous
(O, H, L, C); Increasing Value Swaps
Sessions With Next Two Ranges.
⬛️ KEY WORDS:
🟢 Crossover | 🔴 Crossunder
📗 High | 📕 Low
📔 Open | 📓 Close
🥇 First Idea | 🥈 Second Idea
🥉 Third Idea | 🎖️ Fourth Idea
🟥 ALERTS:
Default Option: (Per Bar)
Alerts Once Conditions Are Met
(Bar Close) Alerts When Bar Closes
Default Option: (Reg)
Alerts During Regular Market
Trading Hours, (0930-1600)
(Ext) Alerts During Extended
Market Hours, (1600-0930)
(24/7) Alerts All Day
Optional Preferences:
Regular Alerts - Stocks
Extended Alerts - Futures
24/7 Alerts - Crypto
🟧 RANGES:
Default Value: (1)
Incremental Range Value, Increasing Value
Swaps Sessions With the Next Two Ranges
(✓) Swap Ranges?
Pre/Post Market High/Lows,
1-2 Day High/Lows, 1-2 Week High/Lows,
1-2 Month High/Lows, 1-2 Year High/Lows
( ) Swap Ranges?
Pre/Post Market Open/Close,
1-2 Day Open/Close, 1-2 Week Open/Close,
1-2 Month Open/Close, 1-2 Year Open/Close
🟨 EXAMPLES:
Default Range:
🟢 | 📗 Pre Market High (PRE) | 4600.00
🔴 | 📕 Post Market Low (POST) | 420.00
Optional: (Open)
🟢 | 📔 Post Market Open (POST) | 4400.00
Optional: (Close)
🔴 | 📓 Pre Market Close (PRE) | 430.00
Default Range Value: (1)
🔴 | 📗 1 Day High (1DH) | 460.00
Next Range Value: (3)
🟢 | 📕 4 Day Low (4DL) | 420.00
Optional: (Open)
🔴 | 📔 2 Day Open (2DO) | 440.00
Optional: (Close)
🟢 | 📓 3 Day Close (3DC) | 430.00
Default Range Value: (5)
🟢 | 📗 5 Week High (5WH) | 460.00
Next Range Value: (7)
🔴 | 📕 8 Week Low (8WL) | 420.00
Optional: (Open)
🔴 | 📔 7 Week Open (7WO) | 4400.00
Optional: (Close)
🟢 | 📓 6 Week Close (6WC) | 430.00
Default Range Value: (9)
🔴 | 📗 9 Month High (9MH) | 460.00
Next Range Value: (11)
🟢 | 📕 12 Month Low (12ML) | 420.00
Optional: (Open)
🟢 | 📔 11 Month Open (11MO) | 4400.00
Optional: (Close)
🔴 | 📓 10 Month Close (10MC) | 430.00
Default Range Value: (13)
🟢 | 📗 13 Year High (13YH) | 460.00
Next Range Value: (15)
🟢 | 📕 16 Year Low (16YL) | 420.00
Optional: (Open)
🔴 | 📔 15 Year Open (15YO) | 4400.00
Optional: (Close)
🔴 | 📓 14 Year Close (14YC) | 430.00
🟩 COLORS:
(✓) Swap Colors?
Text Color Is Shown Using
Background Color
( ) Swap Colors?
Background Color Is Shown
Using Text Color
🟦 IDEAS:
(✓) Show Ideas?
Plots Four Ideas With Custom Lines
and Labels; Ideas Are Based Around
Post-It Note Reminders with Alerts
Suggestions For Text Ideas:
Take Profit, Stop Loss, Trim, Hold,
Long, Short, Bounce Spot, Retest,
Chop, Support, Resistance, Buy, Sell
🟪 EXAMPLES:
Default Value: (5)
Shows the Custom Value For
Lines, Labels, and Alerts
Default Text: (🥇)
Shown On First Label and
Message Appearing On Alerts
Alert Shows: 🟢 | 🥇 | 5.00
Default Value: (10)
Shows the Custom Value For
Lines, Labels, and Alerts
Default Text: (🥈)
Shown On Second Label and
Message Appearing On Alerts
Alert Shows: 🔴 | 🥈 | 10.00
Default Value: (50)
Shows the Custom Value For
Lines, Labels, and Alerts
Default Text: (🥉)
Shown On Third Label and
Message Appearing On Alerts
Alert Shows: 🟢 | 🥉 | 50.00
Default Value: (100)
Shows the Custom Value For
Lines, Labels, and Alerts
Default Text: (🎖️)
Shown On Fourth Label and
Message Appearing On Alerts
Alert Shows: 🔴 | 🎖️ | 100.00
⬛️ REFERENCES:
Pre-market Highs & Lows on regular
trading hours (RTH) chart
By Twingall
Previous Day Week Highs & Lows
By Sbtnc
Screener for 40+ instruments
By QuantNomad
Daily Weekly Monthly Yearly Opens
By Meliksah55

Extended Hour CandleThe Extended Hour Candle shows extended hour candle formations on the Daily chart. This indicator can be useful for those who want to analyse price movements during extended trading sessions without switching to intraday charts with "Extended trading hours" enabled.
How to Use:
Add the Extended Hour Candle indicator to a TradingView chart.
Adjust the color settings according to personal preferences, using the options to set the desired colors for up and down candles.
See the Candle during extended trading hours on the Daily chart

EMA 08:00// Some traders prefer to start the charts at 8am in the morning.
// This chart setting is not possible as of today, but the following script lets you calculate ema for a defined time range.
// Right now it is set to include bars from 08:00 to 23:59, meaning that early pre market 04:00 to 07:59 is left out.

Show Extended Hours (Futures & Crypto)OVERVIEW
This indicator mimics TradingViews "Extended trading hours" background color settings. It is most useful on symbols that do not conventionally have extended hours, but are available to trade during those hours (ie. Futures and Crypto). Because market participation (ie. volatility) in a given symbol can change dramatically at or near these transitions, seeing conventional market open / closures expedites price action context around these transitions.
INPUTS
You can configure:
Background colors for both Premarket and After Hours
Which extended hours you would like to see
Market Hours and Time Zone

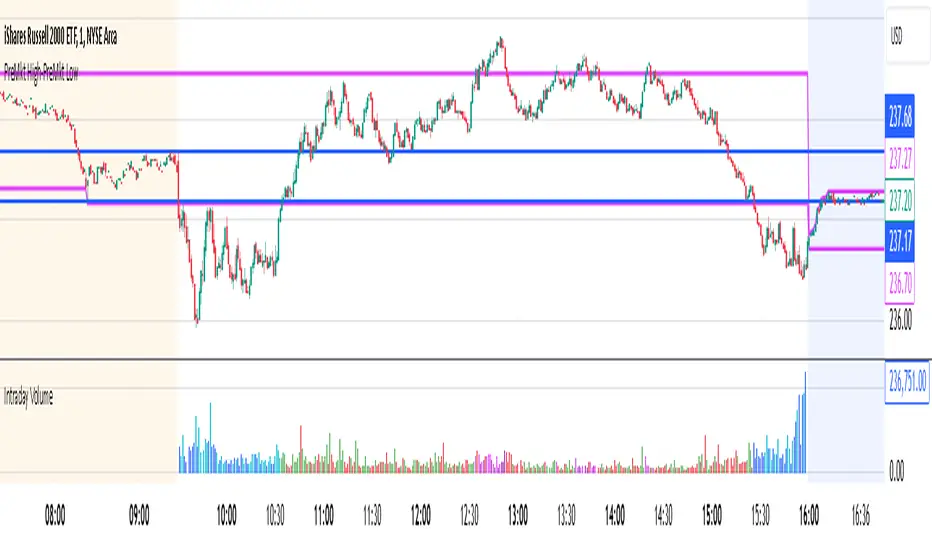
Key Levels (Open, Premarket, & Yesterday)OVERVIEW
This indicator automatically identifies and draws recent high-probability support and resistance levels (recent key levels). Specifically, yesterdays highs / lows, premarket highs / lows, as well as yesterdays end of day Volume Weighted Average Price and trader specified Moving Average.
This is most useful on charts with intraday time frames (1 minute, 5 minute etc.) commonly used for day trading. This is not ideal for larger time frames (greater than 1 hour) commonly used for swing trading or identifying larger trends.
INPUTS
You can configure:
Line size, style, and colors
Label colors
Which key levels you want to see
Moving Average Parameters
Market Hours and Time Zone
DEV NOTES
This script illustrates:
A method for iterative management of more complex data objects (not just discrete values) with loops and arrays.

Extended Session High/Low - Intraday and daily chartsThis script plots the extended session highest high and lowest low levels. It works on any time frame from 1 minute to daily.
Please note that during the extended session, TradingView stops updating the daily chart. This means that once the script is loaded on a daily chart, it will not be updated until the market opens, unless you manually reload the layout (Ctrl+R). For this reason, it is recommended to use a multi-timeframe layout, so when the pre/post market line is near the extended session high/low on the daily chart, you can compare these values with those on an intraday chart of the same ticker.
The extended session high/low are important for day traders because they represent the maximum and minimum limits within which the trades have taken place during the extended trading hours. This can make them levels of support/resistance that can be useful for planning trend following, reversal and range-bound strategies.
By displaying the extended session high/low on the daily chart, traders can also see if there are any significant levels nearby that are related to the daily time frame, such as trendlines, support/resistance levels, or moving averages. This can help the trader evaluate whether there is enough room for a price movement in the direction of his trading strategy.

AfterHours Spike DetectorThe script pulls Lower Timeframe (30min) data to draw High/Low of Out-of-hours/AfterHours session (post-market session & next day pre-market session) on the Daily regular session chart. It then identifies significant AfterHours price changes and what happens to these price Spikes by the Open of the next day regular session.
You can change:
wether to show AfterHours High/Lows
wether to show AfterHours price Spikes
the AfterHours price Spike threshold (default = +/- 10%)
[Pt] Premarket Breakout StrategyThis is a 1 trade per day strategy for trading SPY or QQQ index. By default, this is designed for 1 min time frame. This was an experimental script that seems to be profitable at the time of publication.
How it works:
Pre-market high and low is defined per trading day between 9:00 to 9:30 EST.
Then we looking for the first breakout on either PM high or PM low.
- Breakout high = long trade
- Breakout low = short trade
If long trade, we wait until Stochastic RSI D signal line to hit a lower threshold (18 by default). Then we enter long when K crosses above D line.
If short trade, we wait until Stochastic RSI D signal line to hit an upper threshold (82 by default). Then we enter short when K crosses below D line.
Stop loss for long
- set to PM low if entry is above PM high + %ATR buffer
- or set to PM range + %ATR buffer
Stop loss for short
- set to PM high if entry is below PM low + %ATR buffer
- or set to PM range + %ATR buffer
Profit target is set to 2x the risk by default.
*Note: Different Stochastic RSI lengths should be used if trading 5 min time frame. See tooltip.
Happy trading~~!

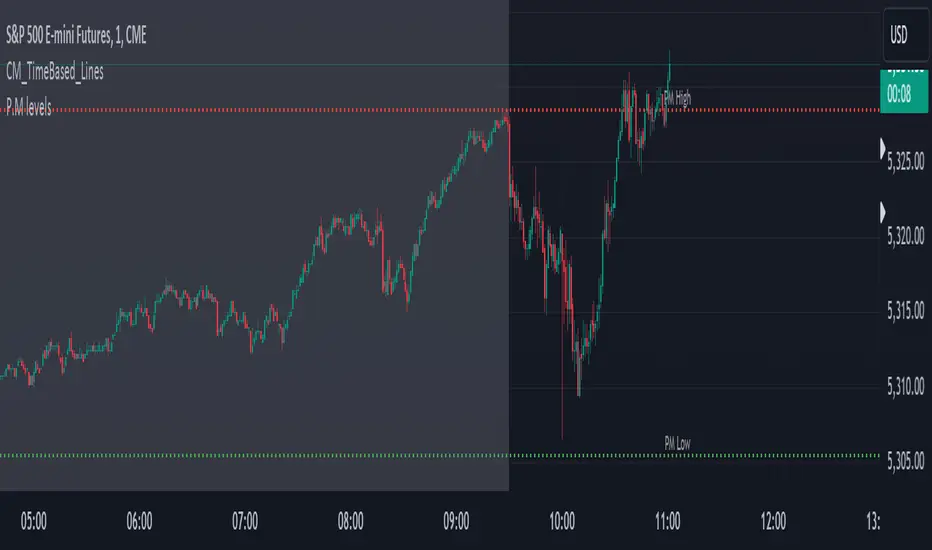
Pre-Market levels for Futures This indicator draws the Pre-Market Low and High for futures. Futures do not really have "P.M" because they are almost always open, but I chart /ES and trade $SPY options, so this has been useful in finding P.M levels.
4C Daily Levels Suite + Premarket High/LowThis '4C Daily Levels Suite + Premarket High/Low' indicator is a clean way to automatically plot important daily levels including:
Prior Day High
Prior Day Low
Prior Day Close
50% level between Prior High/Low
Today's Open
Today's Premarket Low+High
This Daily Levels indicator is unique in its ability to:
-Plot all of the daily level PLUS premarket high/low levels (extended hours must be turned ON)
-Can hide past days levels, only plotting levels on the current day, to keep chart cleaner
-Can extend line levels right or fullscreen
-Plots the level price at each level on the chart
-Can show/hide price levels labels
-Can add supplemental premarket levels plot to show levels being formed during the premarket time period
-Coded with line.new vs plot so dashed lines are available as a style
-Automatically hides the indicator if the timeframe selected is Daily or greater
SEE SCREENSHOT EXAMPLES BELOW
Default mode, with extended hours showing:
With supplemental premarket plot showing:
Default mode without extended hours showing:
Showing past day’s levels
Extend lines to fullscreen
Some parts of this code were adapted from 'pd Levels' by CryptoCurl

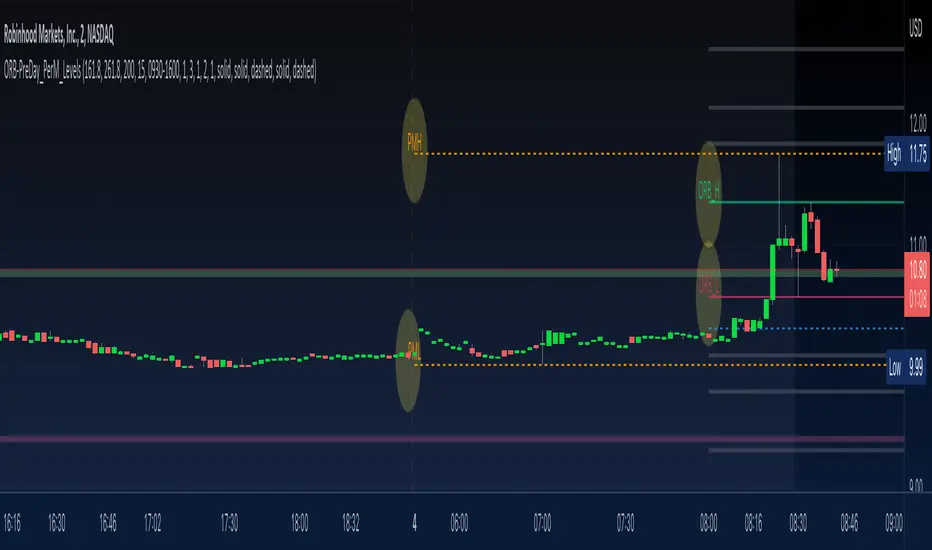
ORB-PreDay_PerM_LevelsThis script provides following levels:
1. ORB Level - You can adjust the timeframe of Opening Range (plots from 9am to 4pm)
2. ORB Fib Extension - 1.618 and 2.618 Fibonacci Extension of ORB High and Low (plots from 9am to 4pm)
3. Previous Day High/Low/Close - You can adjust color/thickness of the lines (plots from two days ago so that you can clearly see the levels)
4. Previous Two Days High/Low (plots from two days ago so that you can clearly see the levels)
5. Pre-Market High/Low (plots from 6:30am to 11am)
All in one indicator gives much better clarity of where current instrument is trading in relation to ORB, Previous Day Levels and Previous Two Days Levels along with Pre Market Levels.
You could combine these levels with your favorite EMA or EMA Cloud to create a trading system.
You could combine these levels with MA Cloud and ATR vs DTR script to gauge the move.
Look at the TWTR Chart today and see how these levels are respected.
Lepelle's Key LevelsCredit to original code goes to paaax and NSDT. Modified to include premarket H/L levels and to show only daily levels. Indicator includes Close levels.
-US Premarket High and Low Levels
-Daily OHL Levels (No close included)
-Yesterday and Previous day OHLC level
-Labels and ability to modify user preferences (color, line)

PreMarketStatsThe idea is to catch pre market information (or other relevant data), that basically consists of a single number, in a table instead of using a plot that takes up space in the chart. In this example, I added pre market volume and pre market change in %. Where the second one is as well available in the details tab of the stock, it is not available if this tab is closed or during replays.
NYSE extended session backgroundThis script adds background to the chart to highlight different time areas in any chart.
The time areas are in relation to the open/close time of NYSE , both regular and extended session.
The background colors are the following by default:
NO COLOR : NYSE is open
DARK BLUE : NYSE is closed
LIGHT BLUE : NYSE post market session
ORANGE : NYSE pre market session
In addition, previous day close price line is shown during extended and closed sessions (orange line).
This script is useful to visualize any chart in relation to the NYSE timetable.
NSDT Pre-Market Breakout LevelsA simple way to identify potential breakouts at the New York market open. This indicator plots the high and low of the New York Pre-Market, providing a great visual of a potential breakout levels.