Fibonacci Levels for Recent CandlesThis Pine Script indicator calculates and plots 17 predefined Fibonacci retracement levels based on the high and low of a user-defined number of previous candles. The levels are drawn on the chart for the most recent candles, as specified by the user, allowing traders to see how these historical Fibonacci levels align with the current price action.
Previous
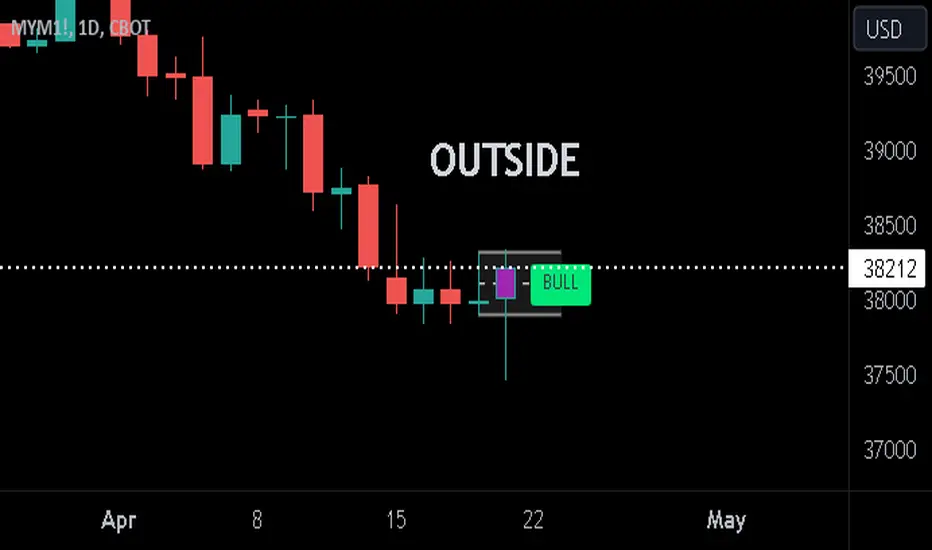
Previous Candle + Inside/OutsideThe script uses the previous candle of the current timeframe to assess the state of the current candle.
1. Previous candle high/low and midpoint are displayed
2. Highlights current bar if INSIDE previous candle
3. Highlights current bar if POTENTIAL OUTSIDE bar. This condition uses the logic that if the previous high/low has been swept and price then reaches previous bar 50%, then an OUTSIDE bar is possible.
4. If current candle breaks previous high/low, a label is added to identify.
5. If above condition is true and current candle color is opposite of previous, then label is highlighted to show possible bull/bear condition.
6. If current candle live price is below previous midpoint, a BEAR label is shown
7. If current candle live price is above previous midpoint, a BULL label is shown
I personally use the indicator on Daily/Weekly/Monthly charts to help with my overall market assessment. However users may find their own use for the indicator...or modify it to their own preferences.
As ever, the indicator should only be used with live trading accounts after thorough backtesting using a large data range.
OHLC MTFThe script allows you to plot the opening, highest, lowest and closing (ohlc) values of a previous candle.
Settings :
- "Time Frame" : allows you to choose the reference time frame;
- "Offset" : sets which candle to select the data from.
Ex : If you select "1 day" as the time frame and "1" as the offset, the OHLC values of yesterday's daily candle will be displayed (regardless of your current time frame).

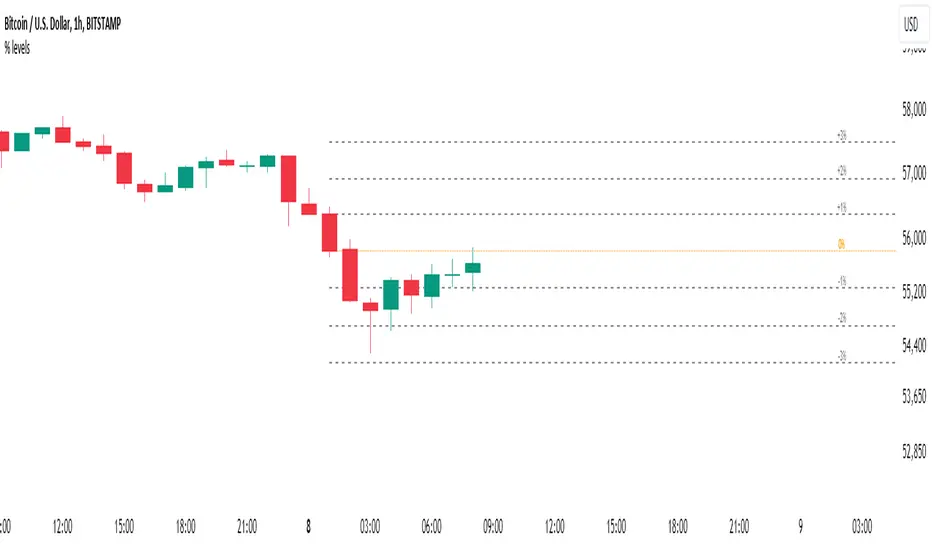
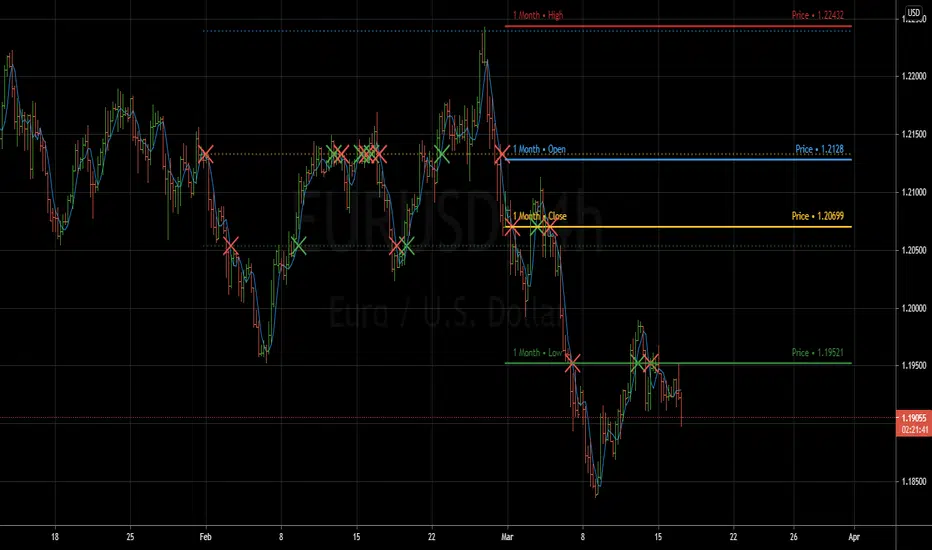
Percent Levels From Previous CloseThis indicator plots on the chart +/- 1% / 2% / 3% ranges based on the previous day's close levels.
Disclaimer :
Success in trading is all about following your trading strategy and indicators should fit into your own strategy, and not be traded purely on.
This script is for informational and educational purposes only. Use of the script does not constitute professional and / or financial advice. You are solely responsible for evaluating the outcome of the script and the risks associated with using the script. In exchange for the use of the script, you agree not to hold monpotejulien TradingView user responsible for any possible claims for damages arising out of any decisions you make based on the use of the script.
4C Daily Levels Suite + Premarket High/LowThis '4C Daily Levels Suite + Premarket High/Low' indicator is a clean way to automatically plot important daily levels including:
Prior Day High
Prior Day Low
Prior Day Close
50% level between Prior High/Low
Today's Open
Today's Premarket Low+High
This Daily Levels indicator is unique in its ability to:
-Plot all of the daily level PLUS premarket high/low levels (extended hours must be turned ON)
-Can hide past days levels, only plotting levels on the current day, to keep chart cleaner
-Can extend line levels right or fullscreen
-Plots the level price at each level on the chart
-Can show/hide price levels labels
-Can add supplemental premarket levels plot to show levels being formed during the premarket time period
-Coded with line.new vs plot so dashed lines are available as a style
-Automatically hides the indicator if the timeframe selected is Daily or greater
SEE SCREENSHOT EXAMPLES BELOW
Default mode, with extended hours showing:
With supplemental premarket plot showing:
Default mode without extended hours showing:
Showing past day’s levels
Extend lines to fullscreen
Some parts of this code were adapted from 'pd Levels' by CryptoCurl

Previous Period Levels - X Alerts====== ABOUT THIS INDICATOR
- A simple but highly customisable display of previous higher time-frame
OHLC values, drawn using line.new and label.new. Nothing fancy but...
- Customised resolution input which excludes time frames lower than 1 hour
while extending the common higher reference inputs to include:
• 6, and 12 Hour
• 5 Day
• 3, and 6 Month
• 1 Year
- Alert conditions using an adjustable SMA to help reduce false positive
spam.
- Full visual customisation options for (almost) every aspect, so it can be
tuned to suit most individual preferences.
- In line with the miriad visual customisation options is the ability to
change the display format of the Labels, to show more or less information,
or disable them altogether.
====== REASON FOR STUDY
- To practice advanced user input option handling to allow for a full visual
customisation experience without stepping outside of, or interfering with,
the intended function of the indicator.
- Provide reasonably clear code commenting and structure in order to be
useful as a potential learning aid for others, and future reference for
myself.
====== DISCLAIMER
Any trade decisions you make are entirely your own responsibility.
I've made an effort to squash all the bugs, but you never know!
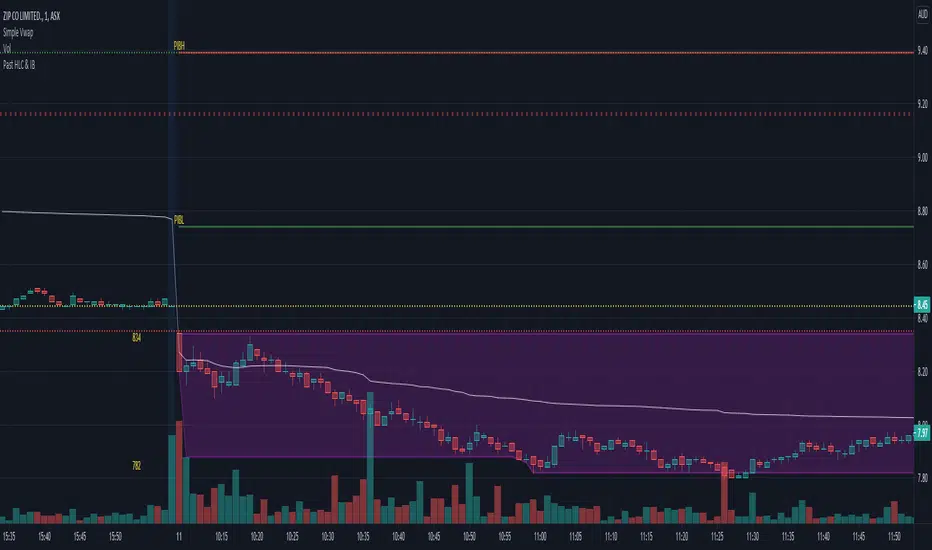
Initial Balance (IB) and Previous Day / Week High, Low & ClosePlots Historical key levels for volume profile idea.
Plots the following:
- Previous Day High
- Previous Day Low
- Previous Day Close
- Previous Day IB High
- Previous Day IB Low
- Current Days IB High
- Current Days IB Low
IB is based on first hour of trading.
Made specifically for ASX stocks, have not tested it on other exchanges or assets.
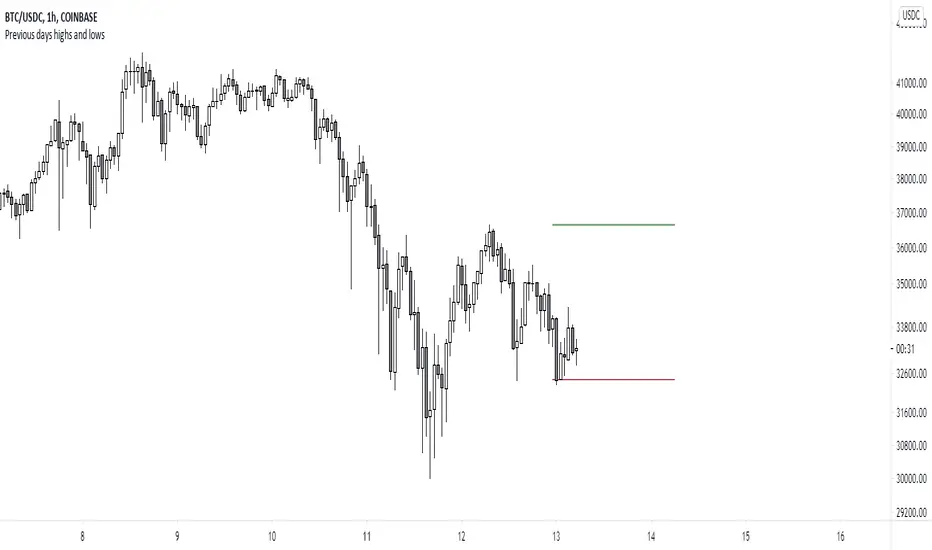
Previous days highs and lowsA script which marks a line pointing the highs and lows of the previous trading day.
HG Scalpius - Previous Bar HighlightHG Scalpius - Previous Bar Highlight
This indicator highlights the 20th bar from the current bar and has the below applications for trading the HG Scalpius system:
- Determining if trend mode off switch is triggered, failing to set a new higher (lower) close in the trend with 20 bars
- Determining the highest (lowest) bar in the previous range to decide if a trade is high & tight
bars_back = input(defval=20, minval=0, title="Bars Back")
bgcolor(#9C27B0, offset=-bars_back, show_last=1)
If you come across or think of any other useful scripts for the HG Scalpius system please comment below!
Happy trading!

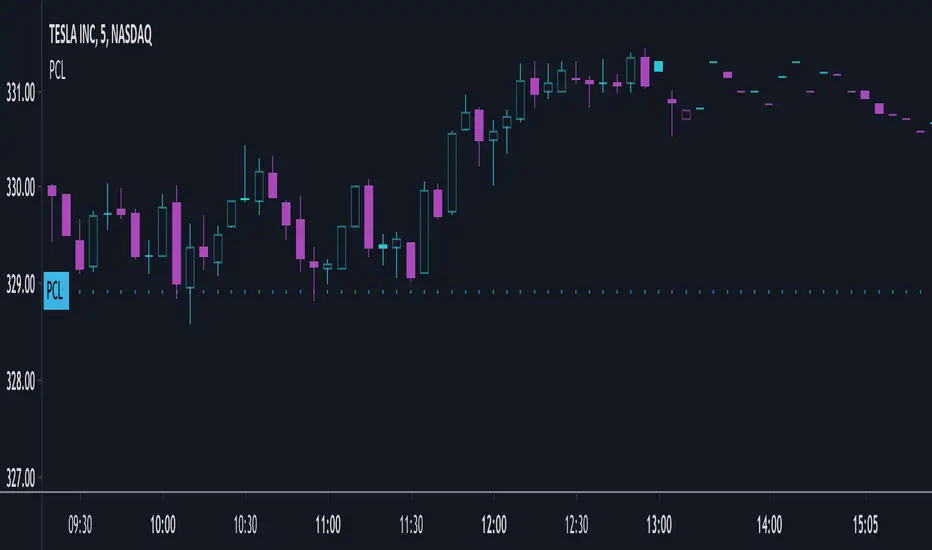
(PCL) Previous CloseI have recently been reading How to Day Trade for a Living by Andrew Aziz and one of the important support and resistance levels he talks about is the Previous Day Close Price.
I did not find an indicator that would simply plot this so I wrote a short simple pine script to plot the indicator.
Please feel free to edit or suggest improvements.
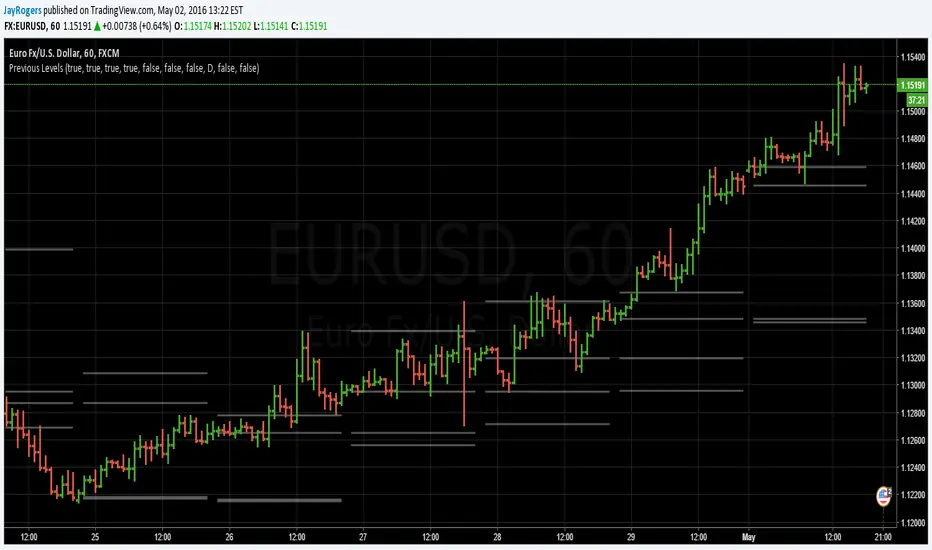
Previous OHLC LevelsQuick dirty code for personal use. Plots previous OHLC levels based on a selected time-frame on the chart.
Not bad if you want to see different time-frame levels.
Fill function can serve to highlight the daily range (high-low or open-close) on non-standard charts
Uses base code from JayRogers


Range: OHLC vs Previous OHLCThis will plot your choice of OHLC (or any of the averaging choices) of the current candle compared to the previous candle.
For example if you choose "high" for the input and set the chart to daily, you'll see the currently daily high vs the previous daily high.
Green candle represent a higher high and the length of the candle represents how much higher.
Red candles represent a lower high than the previous day and the length is by how much lower.
This indicator is pretty straight forward, look for me to build on this with something a little more elaborate in the near future.

Previous Period LevelsDescription:
It's just levels of previous periods, with the inclusion of 4 hour and and month. Nothing special.
Setup:
Should be mostly self explanatory... but selecting either the 4 hour or month check boxes will override the dropdown selection.
Checking both the 4 hour and month boxes together will cause it to default to whatever has been selected in the dropdown.