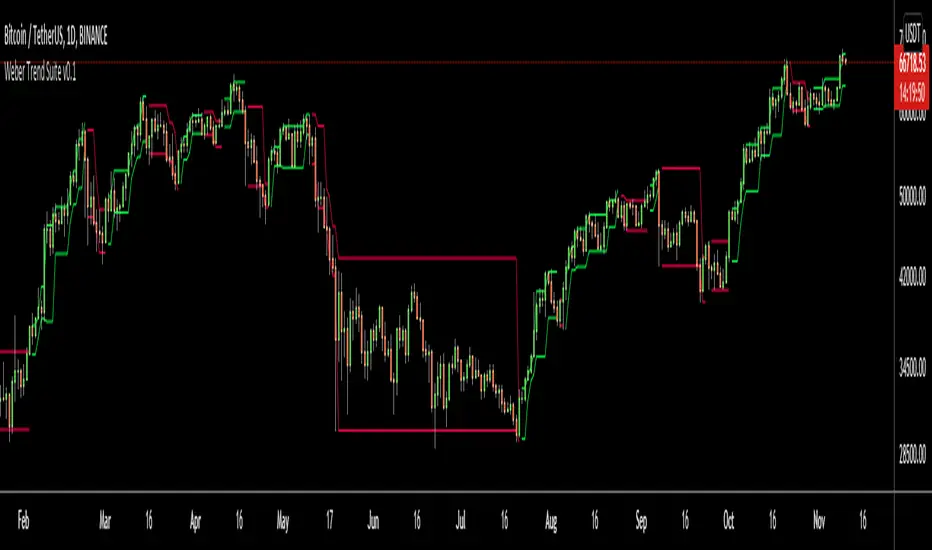
Weber Trend SuiteThe Weber Trend Suite (WTS) supports trend trading over longer timeframes.
Identification of the trend direction
Automatic identification of support and resistance level
Multi-Timeframe
Designed as a decision making framework for trading trending growth assets such as tech stocks and cryptocurrencies
The support and resistance lines are derived from the high, low and direction (bearish/bullish) from the latest outside bar at a time. The timeframe on which outside bars are detected can be chosen freely by the user. The importance of an outside bars tends to increase with the timeframe. Outside bars can play an important role in price action trading by providing support and resistance levels as well as the currently predominant trend direction. So this indicator enables a trader to automatically display the high, low and direction of the current outside bar from two different (usually higher) timeframes and therefore gives rationally and automatically derived support and resistance levels as well as the predominant trend direction from the chosen timeframes. The adjustable crossing EMA with its volatility noise filter gives further guidance on the current trend direction and strength.
The WTS can help traders and investors following a rule based system by providing a measure of trend strength and consistency as well as specific support and resistance levels.
Priceaction
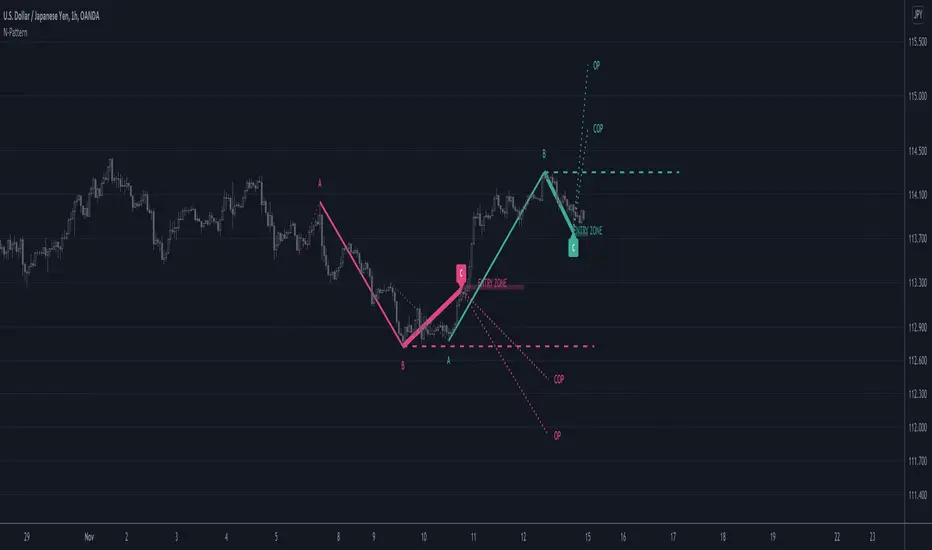
N PatternThis indicator looks for N patterns on the chart and illustrates them.
It predicts the future point D from the most recent point C and the past points A and B.
Settings:
Pivot Right bar / Pivot Left bar
Pivot settings.
Lookback
Go back a specified number of bars to find point A.
When point A is found, the opposite vertex in between is point B.
Nearest Bars Count
If the most recent C point and the previous C point are too close, the previous C point will be hidden.
Specify the number of bars to determine if they are too close.
Objectives
There are three types of D points, which are future prices.
Each can be shown or hidden.
Support/Resistance
Draw a line extending horizontally from point B as a support line or resistance line.
+ ATR Support and ResistanceThis, a very different script from most of mine, is my attempt at making a useful, and not messy, support and resistance indicator. If you've never looked into trader xkavalis, and his scripts and discord, I would highly recommend it. He talks about "pay attention candles" a lot. It got me thinking about what those are. Best as I can tell all he means by that phrase is large, impulsive candles. Sometimes these lead to break outs of ranges, or they may signal tops, bottoms, or near-tops and bottoms. The only way I could make sense of this in a mathematical way was by using the average true range. Basically, any candle's true range outside of the ATR is considered a "pay attention candle," by my definition.
This script originally began as just a candle coloring exercise with some optional shapes plotted above/below certain candles, but I quickly realized I wanted to draw lines or zones from these candles, so eventually, after many hours spent figuring out and learning 'line.new' and 'box.new' I got things sorted.
Essentially, my line of thinking is that on impulsive candles down, the origin of the impulse is more important than the close (not always of course, as there are no unbreakable rules in what markets can do), and with impulsive candles up, the same theory applies.
So, for upward impulsive candles I've marked out the zone from the open to the low as a support (until broken, in which case it may become resistance). For downward impulsive candles the zone encompasses the open to the high. I've given the option to plot a line from the close for all of these. It's turned off by default as it's just less stuff on the chart, but you may like it.
The line length is customizable in a menu. It does funny things on low timeframes on forex and stock charts (long lines that result in chart compression), but for some reason very rarely on crypto charts. If someone who is smart (not me) and has much experience with pinescript could perhaps help me out with a fix for this, that would be great. I suspect it has something to do with my "bar_index_duration" that I defined using the time function, but I'm not sure how or why.
Line length on time frames of one hour and up it is typically fine.
Use the ATR multiple to change the sensitivity of the indicator. This is basically the determination of when a candle is beyond the ATR. A multiple of two is two times the ATR. With lower volatile pairs you can maybe make this lower. On lower time frames or with more volatile pairs (illiquid alts in particular) a higher multiple might serve better. I find the default 1.75 is mostly acceptable.
As I started this I also thought adding some sort of volume information to the candles might be useful as well, so I added a simple candle coloring feature referencing the OBV and a 21 period EMA. Candles are colored based on the OBV's relation to its moving average.
I added some plot shapes and candle coloring utilizing the RSI as well. Options to turn on or off shapes plotted for overbought and oversold across the top of the chart. The most interesting feature that I implemented here is a support/resistance zone around the centerline of the RSI. If the RSI is between 49 and 51 then you can have optional candle coloring, shapes plotted above the candles, and s/r zones drawn on the chart. In trending markets the centerline of the RSI will frequetly act as support or resistance, so by being alerted of this condition on the chart you can use that with actual levels marked off in order to help make a judgement on a trade. I think it's a nice addition, and an oft overlooked aspect of the usefulness of the RSI.
I've also included a calculation, with candle coloring and/or plot shapes, for something like a stop run on high volume. The calculation for that is in its section below, and should be pretty self explanatory.
Lastly, typing this as I'm posting it, this indicator could also be useful for helping to find placement for trailing a stop. Just a thought!

Price Action: Inside Bar BoxesThis script automatically draws rectangles around bars inside IB pattern.
Note :: because Pinescript does not allow changes to already drawn charts on historical bars, checkbox "show only last box" doesn't work for arrows

Auto Price Action - Volume Price and Spread [Mehrok]Auto Price Action - Volume Price and Spread script generates important support and resistance levels basis activity happening in price, volume and candle spread. The basic idea has been taken from concepts of VSA which underlies that weakness appears in uptrend and strength in downtrend. Script will try to find candles which have volume higher then average and candle spread.
Underlying logic:
Script generates significant high's as resistance and lows as support basis activity happened on volume, price and candle spread. Once criteria set in script is met it would then mark that candle with resistance or support line which would act as important price action level later in time.
Usage:
As it records and maintain important high and lows happening on candles till the time new levels are generated therefore generated price levels act as significant support or resistance. Higher the activity in volume, price and spread stronger that price level would act as support or resistance in future.
Settings:
AvgLen- It would allow you to set the SMA settings for volume bars. By default set at 20 means that SMA of 20D volume would be considered in script.
Volume Start Threshold - Default 1.3 - You can change this setting basis stock volatility. This would set the starting point in script to trigger support or resistance levels if volume is equal or higher then the multiplier you have chosen.
Bearish Volume Mult 1, 2 and 3: Set the the levels which can be adjusted to generate x1, x2 or x3 resistance levels which would appear on top of candles.
Bullish Volume Mult 1, 2 and 3: Set the levels which can be adjusted to generate x1, x2, or x3 support levels which would appear at bottom of candles.
Use of bearish and bullish volume mult is to let user define the multiplier value against which current volume bar would be checked. Higher the value means rare it would be.
x1 - Starting level of resistance/support. It would be considered as level 1 of support or resistance which can be broken easily. Happen too often.
x2 - Medium level of resistance/support. It would be considered as level 2 of support or resistance which can give tough fight as price would reach this level. If set as more then 50% of stock volatility of instrument then price would react for sure.
x3 - Strongest level of resistance/support. If set 3 or higher it would be rare to be generated and price may not visit level too often.
Bullish Candle Matrix %: Keep it above 50 to let script check how strong bullish candle is. Strength of candle increase as value increase from 50 towards 100. Keep it at 52 to track maximum bullish candles.
Bearish Candle Matrix %: Keep it below 50 to let script check how strong bearish candle is. Strength of candle increase as value increase from 50 towards 0. Keep it at 47to track maximum bearish candles.
Optional Lines
Optional lines usage no volume activity therefore can generate important price levels basis volume and price only.
Script work on all time frame where volume information is available. In absence of volume information script would only generate optional levels and that too if activated.

Vgnomics ScalperVGNOMICS Scalper is a tool to help you find great scalping opportunities. There is great variety of ways to use this indicator to get amazing results. The VGNOMICS Scalper is a new trading indicator that can be used in any market. The technique we combine with this indicator is easy to learn and apply to your trades, but practice makes perfect. This indicator is based on a mathematical calculation that always occurs, no matter which time-frame, market, asset, option, stock or crypto.
How does it work?
The script determines whether we have a bullish or bearish trend based on a combination of price action and moving averages.
When the price crosses this trend, a buy or sell signal is placed (green or red arrow). The indicator will then draw 5 colored dots extended with 5 colored lines. Every line or dot represents a possible entry / exit position. These values are chosen based of a mathematical formula on the previous price movements.
The distance between the red en the black line is calculated from the price action from the current and previous candle.
If there was a big price movement, the distance between the black and the red line will be much greater than when the price action is much smaller.
The distance between the blue and the black line is always the same distance as the distance between the red and the black line.
The yellow line will always represent the high or the low, depending on whether there's a short or a long signal.
These lines tend to be key levels between which the price will bounce.
There are many ways to use and interpret these levels.
How to trade with this indicator?
We have allot of different strategies that can be implemented for this indicator.
But we will explain 3 working strategies that work for us.
Scalp trading is one of the most profitable forms of trading. They can lead to very high profits but are very hard to achieve. In this tutorial we will show you how the VGNOMICS Scalper indicator can assist you with locating great scalp opportunities.
The tutorial below is just one example of how this indicator can be used. Every line represents a key price level at which scalping opportunities can take place.
Strategy 1
Long position:
1) A green arrow at the bottom of the screen indicates a potential long position.
2) Wait for the candle to close. (The signal is only confirmed when the candle closes)
3) Candle closed.
4) Place a limit order for a long position at the yellow line. (Entry)
5) Place a take profit order at the orange line. (Exit)
6) Order is filled. (Long position)
7) Take profit at the orange line. (Exit)
8) Yellow line (entry) gets respected most of the time.
Short position:
1) A red arrow at the bottom of the screen indicates a potential short position.
2) Wait for the candle to close. (The signal is only confirmed when the candle closes)
3) Candle closed.
4) Place a limit order for a short position at the yellow line. (Entry)
5) Place a take profit order at the orange line. (Exit)
6) Order is filled. (Short position)
7) Take profit at the orange line. (Exit)
This strategy does not include a stoploss. It's up to you to implement this indicator in your own strategy. Stoploss orders could be placed at the lines (Key price levels) below / above your entry.
For example:
The stoploss order could have been placed on the black line, or alternatively, we could have placed a second long order on the black line and exit at the yellow line while we place a stoploss order on the blue line. (see strategy 2)
The price tends to swing between these key levels and can be used in various ways.
Strategy 2
Long position (same strategy for short postion but for a red arrow):
1) A green arrow at the bottom of the screen indicates a potential long position.
2) Wait for the candle to close. (The signal is only confirmed when the candle closes)
3) Candle closed.
4) Place a limit order for a long position at the yellow line. (Entry)
5) Place a take profit order at the orange line. (Exit)
6) Order is filled. (Long position)
7) Price did not reach our profit target orange line. (Exit)
8) Place a second limit order with the same size for a long position at the black line. (Entry)
9) Order is filled. (Long position)
10) Place a take profit order at the yellow line. (Exit)
11) Take profit at the yellow line and break even order for the first position. (Exit)
Strategy 3
Long position (same strategy for short postion but for a red arrow):
1) A green arrow at the bottom of the screen indicates a potential long position.
2) Wait for the candle to close. (The signal is only confirmed when the candle closes)
3) Candle closed.
4) Place a limit order for a long position at the black line. (Entry)
5) Order is filled. (Long position)
6) Place take profit orders at the yellow/orange/red line. (Exit)
7) Take profit. (Exit)
You want to use this indicator?
Go to the VGNOMICS website.

Average Highest High and Lowest Low Swinger StrategyThis is a full price action strategy designed for trending markets such as crypto and stocks.
Its purely made on calculations for the highest high and lowest low using 2 different length , a faster and a slower one.
With those we make multiple averages.
Rules for entry:
For long: our close of the candle is above both the average using fast and slow line
For short: our close of the candle is below both the average using fast and slow line
Rules for exit
We always exit when we have an opposite order
Caution
This strategy use no risk management system, so be careful with it
If you have any questions, let me know

CPR by PIVOT EDGEIntroduction to the Indicator "CPR by PIVOT EDGE - with AUTO BUY SELL Triggers"
The Foundation layout for this indicator is based on PIVOT's strategy which are nothing but the most important levels that the price has respected in the past. The values for the pivots are derived from the key attributes of the price in any timeframe such as the previous OPEN, HIGH, LOW and CLOSE. These define the mood of the price and where it intends to move in relation to the previous range formed. Earlier HIGH - LOW i.e the RANGE indicates the possible movement that a stock can make in the current session and as per the calculated pivots we can possible find out the tentative supports and resistances. In addition to this indicator, It is advisable to use the price action theory which helps in taking a right decision for entries.
This indicator by itself is complete in nature, i.e it guides the user for possible entry levels and the projected targets that we can achieve and also the likely stop loss limit in case the price reverses. So beforehand even before entering into a trade position, the user can ascertain what can be his loss or max profit and then he can chose an optimum position size for favorable results. This Indicator also comes with labels for all PIVOTS like CPR , TC , BC , S1,R1, PDH , PDL etc.. which makes it easier to understand levels and trade
The beauty of this Indicator lies in the fact that it can be used for all types of trading styles like Scalping, Intra day, Swing or Positional and Investments also. It works on all timeframes and across all market segments like EQUITY, COMMODITIES , FUTURES , FOREX etc. This indicator can be used for any exchange and any time zone also without any changes or adjustments needed.
Now let us understand the features of this Indicator in detail.
TIMEFRAME - It has options to choose between Day, week and month as timeframe. By default it is set to Day timeframe - Though this Indicator works on all timeframes, it is advisable to work on ,15,30 mins Intraday and 1H,2H, 4H for Swing and D,W candles for Positional trades.
DISPLAY CPR BAND - This displays the CPR range that consists of Pivot , TC and BC . This Band or Range is the core of this indicator and this gives a detailed information about the tentative range and momentum of the market for the present period
as well a prediction for next session and also can tell you the history of its prior period. This level acts as both support and resistance based on the direction of the trend. The unique feature built in this indicator is that
the CPR Band changes its color based on whether it is ascending or descending CPR or in other works if it is higher value relation or lower value relation compared to previous session. Green for Higher and red for lower relation.
DISPLAY SUPPORT RESISTANCE - This indicates the important support and resistance levels for the day which is derived from the price details of prior period that is based on HIGH / LOW / CLOSE of prior period.
DISPLAY PREVIOUS HIGH / LOW / CLOSE - I have included Daily / Weekly. It is important to know the earlier highs / lows and close since price respects it very much just like support and resistance .
DISPLAY TOMORROW CPR - This displays the CPR band and support / resistance for tomorrow. It give an advance information of tomorrows trend and momentum today itself if you study the CPR concepts you can be prepared for tomorrows' market and can very well know in advance if it will be a sideways market or a trending day.
PMA - Pivot Moving averages are an important combination of 3 Fibonacci series based moving averages. Here I have used 9,14 & 23 as the series which I found gave best results after long period of back testing and finetuning. It clearly gives you the mid term trend of the price and if you just follow the color of the band then you wont go wrong. Always try to take entries whenever price finds support or resistance close to the curve and avoid taking entries whenever price is too far from these curves.
These curves and the area are also color coded to depict buying and selling zones.
MAJOR TREND - This displays the prevailing major trend in the market and I have used as 200 period moving average by default which you can change to suit your needs. You can check the major trend of the market by using higher timeframes above 1Hr.
MARKET BIAS INDICATOR - One more unique feature of this Indicator is the background color which denotes on which medium trend currently the market is i.e whether Buying is favorable or selling is favorable. Light blue if for Buying zone and Light yellow is for selling zone.
BUY SELL triggers - This is going to be the most unique and advanced feature of this indicator. I have carefully studied and created a special trigger system which will alert the user whenever a BUY or SELL opportunity is presented in the stock. This is the result from a lot of study of the pivot strategies, CPR techniques, Price action theory, Candle stick patterns , market structure and my trading experience all put together. You can set the automatic alerts to any number of stocks to whichever timeframe you prefer either for Intraday or even swing & positional trading. ( Depends on the type of Trading view account you hold). Please note that this Indicator trigger's works even for the free trading view account and you do not need paid version.
Color classification - Buy triggers bars will be colored in Parrot green or Lime green color, Sell triggers bars will be colored in pink color. Regular Bullish and bearish candles will remain as Green and red.
ALERTS - I have coded automatic alert system in trading view and named them as ENTRY SIGNALS. You can add alerts to any of the stocks at whichever timeframe you prefer so that whenever there is a BUY or a SELL condition met, you will get notification or Desktop / Mobile app / Email etc.
IMPORTANT NOTE : This indicator does not guarantee any favorable results nor protect your from any loss. You own the complete risk of your trades. It is suggested that you use this indicator and do back testing for considerable period to understand how it works the the potential win rate it can give.

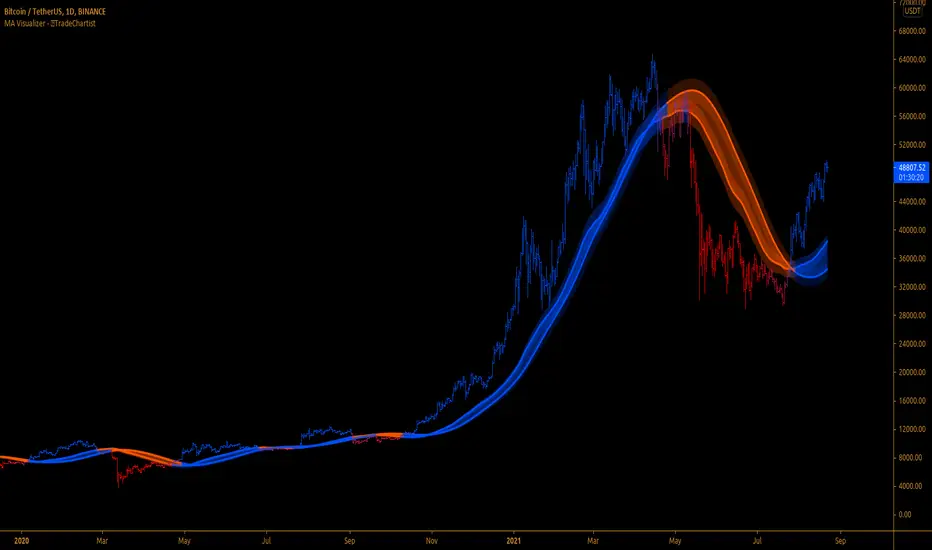
MA Visualizer™TradeChartist MA Visualizer is a Moving Average based indicator aimed to visualize price action in relation to the Moving Average in a visually engaging way.
===================================================================================================================
█ MA Visualizer Features
11 different Moving Averages to choose from the settings to visualize based on MA Visualizer Length (Default - 55 period SMA).
2 Smoothing options (default - 0, 0 uses MA length as Smoothing factor, 1 uses no Smoothing).
4 colour themes to choose from and option to adjust Visualizer Vibrance.
█ Example Charts
1. 1hr chart of OANDA:XAUUSD using 55 period WMA.
2. 15m chart of OANDA:EURUSD using 144 period Tillson T3 MA.
3. 4 hr chart of OANDA:US30USD using 55 period SMMA.
===================================================================================================================
Best Practice: Test with different settings first using Paper Trades before trading with real money
===================================================================================================================
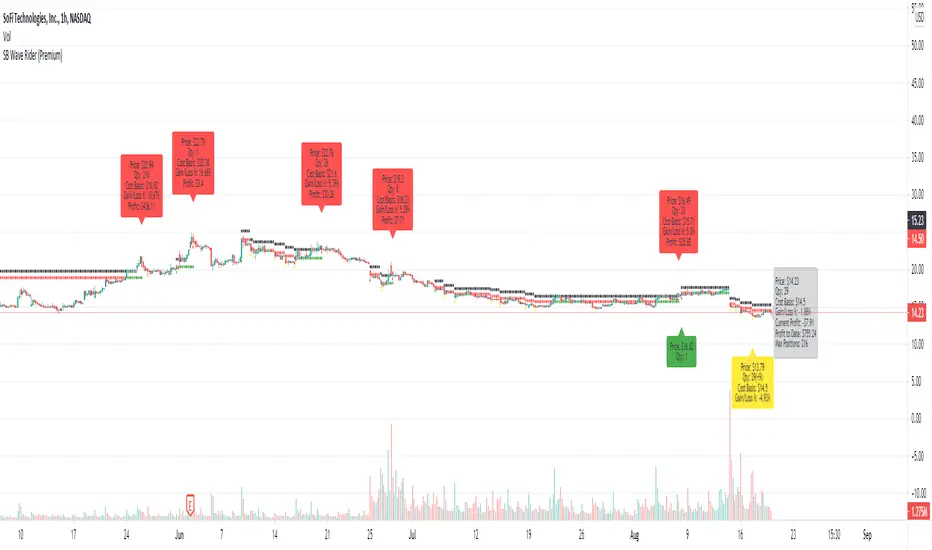
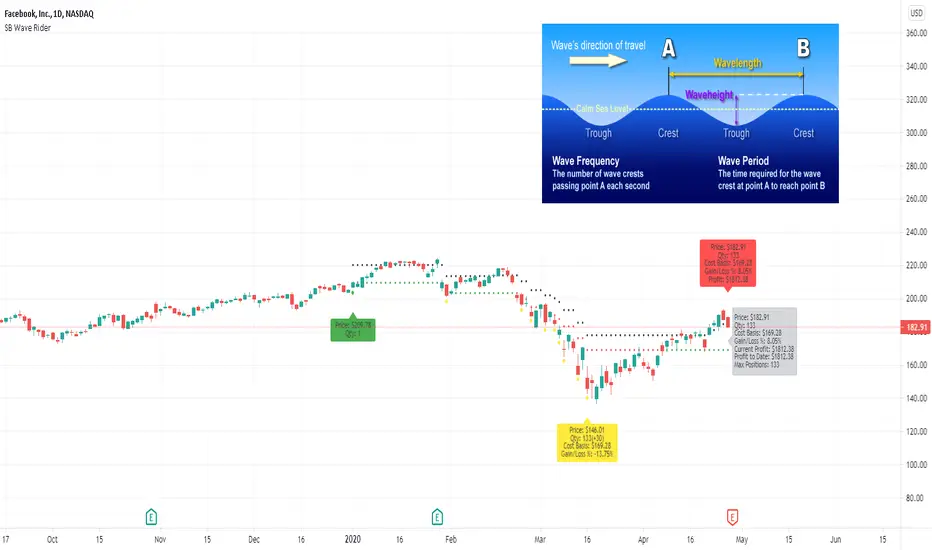
SB Wave Rider PremiumBased on the public version of the script with additional options.
This script seeks to buy the top, and increase its speed (position) on its ride to the bottom of the wave. Once it hits bottom, the surfer is able to bottom turn and make its way back up the wave. At the top it will deleverage and exit its positions starting the cycle over again.
In this version you can add existing positions and the script will take over. You set the date to todays date and it will begin making trade recommendations.
This version will also provide you with alerts for the following.
Open a position
Add additional positions
Increase trailing stop
Close out positions
SB Wave Rider (Public)Let me introduce you to my latest indicator, the SB Wave Rider.
I want to briefly describe why this is called the wave rider. Imagine a wave. The top of the wave (crest) can be viewed as the highest point of the wave. The bottom of the wave is considered the trough. The wave height can be measured as the distance from the top of the crest to the bottom of the trough. We ride the wave from the top, all the way down, then all the way back up to the top, where we secure our profit and deleverage our positions. Then we paddle back out and start the process all over again.
Now that you have the analogy to work with, I want to tell you how/why this works.
It sounds completely wrong to be trying to buy the top, but I will try to convince you here why you should be buying tops.
Have you ever bought a stock thinking you were buying the bottom? Have you been disappointed that it wasn't the bottom and it dipped even further? Did you buy in with too much leverage because you were so convinced it couldn't possibly go lower.
What if you flipped that on its head and you were convinced, absolutely convinced you were buying the top, the very top. Like the 52 week high and you were sure it was going to crash lower the next day. All indicators said the stock was overbought, it had an 14 period RSI of 80, MACD was turning bearish, you were 2 standard deviations above the upper Bollinger Band. Its trading way above its vwap. Now lets say someone had a gun to your head. They told you that you had to make a purchase, but they left the amount you had to purchase up to you. How much would you buy just to meet this lunatics demands? Well I would probably say I would buy a single share.
When you purchase a stock, there is no way to tell at the moment of purchase if you are buying a top, a bottom, or somewhere in between. If it were that easy we would all be rich. The biggest part of the equation that most people forget is not when you enter or exit a position, its how you manage it. A skilled wave rider will be able to drop into a massive wave, ride it to the bottom, get pitted in the barrel, get spit out, do a massive bottom turn and ride it back to the top exiting the wave with a perfect 10.
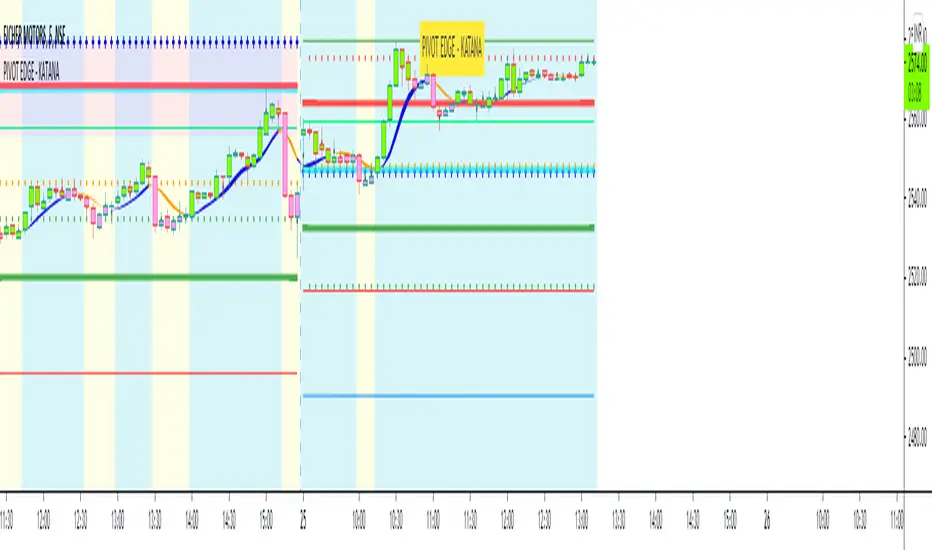
PIVOT EDGE - KATANAIntroduction to the Indicator " PIVOT EDGE - KATANA " . Katana means the sword in Japanese that the legendary samurai warriors used which was sharp , swift and strong to take on any opponent and gave an edge to win. This Indicator also has some of the unique features and hence it is aptly named so.
The Foundation layout for this indicator is based on PIVOT's which are nothing but the most important levels that the price has respected in the past. The values for the pivots are derived from the key attributes of the price in any timeframe such as the OPEN, HIGH, LOW and CLOSE. These define the mood of the price and where it intends to move in relation to the previous range formed. Earlier HIGH - LOW i.e the RANGE indicates the possible movement that a stock can make in the current session and as per the calculated pivots we can possible find out the tentative supports and resistances. In addition to this indicator, It is advisable to use the price action theory which helps in taking a right decision for entries.
This indicator by itself is complete in nature, i.e it guides the user for possible entry levels and the projected targets that we can achieve and also the likely stop loss limit in case the price reverses. So beforehand even before entering into a trade position, the user can ascertain what can be his loss or max profit and then he can chose an optimum position size for favorable results.
The beauty of this Indicator lies in the fact that it can be used for all types of trading like Scalping, Intra day, Swing or Positional and Investments also. It works on all timeframes and across all market segments like EQUITY, COMMODITIES , FUTURES , OPTIONS , FOREX etc.
This indicator can be used for any exchange and any time zone also without any changes or adjustments needed.
Now let us understand the features of this Indicator in detail.
TIMEFRAME - It has options to choose between Day, week and month as timeframe. By default it is set to Day timeframe
DISPLAY MAJOR LEVELS - These are the important support and resistance levels calculated based on the past price data. Most important ones are marked in BOLD RED and BOLD GREEN between which the price tends to move generally.
Apart from these, We have breakout level marked in light green and if price breaks this level we can expect targets upto extended levels and beyond marked in blue.
we also have breakdown level marked in light red and if price breaks this level we can expect targets down up to extended levels and below it marked in blue.
DISPLAY HIDDEN LEVELS - These levels are intermediate supports and resistances that can be used whenever the present day indicated range is very wide. Whenever we have an explosive moments in market the range of that day is very huge and so he next day support and resistance band becomes very wide indicating the sideways movement day within that range. And on those days we can switch on the hidden levels and the price respects these levels and most of the days it is inside this range only.
DISPLAY PREVIOUS HIGH / LOW / CLOSE - I have included Daily / Weekly levels. It is important to know the earlier highs / lows and close since price respects it very must just like support and resistance .
MID OF PEMA - This is an important EMA based indicator which potentially indicates curves of support and resistance during retracements or pullbacks. If the curve is breached then the trend is reversed and the price will tend to move to the next pivots . You can use this as trailing stop loss.
CPR - Central Pivot range, An Important tool for the CPR purists. I am using this particular CPR , TC , BC Band as a colored band indicating whether it is ascending or descending bias. The Band color is GREEB when the CPR is ascending up compared to yesterday and RED when is descending. By the width and narrowness of CPR you can ascertain the trading range and this information is available right after the market close so that you can plan your trades for tomorrow.
SENTIMETER LINE - Gives you a glimpse of the market sentiment at the pre open. Based on this you can know if there is a shift in the sentiment of Buyers / sellers and if price is accepted or rejected. This level acts as an important support / resistance level.
VWAP - Volume weighted average price , One of the widely used and maybe the only Indicator used on charts by most pro traders and big institutions. It gives you an Idea of the volumes that are getting traded in huge quantity and will act as a magnet attracting and also repelling price.
CANDLE MID POINT - This is small feature that's is very important but gets ignored because of lack of knowledge or awareness by traders. Most of the times the mid of the explosive or momentum candles becomes the last line of defense for Buyers / sellers and you can see the battle happening exactly at this point.
THE TURNING POINT - As the name suggests, most of the times price gets turned away from this because lot of fresh and unfilled orders are waiting to be executed at this level. So it becomes an important profit booking or fresh entry level
SCALPERS MAGIC CURVE - This is a high speed curve which has zero lag and very dynamic in nature which reacts quickly to the change in price. Go long when it is trending up and Blue in color, close trade when it turns orange and makes a U turn and vice versa. Most suited for scalpers who trade in 2 to 5 mins time frame. When you want to use this, switch off all other below parameters.
SMART RIBBON - The best and the new unique feature of this curve. As compared my other previous Indicators which had PEMA curve as the base for trend Identification, Here i am introducing this ribbon concept which is much faster reacting to the change in trend and gives you very early entry and also early exits so that you can get the maximum gains from the trend. In a way you can catch the fall right from the start till the end and exit at the end of the trend. Blue for uptrend and Orange for Downtrend.
MARKET BIAS INDICATOR - Again one more unique feature introduced in this Indicator. This feature will paint the chart background in Light blue for BUY ZONE And light yellow for SELL ZONE. You can look to BUY or SELL based on the background color and hence it prevents you from entering trade in wrong or opposite direction. You can avoid trade when there is too much crisscross of colors indicating sideways or range bound market.
BUY SELL TRIGGERS - This features is built on smart logic based on price action / Candle patterns / pivots and my trading experience. It colors the candle bars into LIME GREEN / PINK whenever Buying / Selling opportunities are seen. This is also paired with the alert system which can be used to set automatic sound and desktop notifications. Based on the type of account you hold in trading view you can set alerts for upto 400 stocks.
SMART CANDLE COLORING - If you don't want to do the work of finding the trend and looking for right entry location and exit levels, then you can simply use this feature which makes trading look so simple and easy. This is like an AUTO PILOT mode or CRUISE mode where it colors the candles in only BUY ZONE color ( LIME GREEN ) or SELL ZONE color ( PINK ). Take entry above the high of the first candle and be in the trade as long as you see the opposite color. When you want to use this feature, switch off the BUY SELL TRIGGER.
It is advised that you first learn how this indicator works by back testing historical data and also forward testing in live market by way of paper trading before you deploy real money.
IMPORTANT NOTE : This indicator does not guarantee any favorable results nor protect your from any loss. You own the complete risk of your trades. It is suggested that you use this indicator and do back testing for considerable period to understand how it works the the potential win rate it can give. If you have any doubts or need any clarifications of assistance in understanding, you can message me and I will try to help.
Happy and Safe trading - Mohan from PIVOT EDGE
Contact for getting access to this Indicator. Send a personal message on trading view or on my whatsapp no 9353160775
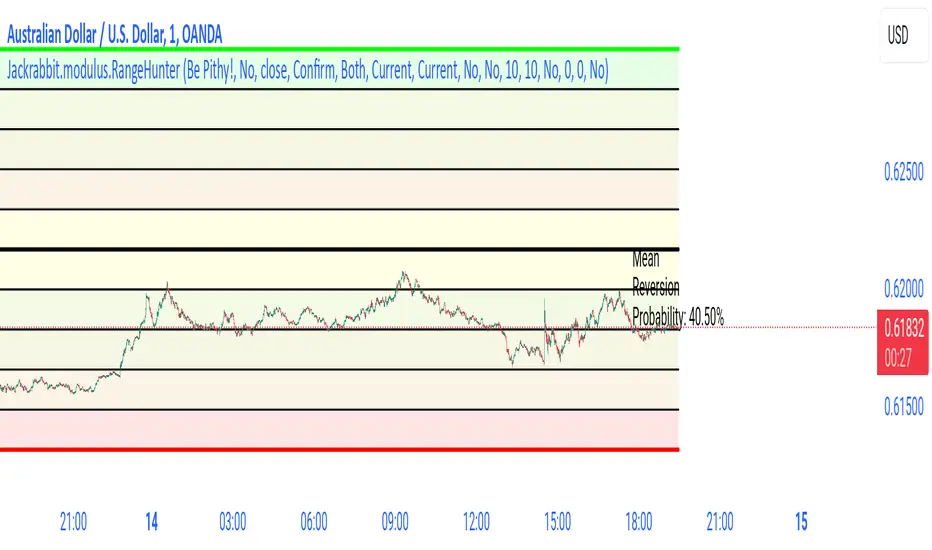
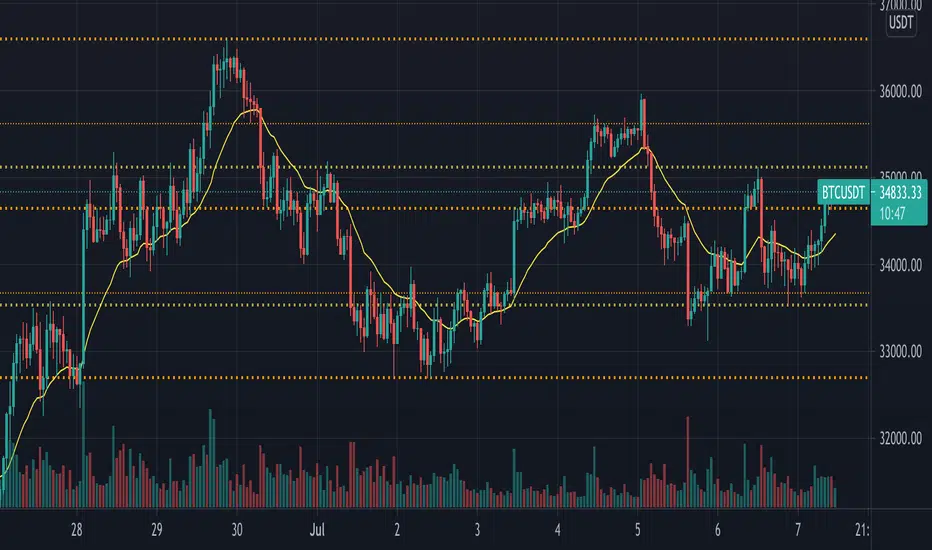
Jackrabbit.modulus.RangeHunterRange Hunter is a unique module that offers a wide range of trading potentials and paradigms for the Jackrabbit suite.
Range Hunter works by finding the highest boundary and the lowest boundary of a time frame. From there, it creates a median by which the market should fluctuate as signs of its health. When the price stays in the upper/lower ranges for too long, the market is considered "unhealthy". Price action should cycle around the median routinele for a healthy market.
From the upper range to the lower range is divided into 10% segments.
There are five segments above the median where price action is considered over valued or oversold.
There are five segments below the median where price action is considered undervalued or oversold.
Buying and selling is divided into 10 boundaries. The 10th boundary for purchasing starts at the lowest range and goes downwards as price climbs. The 10th boundary for selling is where the price is the highest range and goes downwards as price drops.
Buys take place when price action drops bwelow and the climbs above the desire boundary. Sells behave the exact opposite.
The user can configure the boundary that buying and selling takes place independently and supports all elements/settings of the Jackrabbit modulus framework except confirmation bias. If confirmation bias is desired then this module needs to be loaded twice.
The Jackrabbit modulus framework is a plug in play paradigm built to operate through TradingView's indicator on indicatior (IoI) functionality. As such, this script receives a signal line from the previous script in the IoI chain, and evaluates the buy/sell signals appropriate to the current analysis.
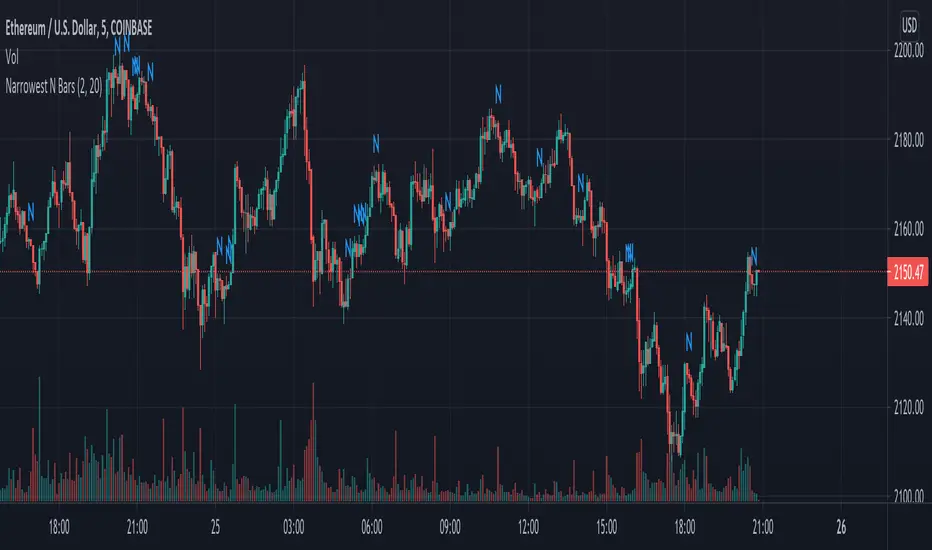
Narrowest N BarsThe indicator is inspired by Toby Crabel's work.
Originally 2-Bar NR pattern is defined as the narrowest range from high to low of any two day period relative to any two day period within the previous 20 market days.
However, this script allows user to look for N Bar narrowest range within user defined numbers of previous days
Settings are as follows:
1. N Bars - sets number of bars in range
2. Lookback period is self-descriptive)
The last bar in the narrowest range is marked with N
Bob Volman Price Action StrategyPrice action trading strategy combined with 21 period moving average.
Use the 21 period moving average and filter along with price action to identify the main trend then look for pullback signals that match the filter to enter.
The stops, entry points and trends are depicted on the chart.
Example using 100 contract size with crude oil, slippage is 3 and commission per order is 3$ with actual capital of 10000$, you can adjust other contract size for other pairs to consistent with reality.

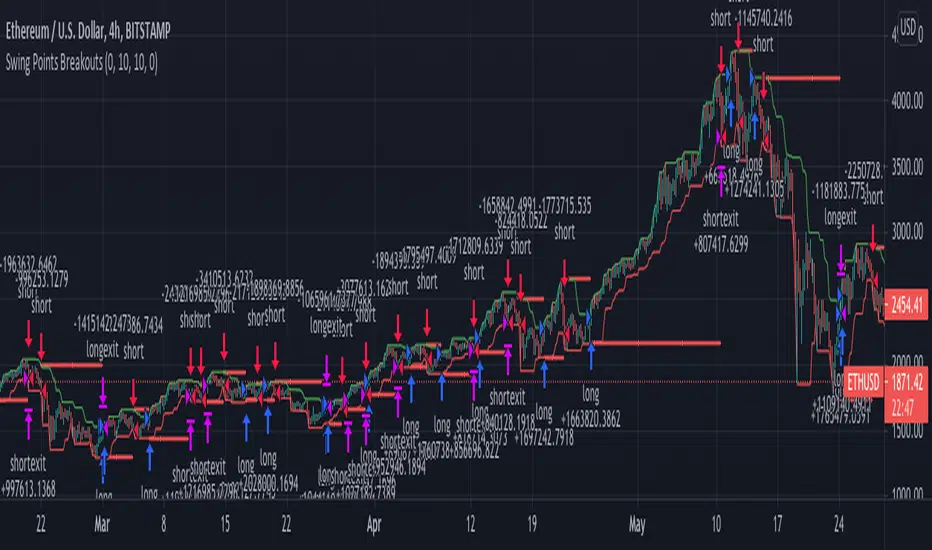
Swing Points BreakoutsLong term strategy for managing a Crypto investment with Swing Trades of more than 1 day. The strategy buys with a
stop order at the Swing High price (green line) and sells with a stop order at the Swing Low price (red line).
The direction of the strategy can be adjusted in the Inputs panel.
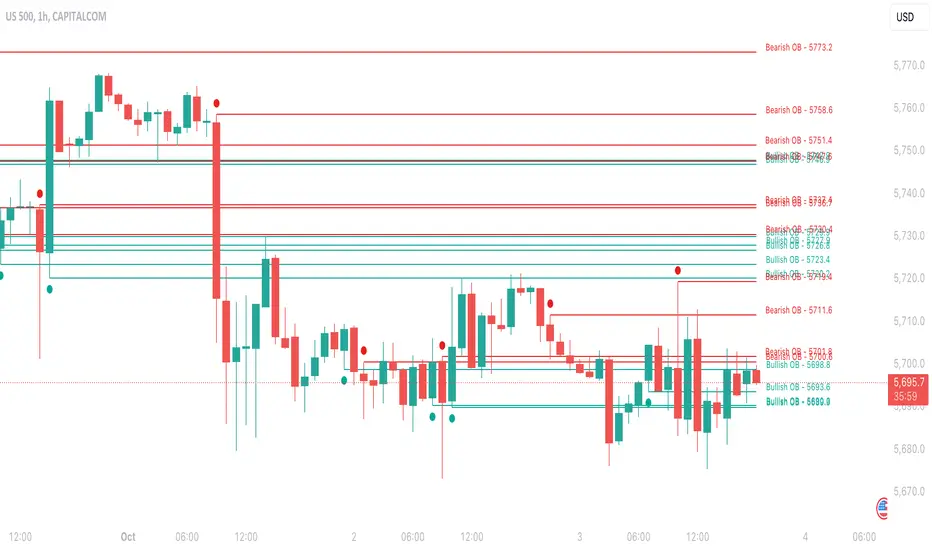
Institutional OrderBlock Pressure█ OVERVIEW
OrderBlocks are areas where Banks take a Short or Long position. So they create a movement that they would like to hide from us, but luckily for us they cannot. Take the example of Banks opening Short position for x reason. The Trend is already Bearish. The Price will fall and then make a Reversal
(most often to the price where they opened their positions) and it is at this precise moment that they will again resume a Short position twice as
large because for the moment, following this example it is not in their interest that the Price exceeds a certain Price since they are Seller.
As a result they create a solid Resistance (the strongest it is). There are several ways to interpret this logic, we can try to follow the movement of Banks
or on the contrary take advantage of the recovery of the course. Note that not having level 2 and access to the order book from TradingView we can only
make a rough estimate of the "OrderBlocks" through VPOC.
█ HOW TO INTERPRET?
• The Labels displayed by "Red Arrow" and "Green Arrow" represent supposed Bearish or Bullish OrderBlock. Note that you should not in any way interpret these "Arrows" as Signals to Buy or Sell for the reasons mentioned above.
• The OB Line works according to detected OrderBlock Candle. These lines indicate the potential recovery area. (The highlighted lines and candles are white by default).
• It is better to use this indicator on Higher TimeFrame like 2H or 4H.
• You can change the Volume Ratio (here VPOC) which is 89 by default.
• There is a Customization section that allows you to change the colors of the Lines and Candles from White to Black depending on your background color (Light or Dark).
• YES the indicator is Repainting and YES you can have False Alerts since Labels appear in intra-bar!
█ ALERTS
• In fact we don't really need Alerts for the logic of this indicator except maybe to get the Price of the last OB Detected and to keep this price in your Alert History and may use it later. Some improvements will come in future with updates and we have already planned to add Alerts when a "Line Cross" gone occur.
If you notice any bugs or if you have any suggestions, don't be hateful gangs ;)
Happy trading everyone and remember, risk management is the most important!
Privious Day and Week ValuesThis indicator is designed for price action. It divides the price range in to four zones based on last week values. Besides, it shows yesterday highest and lowest values. The price usually shows reactions to the drawn horizontal lines!
BULLSEYE BORDERS (Combined Price Action Follower)Developed for Crypto Currency Market! Use for 15 minutes period or more! Under 15 minutes, results are unpredictible.
This script had been orginized with Donchian Lines based on support and resistance levels.
Rules:
If the price is under top line, you will be ready for short position, and over the bottom line, long position.
When the price passes the red and green area you can take action and enter the trade!
Orange area refers the squeezed or floating position, so you can either stop or wait for price action!
If you see boring candles frequently, check out the last high and low levels.
If the price close to the last high, take long position. If not, short position.
Use ALMA , if you want to put and alert on script. It is identical to price line.
Thanks to @millerrh for 'Breakout Trend Follower'. Just used the last low and high features to complete the script. Combined with 'Boring Candles' from ©Prasad Raut, Modified on 20190811 (Updated to %30 full candle)
Trend Tip: You can use the script with Linear Channel so you can also see the trend. (not always)
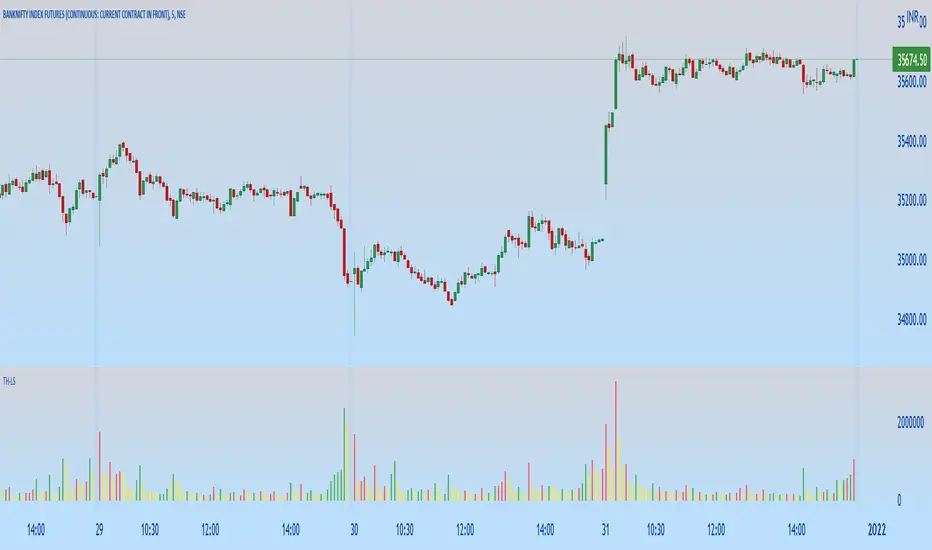
TH-Long & ShortThis indicator will help in identifying the reference candles for taking entry into the trade.
These reference candles are been named as LONG & SHORT Candles for easy understanding.
LONG Volume Candles - are reference candle for taking long positions.
SHORT Volume Candles - are reference candle for taking short positions.
Color Coding of Volume Candles:
LONG CANDLES - GREEN
SHORT CANDLES - RED
NEUTRAL CANDLES - YELLOW
LOGIC behind this implementation:
LONG candle:
In order to take long position we need to identify the price level, wherein we can anticipate the price is likely to get reversed along with increase in volume w.r.t previous candle.
Once this identified candle high price is taken out by any consecutive candles on closing basis, we get more confirmation of possible bullish price reversal. Hence the indicator tries to mark those volume candles as LONG candles (Green) where in the volume has increased from the previous candle along with the price increase on upper side.
SHORT candle:
In order to take short position we need to identify the price level, wherein we can anticipate the price is likely to get reversed along with increase in volume w.r.t previous candle.
Once this identified candle low price is taken out by any consecutive candles on closing basis, we get more confirmation of possible bearish price reversal. Hence the indicator tries to mark those volume candles as SHORT candles (Red) where in the volume has increased from the previous candle along with the price decrease on lower side.
NEUTRAL candle:
The price are trading in a range with no significant change in volumes too, these candles can be ignored as possible triggers for position entry. The indicator marks these volume candle as NEUTRAL candles (Yellow) which can be ignored.
HOW TO USE THIS INDICATOR:
First & more most this is not a buy/sell kind of indicator. As explained earlier, they help in identifying the possible price reversals.
We need to first identify your supply and demand zones and then use these signals as an extra confirmation for taking positions.
LONG Positions:
Wait for possible green volume candle formation, once formed mark the high of the corresponding price candle. On breach of that price on closing basis by any consecutive candle, we can look for possible long position.
SHORT Positions:
Wait for possible red volume candle formation, once formed mark the low of the corresponding price candle. On breach of that price on closing basis by any consecutive candle, we can look for possible Short position.
Friends,do use the indicator and give your valuable feedback.
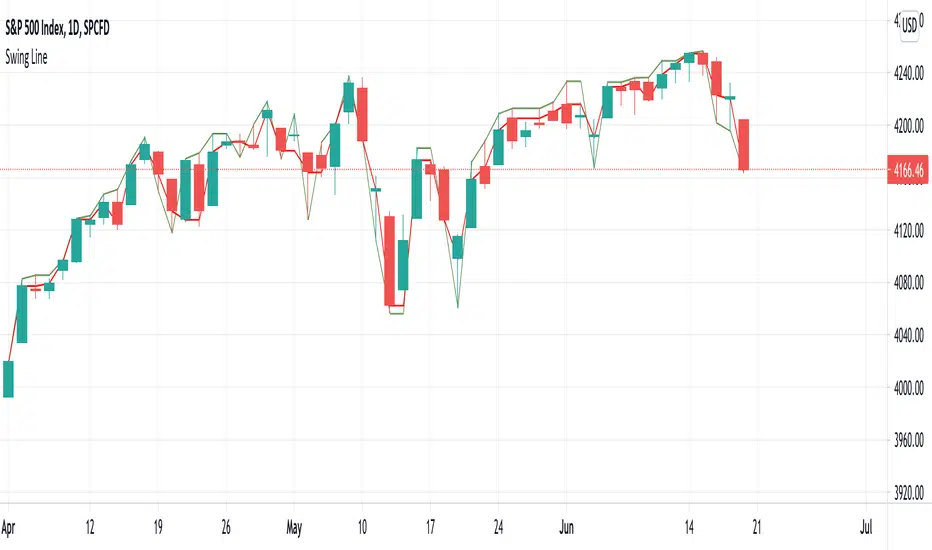
Swing LineThe author was inspired by Charles Dow's concept on trend and Gann's concept on swing trade.
Swing line can help identify resistance and support. Breaking resistance indicate an uptrend. Breaking support indicates a downtrend. This is a simple and intuitive method in trend determination.
However, many chart readers nowadays set Candlestick as preferred pattern. The shared indicator provides another choice for constructing swing lines.
Volatility OscillatorThis tool displays relative volatility and directional trend. Excellent way to pickup diversions and reversals. Length can be lowered to 11 or 13 in settings to show price range.
Can be used to identify patterns such as parallel channels and likely direction of price action as pictured below.

Volatility - Sacred GeometryThis indicator is designed to pick up changes in volatility before it happens. It also shows current volatility, as price action drops the blue lines contract. The script uses the blue lines to locate spikes in volatility.
Example of dump revealing itself with plenty of notice.
Here large changes in price action are shown when the white lines spike. Traders can get a heads up on any pump or dump a few candles before it happens.
This example shows a low volatility channel vs high volatility channel. The blue lines expand as price range increases.
Trends can be discovered by studying the patterns.
* This indicator does not use sacred geometry, I just called it that because it looks like it. *
If anyone is interested in developing this indicator any further please get in contact.
