Pure Price ActionThis is a little trade bot for BTCUSD on the daily chart. I won't give away the specifics, but it's mainly based on price action derived from candle stick analysis. With some tweaks it also works on the weekly and monthly, but on lower timeframes than daily the performance drops quite siginifcantly.
Priceaction

Macd RSI toolsThis script will be edited, and might change greatly.
Do not use it for automation.
Initial Content :
MACD cross counting
RSI Peak/Dip counting
Compares Peak/Dip marked Price to find a better entry

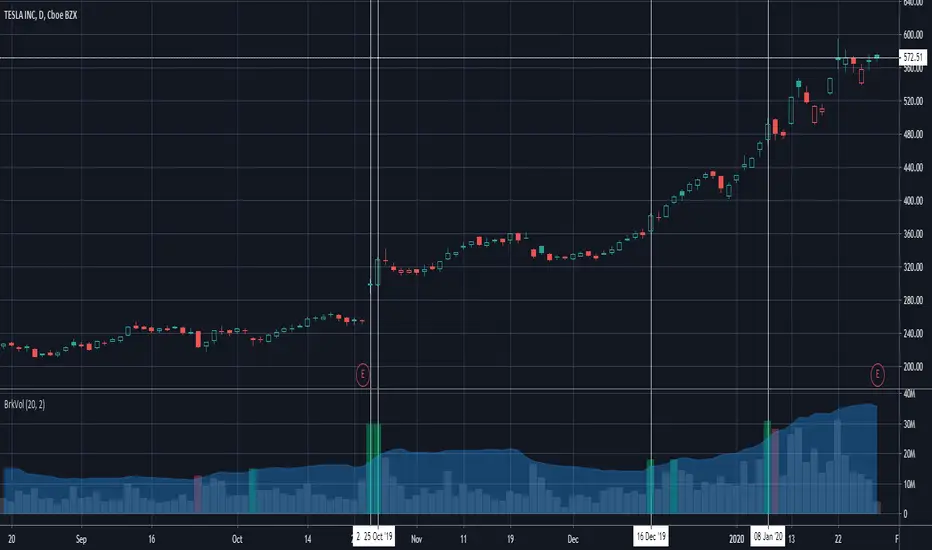
Breakout Volume Can Help Confirm Other SignalsVolume can help confirm signals we might discover using other methods of technical analysis.
This indicator tracks volume intelligently. Its logic spots above-average turnover and then tests against the price change. BrkVol highlights sessions with heavy volume and directional moves. This can help take out the noise and help confirm the trend.
Tesla is a classic example of this, with the stock rallying after showing heavy-volume gains on October 24- 25, December 16 and January 8.
Exhausted Volume (Expo)Exhausted Volume (Expo)
DESCRIPTION
Exhausted Volume (Expo) indicator visualize exhausted volume. Exhaustion often signals the reversal of a current trend because it illustrates excess levels of supply or demand, indicating a market is either overbought or oversold.
The indicator can also be used to detect volume pressure in either direction which can occur in breakouts or in reversal points. The input variable ‘Volume Length’ can be changed. A longer Volume length means that the indicator detects bolder exhausted volume.
• Volume pressure is seen in reversal points.
• Volume pressure can be seen in breakouts.
The indicator is also equipped with exhausted volume signals that are more sensitive. This is visualized with arrows up and down. The investor has the ability to adjust the sensitivity of these signals.
HOW TO USE
1. Use the indicator to identify exhausted volume
2. Use the indicator to identify volume pressure.
3. Use the indicator to identify reversal points.
4. Use the indicator to identify breakouts.
Combine the indicator with ‘ Climax Volume (Expo) ’
INDICATOR IN ACTION
EURUSD
EURUSD
BTCUSD
BTCUSD
The indicator works with RENKO, HEIKIN ASHI and with KAGI charts as well.
I hope you find this indicator useful, and please comment or contact me if you like the script or have any questions/suggestions for future improvements. Thanks!
I will continue to work on this indicator, so please share your experience and feedback with me so that I can continuously improve it. Thanks to everyone that have contacted me regarding my scripts. Your feedback is valuable for future developments!
ACCESS THE INDICATOR
• Contact me on TradingView or use the links below
-----------------
Disclaimer
Copyright by Zeiierman.
The information contained in my scripts/indicators/ideas does not constitute financial advice or a solicitation to buy or sell any securities of any type. I will not accept liability for any loss or damage, including without limitation any loss of profit, which may arise directly or indirectly from use of or reliance on such information.
All investments involve risk, and the past performance of a security, industry, sector, market, financial product, trading strategy, or individual’s trading does not guarantee future results or returns. Investors are fully responsible for any investment decisions they make. Such decisions should be based solely on an evaluation of their financial circumstances, investment objectives, risk tolerance, and liquidity needs.
My scripts/indicators/ideas are only for educational purposes!

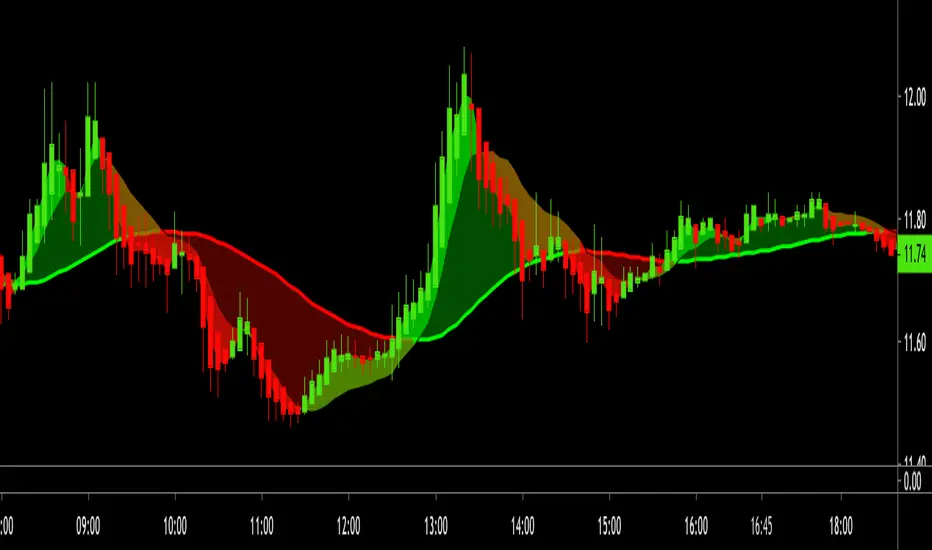
Swing Trade Pros - Price Flow IndicatorThe STP Price Flow Indicator measures the buying and selling pressure in the market. Using this indicator to measure the trend will allow you to identify favorable entry and exit points. When the background turns green the price will rise and we are in a Bull market. Likewise, when the background turns red the price will fall and we are in a Bear market.
Intelligent Price Action - Movement Up (Expo)Intelligent Price Action - Movement Up (Expo)
DESCRIPTION
Intelligent Price Action - Movement Up (Expo) identifies important up movements that have an impact on current price characteristics. The indicator is visualizing buying pressure! These price patterns are valuable insight when trading the market.
This indicator response faster to price movement and is more focused on detecting buying pressure rather than exhausted buyers.
• Buying pressure is seen in reversal points.
• Buying pressure can be seen when the buyers are exhausted.
• Buying pressure can be seen in positive breakouts.
HOW TO USE
1. Use the indicator to identify buying pressure.
2. Use the indicator to identify reversal points.
3. Use the indicator to identify exhausted buyers.
4. Use the indicator to identify breakouts.
Combine the indicator with ‘ Intelligent Price Action - Movement Down (Expo) ’ or with my other Price Action indicators.
INDICATOR IN ACTION
EURUSD
BTCUSD
BTCUSD
GOLD
WALL STREET
WALL STREET
BTCUSD
EURUSD
The indicator works with RENKO, HEIKIN ASHI and with KAGI charts as well.
I hope you find this indicator useful , and please comment or contact me if you like the script or have any questions/suggestions for future improvements. Thanks!
I will continue to work on this indicator, so please share your experience and feedback with me so that I can continuously improve it. Thanks to everyone that have contacted me regarding my scripts. Your feedback is valuable for future developments!
ACCESS THE INDICATOR
• Contact me on TradingView or use the links below
-----------------
Disclaimer
Copyright by Zeiierman.
The information contained in my scripts/indicators/ideas does not constitute financial advice or a solicitation to buy or sell any securities of any type. I will not accept liability for any loss or damage, including without limitation any loss of profit, which may arise directly or indirectly from use of or reliance on such information.
All investments involve risk, and the past performance of a security, industry, sector, market, financial product, trading strategy, or individual’s trading does not guarantee future results or returns. Investors are fully responsible for any investment decisions they make. Such decisions should be based solely on an evaluation of their financial circumstances, investment objectives, risk tolerance, and liquidity needs.
My scripts/indicators/ideas are only for educational purposes!
Intelligent Price Action - Movement Down (Expo)Intelligent Price Action - Movement Down (Expo)
DESCRIPTION
Intelligent Price Action - Movement Down (Expo) identifies important down movements that have an impact on current price characteristics. The indicator is visualizing selling pressure! These price patterns are valuable insight when trading the market.
This indicator response faster to price movement and is more focused on detecting selling pressure rather than exhausted sellers.
• Selling pressure is seen in reversal points.
• Selling pressure can be seen when the sellers are exhausted.
• Selling pressure can be seen in negative breakouts.
HOW TO USE
1. Use the indicator to identify selling pressure.
2. Use the indicator to identify reversal points.
3. Use the indicator to identify exhausted sellers.
4. Use the indicator to identify breakouts.
Combine the indicator with ‘ Intellilligent Price Action - Movement Up (Expo) ’ or with my other Price Action indicators.
INDICATOR IN ACTION
EURUSD
EURUSD
BTCUSD
BTCUSD
GOLD
WALL STREET
WALL STREET
EURUSD
BTCUSD
BRENT
The indicator works with RENKO, HEIKIN ASHI and with KAGI charts as well.
I hope you find this indicator useful , and please comment or contact me if you like the script or have any questions/suggestions for future improvements. Thanks!
I will continue to work on this indicator, so please share your experience and feedback with me so that I can continuously improve it. Thanks to everyone that have contacted me regarding my scripts. Your feedback is valuable for future developments!
ACCESS THE INDICATOR
• Contact me on TradingView or use the links below
-----------------
Disclaimer
Copyright by Zeiierman.
The information contained in my scripts/indicators/ideas does not constitute financial advice or a solicitation to buy or sell any securities of any type. I will not accept liability for any loss or damage, including without limitation any loss of profit, which may arise directly or indirectly from use of or reliance on such information.
All investments involve risk, and the past performance of a security, industry, sector, market, financial product, trading strategy, or individual’s trading does not guarantee future results or returns. Investors are fully responsible for any investment decisions they make. Such decisions should be based solely on an evaluation of their financial circumstances, investment objectives, risk tolerance, and liquidity needs.
My scripts/indicators/ideas are only for educational purposes!

Intelligent Price Action - Positive Close (Expo)Intelligent Price Action - Positive Close (Expo)
DESCRIPTION
Intelligent Price Action - Positive Close (Expo) identifies important positive closes that have an impact on current price characteristics. The indicator is visualizing buying pressure! These price patterns are valuable insight when trading the market.
• Buying pressure is seen in reversal points.
• Buying pressure can be seen when the buyers are exhausted.
• Buying pressure can be seen in positive breakouts.
HOW TO USE
1. Use the indicator to identify buying pressure.
2. Use the indicator to identify reversal points.
3. Use the indicator to identify exhausted buyers.
4. Use the indicator to identify breakouts.
Combine the indicator with ‘I ntellilligent Price Action - Negative Close (Expo) ’ or with my other Price Action indicators.
INDICATOR IN ACTION
EURUSD
EURUSD
BTCUSD
BRENT
WALL STREET
WALL STREET
WALL STREET
BTCUSD
BTCUSD
EURUSD
EURUSD
The indicator works with RENKO, HEIKIN ASHI and with KAGI charts as well.
I hope you find this indicator useful , and please comment or contact me if you like the script or have any questions/suggestions for future improvements. Thanks!
I will continue to work on this indicator, so please share your experience and feedback with me so that I can continuously improve it. Thanks to everyone that have contacted me regarding my scripts. Your feedback is valuable for future developments!
ACCESS THE INDICATOR
• Contact me on TradingView or use the links below
-----------------
Disclaimer
Copyright by Zeiierman.
The information contained in my scripts/indicators/ideas does not constitute financial advice or a solicitation to buy or sell any securities of any type. I will not accept liability for any loss or damage, including without limitation any loss of profit, which may arise directly or indirectly from use of or reliance on such information.
All investments involve risk, and the past performance of a security, industry, sector, market, financial product, trading strategy, or individual’s trading does not guarantee future results or returns. Investors are fully responsible for any investment decisions they make. Such decisions should be based solely on an evaluation of their financial circumstances, investment objectives, risk tolerance, and liquidity needs.
My scripts/indicators/ideas are only for educational purposes!

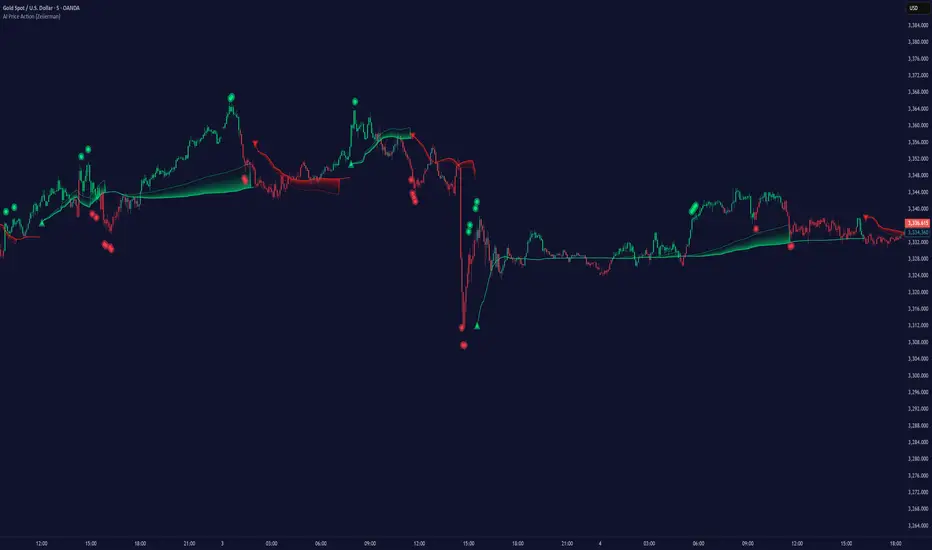
Price Action - Delivery Algorithm (Zeiierman)█ Overview
Price delivery algorithms in trading refer to complex computational algorithms used to determine the optimal price for executing trades. These algorithms are particularly relevant in electronic and algorithmic trading environments where large volumes of trades are executed automatically.
These algorithms are designed to analyze market data, including prices, volumes, and historical trends, to determine the most favorable price at which to execute a trade. They can take into account various factors such as market liquidity, price impact, and timing to optimize trade execution.
█ How It Works
Optimal price zones can be calculated in many different ways; we have decided to use a cycle method that determines the current dominant trend. The indicator functions by isolating a trend within a specific frequency range from various data.
Filter Logic and Loop:
The indicator computes a weighted average of historical prices over a range of past data points. It employs a loop to iterate over these past data points, applying a unique weight to each, depending on its position relative to the trend period.
Weight Calculation:
Weights are determined using triangle wave functions. The triangle wave function ensures that the weighting oscillates in synchronization with the desired trend period.
Summation:
The indicator aggregates the weighted prices from past periods to generate a single value for each point in time. This value signifies the strength and direction of the trend at the specified frequency. The results are used to determine the specific price zones.
█ How to Use
The price zones help traders identify the best times to enter and exit the market, similar to how support and resistance zones are used. The strategy is based on using price delivery algorithm zones to enter the market in areas commonly used by institutions for placing larger orders. The main advantage of this strategy is having the support of these heavier players.
█ Settings
Delivery Algorithm: This setting allows you to select the calculation method for the Delivery Algorithm. There are several options including "Price", "Swing High", "Swing Low", "Swing Mean", "Momentum", "Expansion", and "Volume". Each option represents a different way of analyzing market data, focusing on different aspects of price action or market dynamics. The choice here will influence how the algorithm interprets and responds to market data.
The corresponding length value is about the responsiveness of the Delivery Algorithm. Adjusting this value affects the algorithm's sensitivity to changes in market conditions. A higher value makes the algorithm more responsive, meaning it will react more strongly to recent market changes. This could be useful in volatile markets. On the other hand, a lower value makes the algorithm less responsive, resulting in more gradual adjustments. This might be preferable in more stable market conditions to avoid reacting to what might be considered 'market noise.'
Delivery Sensitivity: This setting adjusts the sensitivity of the algorithm's calculations to price movements. A higher value tends to smooth out the algorithm's output by considering a wider range of price data, which can be useful for identifying longer-term trends. A lower value makes the algorithm more sensitive to recent price movements, which can be helpful for short-term trading or scalping strategies. The option to enable Scalping Mode is particularly relevant for traders focusing on short-term, quick trades.
-----------------
Disclaimer
The information contained in my Scripts/Indicators/Ideas/Algos/Systems does not constitute financial advice or a solicitation to buy or sell any securities of any type. I will not accept liability for any loss or damage, including without limitation any loss of profit, which may arise directly or indirectly from the use of or reliance on such information.
All investments involve risk, and the past performance of a security, industry, sector, market, financial product, trading strategy, backtest, or individual's trading does not guarantee future results or returns. Investors are fully responsible for any investment decisions they make. Such decisions should be based solely on an evaluation of their financial circumstances, investment objectives, risk tolerance, and liquidity needs.
My Scripts/Indicators/Ideas/Algos/Systems are only for educational purposes!

Pivots (CPR) - Daily, Weekly & Monthly (only for Indraday) Hi all Dear users,
Here, I have shared my CPR script on Daily, Weekly & Monthly basis. which will only works on intraday time frames. Best time frames recommended are 3,5 &15.
This will be very useful for intraday trades. And also it has more customizing options.
The features are:-
================
- Have an option to use only Daily pivots.
- Have an option to check tomorrow pivot ( After day closing).
- You can customize each and every style and colors.
- It also contains Previous day High, Previous Week High & Previous Month High.
- You can Show or Hide daily weekly Monthly and highs too.
Please share this AMAZING INDICATORS others.

TTTT Trend (Expo)TTTT Trend (Expo)
DESCRIPTION
TTTT Trend (Expo) indicator is designed to visualize negative trends. Negative trends are often categorized with higher volatility and thus the price can change dramatically over a short period in either direction. The indicator detects these price fluctuations and visualizes it with a red cloud. So the trend is negative as long as the indicator has a red cloud. Respectively, if the indicator has no red cloud it’s a sign that the trend is positive.
The TTTT Trend (Expo) comes with 3 trend layers that have different sensitivity and can be enabled or disable.
HOW TO USE
1. Use the indicator to visualize negative trends.
2. Use the indicator to visualize positive trends.
INDICATOR IN ACTION
EURUSD
EURUSD
BTCUSD
BTCUSD
WALL STREET
EURGBP
The indicator works with RENKO, HEIKIN ASHI and with KAGI charts as well.
I hope you find this indicator useful, and please comment or contact me if you like the script or have any questions/suggestions for future improvements. Thanks!
I will continue to work on this indicator, so please share your experience and feedback with me so that I can continuously improve it. Thanks to everyone that have contacted me regarding my scripts. Your feedback is valuable for future developments!
ACCESS THE INDICATOR
• Contact me on TradingView or use the links below
-----------------
Disclaimer
Copyright by Zeiierman.
The information contained in my scripts/indicators/ideas does not constitute financial advice or a solicitation to buy or sell any securities of any type. I will not accept liability for any loss or damage, including without limitation any loss of profit, which may arise directly or indirectly from use of or reliance on such information.
All investments involve risk, and the past performance of a security, industry, sector, market, financial product, trading strategy, or individual’s trading does not guarantee future results or returns. Investors are fully responsible for any investment decisions they make. Such decisions should be based solely on an evaluation of their financial circumstances, investment objectives, risk tolerance, and liquidity needs.
My scripts/indicators/ideas are only for educational purposes!

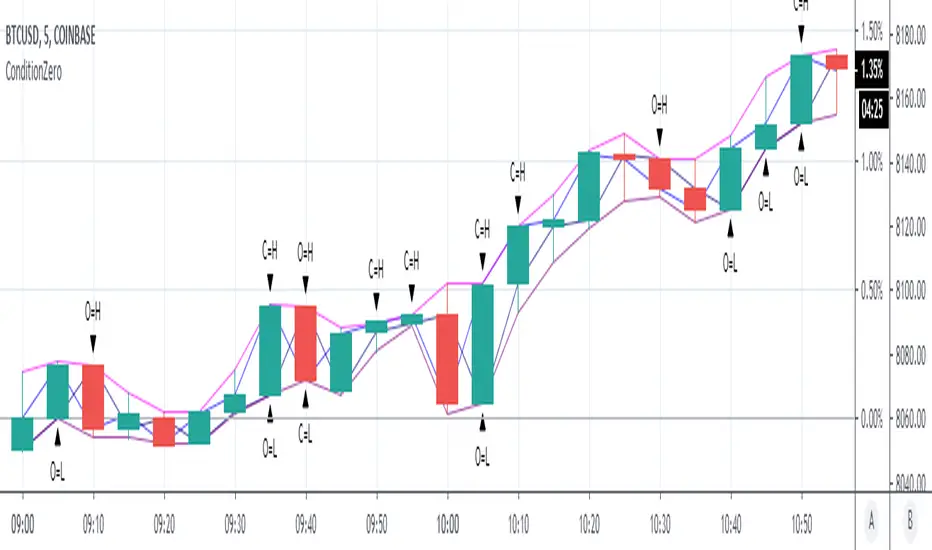
ConditionZeroThis study is a proof of concept analysis of situations that can lead to divide with zero or divide by zero conditions. Such situations can lead to mathematical errors, and can increase the potential for false alerts.
One common formula that is prone to this situation is:
pct=(high-close)/(high-low)
This is used to calculate percentage change of a candlestick.
Common outcomes are 0/0, 0/x, x/0, where x is a non zero value.
Visualizing this situation allows for more robust script development and deployment.
There are no user configurations.
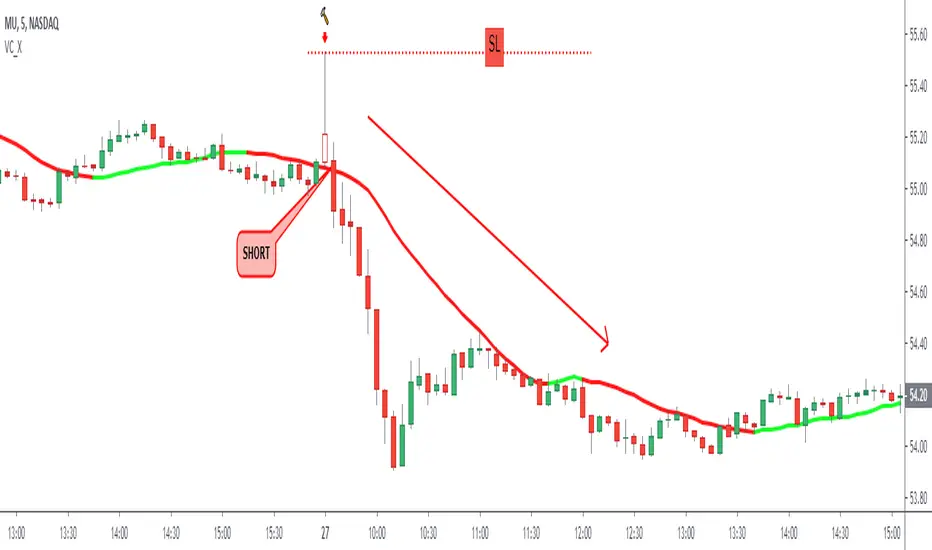
Long Tail Candle by Oliver VelezThis script detects an event created by Oliver Velez, it is a wide-range candle with a small body and a long tail (hammer-type candle), its range is noticeably larger than previous candles, as a rule it can be taken that the body should be maximum of 30% of the total range of the candle with a long tail. The stop goes under the tail and the signal is given when the next candle followed by the long tail candle exceeds its body, do not program this condition so that the alert indicates that a long tail candle was generated and the trader has some Time to visualize the graph and wait for the signal.
The default configuration is very basic, each trader must adjust to their needs.
- Trend filters can be activated.
- Alerts available.
Thumbs up
Adaptive RSI by PuzzleAdaptive RSI
RSI with a twist. The values are calculated differently depending upon whether the RSI is above or below the centre point. I have found this gives:
More pronounced divergences which are easier to spot and more accurate at predicting local top and bottoms
More accurate indications of overbought/oversold conditions.

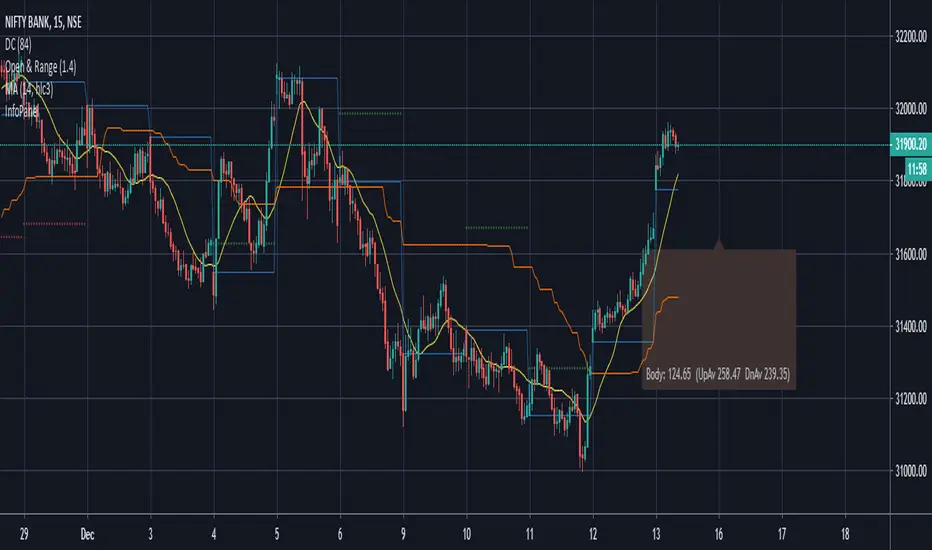
Candle Information Panel//This indicator shows Day's candle measurements with past averages. First column shows the candle details for the present day.
//"Open - Low", "High - Open", "Range(=High-low)", "Body(open-close)"
//Averages are calculated for occurences of Green and Red days. Up Averages are for Green days and Down Averages are for Red days.
//Average are not perfect calculations since occurences(of Red or Green) will vary within the timespan used for averages.
//This can used to guage general sense of probability of the price movement.
//e.g. if the Open to Low for a day exceeds UpAv value, then there is higher likelihood of day being Red.
//similarly, trade can be held in expectation of price reaching the DnAv and stop loss can be trailed accordingly.
//Not a perfect system. But something to work on further to increase price action understanding.
//Be careful on days where consecutive 3rd Highest High or Lowest Low day is made and also on the next day after such day. Prices may turn direction at least for a short while.
Complete Credit goes to @pinecoders who gave me the main script on tradingview chat room.
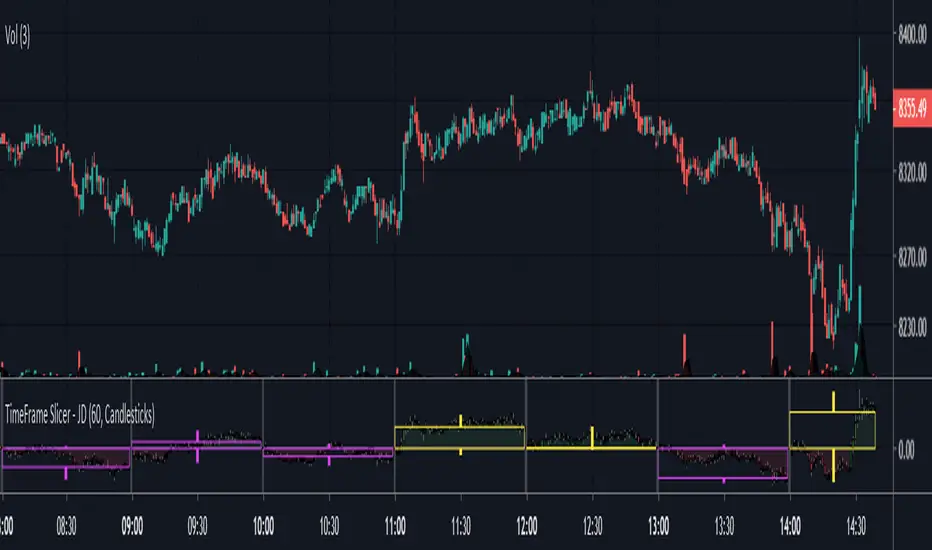
TimeFrame Slicer - JDThis script "slices up' the price action in hourly, daily, weekly,... slices
to give a view of the sentiment and price action or volume during the selected period.
Different time periods can be selected.
There is a choice to display the information in:
- normal candlesticks
- heikin ashi candles
- volume candles
JD.
#NotTradingAdvice #DYOR
Disclaimer.
I AM NOT A FINANCIAL ADVISOR.
THESE IDEAS ARE NOT ADVICE AND ARE FOR EDUCATION PURPOSES ONLY.
ALWAYS DO YOUR OWN RESEARCH!
Climatic Volume X- Climate volume detection
- Relative volume value in bar
- Automatic zone generation (possibility of configuration)
- Additional features
¡¡¡Thumbs up¡¡¡
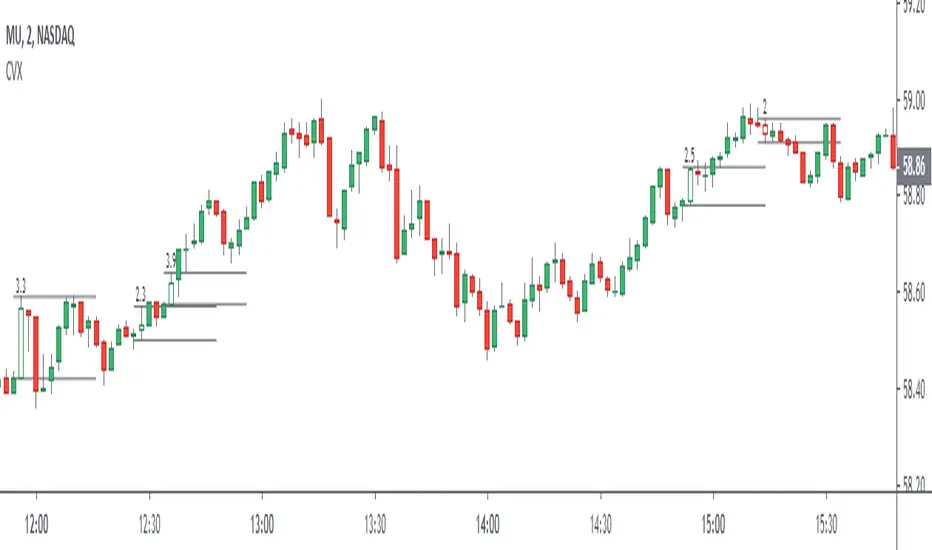
Red and Green Ignored Bar by Oliver VelezOn this occasion I present a script that detects Ignored Red Candles and Ignored Green Candles, basically it is a Price Action event that indicates a possible continuation of the current trend and gives the opportunity to climb it with a Very tight risk, before delving into detail I would like to leave this note:
Note: the detection of this event does not guarantee that the signal will be good, the trader must have the ability to determine its quality based on aspects such as trend, maturity, support / resistance levels, expansion / contraction of the market, risk / benefit, etc, if you do not have knowledge about this you should not use this indicator since using it without a robust trading plan and experience could cause you to partially or totally lose your money, if this is your case you should train before If you try to extract money from the market, this script was created to be another tool in your trading plan in order to configure the rules at your discretion, execute them consistently and have AUTOMATIC ALERTS when the event occurs, which is where I find more value because you can have many instruments waiting for the event to be generated, in the time frame you want and without having to observe the mer When the alert is generated, the Trader should evaluate the quality of the alert and define whether or not to execute it (higher timeframes, they can give you more time to execute the operation correctly).
Let's continue….
This event was created by Oliver Velez recognized trader / mentor of price action, the event has a very interesting particularity since it allows to take a position with a very limited risk in trend movements, this achieves favorable operations of good ratio and small losses when taking An adjusted risk, if the trade works, a good ratio is quickly achieved and we agree with a key point in the “Keep small losses and big profits” trading, this makes it easier to have a positive mathematical hope when your level of Success is not very high, so leave you in the field of profitability.
THE EVENT:
The event has a bullish configuration (Ignored Red Candle) and a bearish configuration (Ignored Green Candle), below I detail the “Hard” rules (later I explain why “Hard”):
1- Last 3 bars have to be GREEN-RED-GREEN (possible bullish configuration) or RED-GREEN-RED (possible bearish configuration), the first bar is called Control Bar, the second is called Ignored Bar and the third Signal Bar as shown in the following image:
2- Be in a trend determined by simple moving averages (Slow of 20 periods and Fast of 8 periods), as a general rule you can take the direction of MA20 but the Trader has to determine if there is a trend movement or not.
3- Control bar of good range, little tail and with a body greater than 55%.
4- Ignored bar preferably narrow range, little tail and that is located in the upper 1/3 of the control bar.
5- Signal bar cannot override the minimum of the ignored bar.
6- Activation / Confirmation of event by means of signal bar in overcoming the body of the ignored bar.
Some examples of ignored bars (with “Hard” and “Flexible” rules):
Features and configuration of the indicator:
To access the indicator settings, press the wheel next to the indicator name VVI_VRI "Configuration options".
- Operation mode (Filtering Type):
• Filtering Complete: all filters activated according to the configuration below.
• Without Filtering: all filters deactivated, all VRI / VVI are displayed without any selection criteria.
• Trend Filter only: shows only VRI / VVI that are in accordance with what is set in “Trend Settings”
- Configuration Moving Averages:
• See Slow Media: slow moving average display with direction detection and color change.
• See Fast Media: display of fast moving average with direction detection and color change.
• Type: possibility to choose the type of media: DEMA, EMA, HullMA, SMA, SSMA, SSMA, TEMA, TMA, VWMA, WMA, ZEMA)
• Period: number of previous bars.
• Source: possibility to choose the type of source, open, close, high, low, hl2 hlc3, ohlc4.
• Reaction: this configuration affects the color change before a change of direction, 1 being an immediate reaction and higher values, a more delayed reaction obtaining les false "changes of direction", a value of 3 filters the direction quite well.
- Trend Configuration
• Uptrend Condition P / VRI: possibility to select any of these conditions:
o Bullish MA direction
o Quick bullish MA direction
o Slow and fast bullish MA direction
o Price higher than slow MA
o Price higher than fast MA
o Price higher than slow and fast MA
o Price higher than slow MA and bullish direction
o Price higher than fast MA and bullish direction
o Price higher than slow, fast MA and bullish direction
o No condition
• Condition P / VVI bear trend: possibility of selecting any of these conditions:
o Slow bearish MA direction
o Fast bearish MA direction
o Slow and fast bearish MA direction
o Price less than slow MA
o Price less than fast MA
o Price less than slow and fast MA
o Price lower than slow MA and bearish direction
o Price less than fast MA and bearish direction
o Price less than slow, fast MA and bearish direction
o No condition
- Control bar configuration
• Minimum body percentage%: possibility to select what body percentage the bar must have.
• Paint control bar: when selected, paint the control bar.
• See control bar label: when selected, a label with the legend BC is plotted.
- Configuration bar ignored
• Above X% of the control bar: possibility to select above what percentage of the control bar the ignored bar must be located.
• Paint ignored bar: when selected, paint the ignored bar.
- Signal bar configuration
• You cannot override the minimum of the ignored bar: when selected, the condition is added that the signal bar cannot override the minimum of the ignored bar.
• Paint signal bar: when selected, paint the signal bar.
• See arrow: when selected it shows the direction arrow of the possible movement.
• See bear and arrow: when selected it shows bear and arrow label
• See bull and arrow: when selected it shows bull and arrow label
The following image shows the ignored bar and painted signal:
- Take profit / loss
The profit / loss taking varies depending on the trader and its risk / monetary plan, the proposal is a recommendation based on the nature of the event that is to have a small risk unit (stop below the minimum of the ignored bar), look for objectives in ratios greater than 2: 1 and eliminate the risk in 1: 1 by taking the stop to BE, all parameters are configurable and are the following:
• See recommended stop loss and take profit: trace the levels of Stop, BE, TP1 and TP2, as well as their prices to know them quickly based on the assumed risk
• To: select which event you want to draw the SL and TP (VRI, VVI)
• Extend stop loss line x bars: allows extending the stop line by x number of bars
• Extend take profit line x bars: allows extending the stop line by x number of bars
• Ratio to move to break even: allows you to select the minimum ratio to move stop to break even (default 1: 1)
• Take profit 1 ratio: allows you to select the ratio for take profit 1 (default 2: 1)
• Take profit 2 ratio: allows you to select the ratio for take profit 2 (default 4: 1)
- Alerts
• It is possible to configure the following alerts:
-VRI DETECTED
-VVI DETECTED
-VRI / VVI DETECTED
Final Notes:
- The term hard rules refers to the fact that an event is sought with the rules detailed above to obtain a high quality event but this brings 2 situations to consider, less
number of events and events that are generated in a strong impulse may be leaked, a very large control bar followed by an ignored narrow body away from moving averages, despite having a good chance of continuing, taking a stop very tight in a strong impulse you can touch it by the simple fact of the own volatility at that time.
- The setting of the parameters “Minimum body percentage% (control bar)”, “Above x% of the control bar (bar ignored)” and “Cannot override the minimum of the ignored bar” can bring large Benefits in terms of number of events and that can also be of high quality, feel free to find the best configuration for your instrument to operate.
- It is recommended to look for trending events, near moving averages and at an early stage of it.
- The display of several nearby VRIs or VVIs in an advanced trend may indicate a depletion of it.
- The alerts can be worked in 2 ways: at the closing of the candle (confirms event but the risk unit may be larger or smaller) or immediately the body of the ignored bar is exceeded, in case you are operating from the mobile and miss many events because of the short time I recommend that you operate in a superior time frame to have more time.
- The indicator is configured with “flexible” rules to have more events, but without any important criteria, each trader has to look for the best configuration that suits his instrument.
- It is recommended to partially close the operation based on the ratio and always keep a part of the position to apply manual trailing stop and try to maximize profits.
The code is open feel free to use and modify it, a mention in credits is appreciated.
If you liked this SCRIPT THUMB UP!
Greetings to all, I wish you much green!

Elephant Bar by Oliver VelezThis script detects an event created by Oliver Velez, basically it is a wide-range candle, its range is noticeably larger than the previous candles, this event indicates a possible continuation of the movement, or the beginning of an extended movement. The candle has to be of good body, as a rule it can be taken that the body must be more than 70%. The stop goes below the minimum of the candle and the signal is given when the next candle followed by the elephant candle exceeds its body, this condition is not programmed so that the alert indicates that an elephant candle was generated and the trader has some time to visualize the graph and wait for the signal. Example below:
NOTE: IT IS VERY IMPORTANT THAT THE TRADER ANALYZE THE CONTEXT OF THE MARKET WHERE THE ELEPHANT BAR IS GENERATED AND DETERMINE ACCORDING TO ITS EXPERIENCE IF THE EVENT HAS A GOOD PROBABILITY OF PROJECTION, YOU MUST NOT TAKE AN ENTRY ONLY BY THIS EVENT, IF YOU DO YOU WILL LOSE ALL YOUR MONEY
.
One of the problems of the elephant bar is that it generates a fairly wide risk unit with respect to other narrow range events, so the risk / benefit ratio is not very large, but it is an event that deserves attention when it occurs in a good location since it generally generates continuation.
If you want to have a lower risk unit and improve the risk / benefit ratio, you can play the “Gift Zone”, when detecting an elephant bar you can wait for a step back inside the elephant bar area and take a position, this will give you a less distance to the stop, but this can lead to the event escaping if there is no recoil.
- The size of the candle is determined by comparing a range of previous candles (you can set the amount at your discretion)
- Search factor: by default 1.3, this means that all bars that have a range greater than the average range of previous candles + 30%, are considered elephant candles (can be configured at your discretion)
- Possibility to configure the percentage of the body that the elephant candle must have.
- Possibility of filtering up to 2 means with direction detection and color change (fully configurable)
- Possibility of filtering by mobile averages
- Alerts
- Additional features
Thumb up if you liked me ..

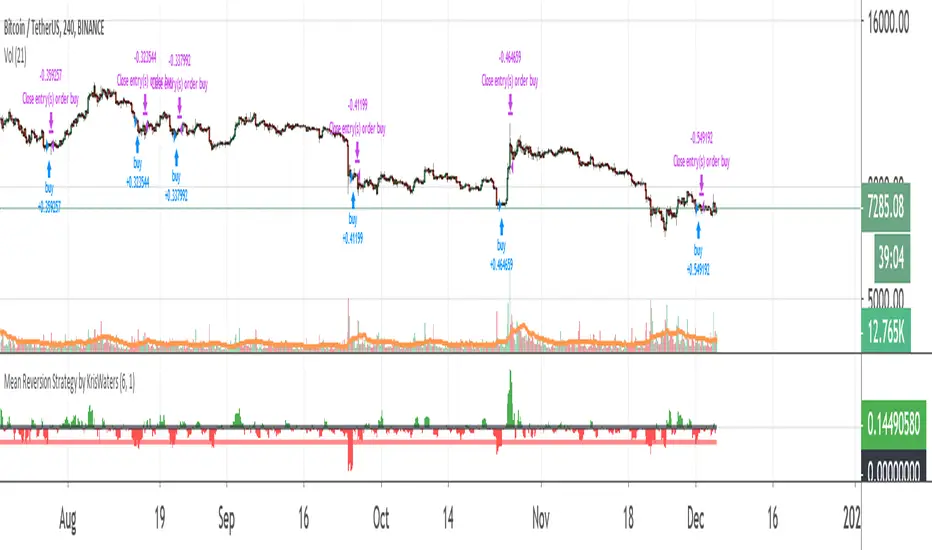
Mean Reversion Strategy by KrisWatersThis is a type of mean reversion strategy. It only generates long signals when the price is far away from the mean. It tries buy from the dip. Use it with BTC/USDT pair on 4 hour timeframe.
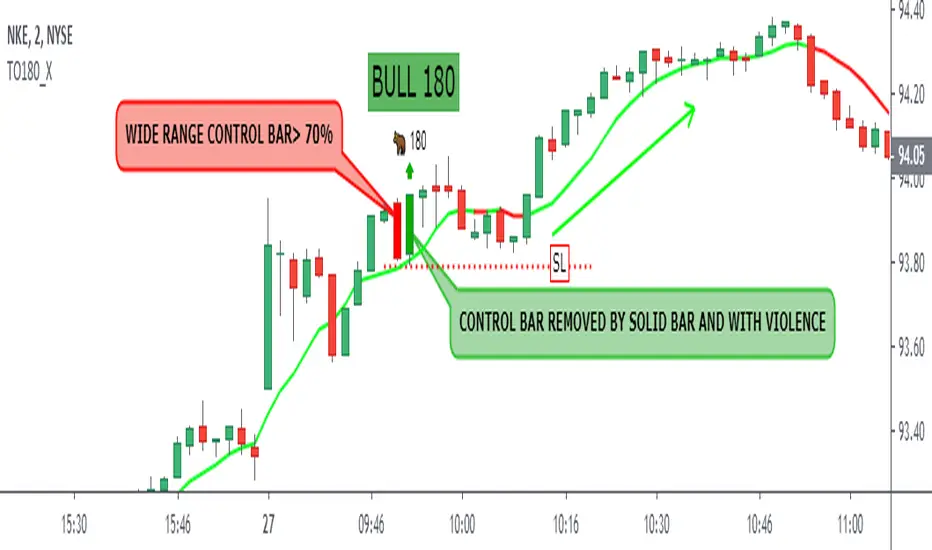
Bull Bear 180 by Oliver VelezThis script detects an event created by Oliver Velez is called Bull / Bear 180, in the following images the event is detailed:
- The size of the control bar can be set compared to a number of previous bars
- The minimum % of the control bar body can be set
- You can filter by trend
- Possibility of seeing fast and slow media with direction detection and color change
- Various graphic settings
- Event alerts
To enjoy!
A thumbs up if you like me!
The Fantastic Four of Oliver VelezThis script graphics the "fantastic 4" area, was created by oliver velez and is used in the opening of the american stock market, determined by:
1- ma200 at the closure of the previous day
2- ma20 at the closure of the previous day
3- price of previous day closure
4- activity of the last 30/60 min prior to the closure of the previous day (search the maximum and minimum)
Basically it is a very important support / resistance area the first hour from the opening, the trap area is an area in which it should be avoided to operate if the price opens within the same. In advance of being used as a support / resistance area if the price opens above the 4f is looking for longer opportunities (many more aspects should be evaluated) and if it is below.
Configuration:
- possibility to modify the amount of minutes of the activity of the previous day.
- possibility of hidding the "trap area" label.
- possibility of hidding the "change to temporary frame of 2 min" label.
Note: the temporary framework used is the 2 min, in the event of being in another temporary framework the indicator will not work and will be alerted with a label

