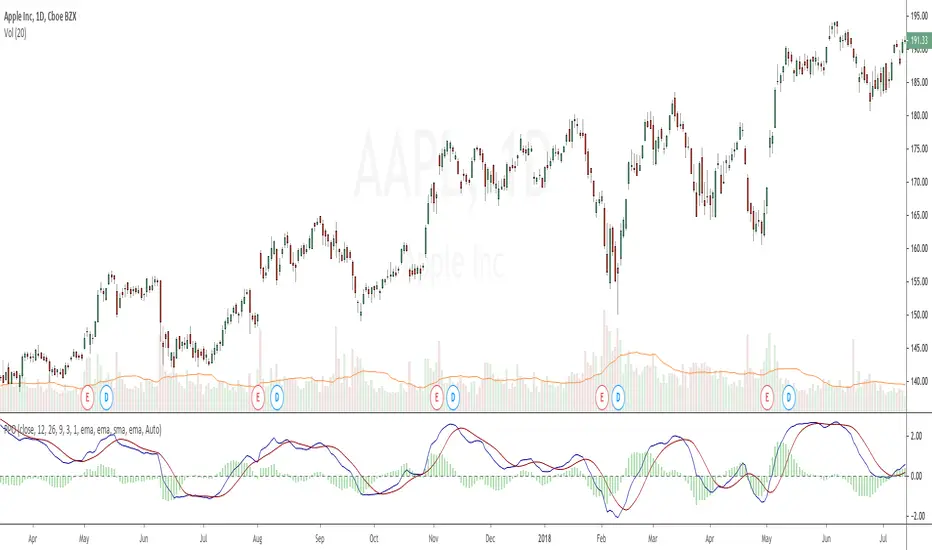
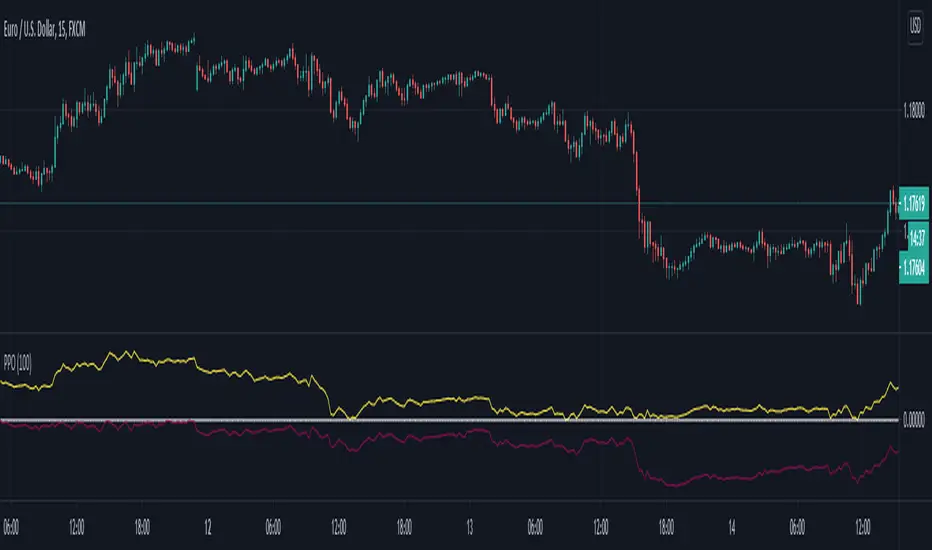
Price Oscillator (PPO)

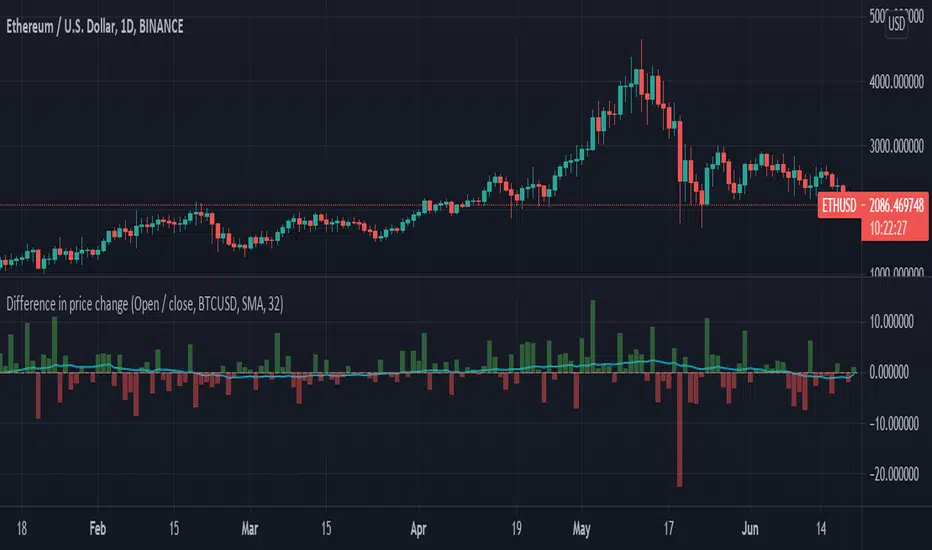
Difference in price changeCompares price change between current symbol and other one (eg. BTC vs S&P500). It calculates price change on each bar (from high to low or from open to close) and compares with price change of equivalent bar from the other source.
Example
Current symbol
open = 10 USD
close = 7 USD
change = -3 USD
% change = -30%
Second symbol
open = 3 USD
close = 4 USD
change = +1 USD
% change = +33%
Performance of price change = (-30) - (+30) = -63 // It means that current source has weaker performance right now

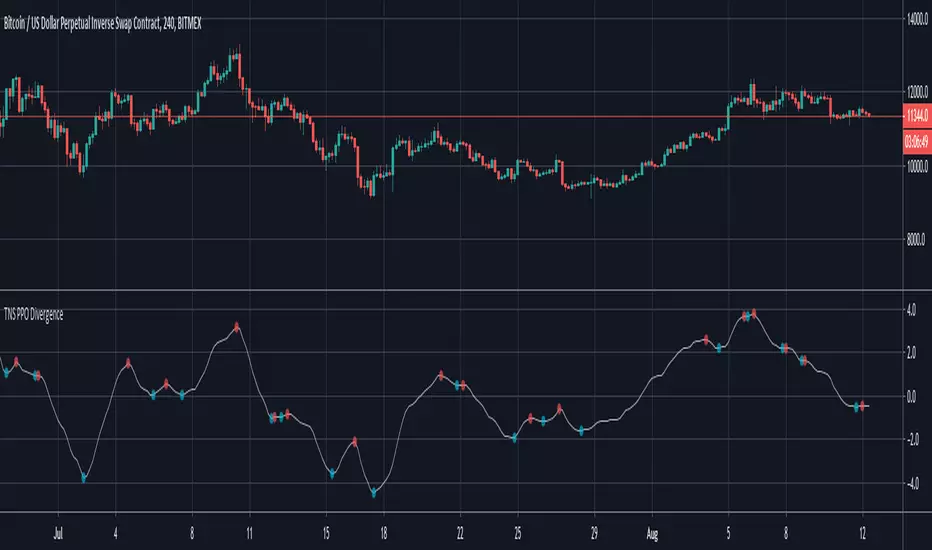
Detrended Rhythm Oscillator (DRO)How to detect the current "market beat" or market cycle?
A common way to capture the current dominant cycle length is to detrend the price and look for common rhythms in the detrended series. A common approach is to use a Detrended Price Oscillator (DPO). This is done in order to identify and isolate short-term cycles.
A basic DPO description can be found here:
www.tradingview.com
Improvements to the standard DPO
The main purpose of the standard DPO is to analyze historical data in order to observe cycle's in a market's movement. DPO can give the technical analyst a better sense of a cycle's typical high/low range as well as its duration. However, you need to manually try to "see" tops and bottoms on the detrended price and measure manually the distance from low-low or high-high in order to derive a possible cycle length.
Therefore, I added the following improvements:
1) Using a DPO to detrend the price
2) Indicate the turns of the detrended price with a ZigZag lines to better see the tops/bottoms
3) Detrend the ZigZag to remove price amplitude between turns to even better see the cyclic turns ("rhythm")
4) Measure the distance from last detrended zigzag pivot (high-high / low-low) and plot the distance in bars above/below the turn
Now, you can clearly see the rhythm of the dataset indicated by the Detrended Rhythm Oscillator including the exact length between the turns. This makes the procedure to "spot" turns and "measure" distance more simple for the trader.
How to use this information
The purpose is to check if there is a common rhythm or beat in the underlying dataset. To check that, look for recurring pattern in the numbers. E.g. if you often see the same measured distance, you can conclude that there is a major dominant cycle in this market. Also watch for harmonic relations between the numbers. So in the example above you see the highlighted cluster of detected length of around 40,80 and 120. There three numbers all have a harmonic relation to 40.
Once you have this cyclic information, you can use this number to optimize or tune technical indicators based on the current dominant cycle length. E.g. set the length parameter of a technical indicator to the detected harmonic length with the DRO indicator.
Example Use-Case
You can use this information to set the input for the following free public open-source script:
Disclaimer
This is not meant to be a technical indicator on its own and the derived cyclic length should not be used to forecast the next turn per se. The indicator should give you an indication of the current market beat or dominant beats which can be use to further optimize other oscillator or trading related settings.
Options & settings
The indicator allows to plot different versions. It allows to plot the original DPO, the DRO with ZigZag lines, the DRO with detrended ZigZag lines and length labels on/off. You can turn on or off these version in the indicator settings. So you can tweak it visually to your own needs.

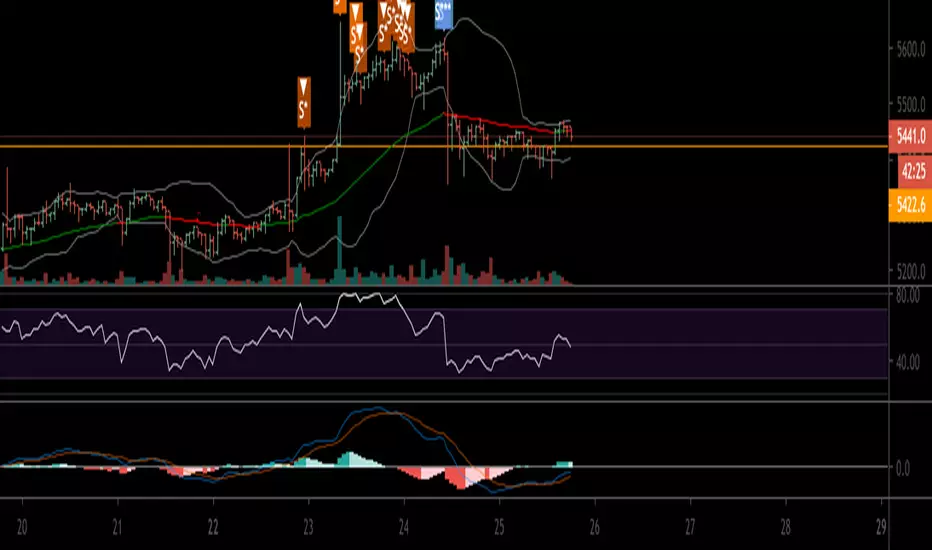
Momentum Trader + Trinity LinesThis is an updated version of the 'Momentum Trader' by user ProfitProgrammers + the 'Bollinger Bands %b & RSI & Stochastic Smoothed Indicator & Alert' by the user Zamboniman.
Links to those original scripts are below:
script/7S49kLWh-Bollinger-Bands-b-RSI-Stochastic-Smoothed-Indicator-Alert/
script/OMULR9es-Momentum-Trader/
The only real updates are so that it works on Version 4 of pinescript and some color and visual updates that makes these two scripts work well together. This must be used on normal candles and not HA or any other types or you can get misleading entry / exit points.
Here is some info about this indicator and the moving parts within it:
Chande Momentum Oscillator:
-Measures trend strength, with higher absolute values meaning greater strength.
-Also tracks divergence. When price increases, but is not accompanied by an increase in Chande Momentum Oscillator values, it signifies bearish divergence and a reversal is likely to follow.
-Shown as the teal and pink histogram.
Percentage Price Oscillator:
-Similar to the MACD , except that it expresses the difference between the two moving averages in terms of a percentage. This makes it a little easier to visualize.
-PPO values greater than zero indicate an uptrend, as that means the fast EMA is greater than the slow (and vice versa).
Trinity Lines:
-These 3 colored lines at the top are RSI + normalized Bollinger Band &b + normalized smoothed Stochastic.
-A confirmation entry for a long is when the lines are in the order from top to bottom of Green Yellow Red.
Entry and Exit Conditions:
Enter When:
1) Chande Momentum crosses over zero from negative to positive territory. AND
2) Chande Momentum is rising(positive slope). AND
3) Trinity lines are Green, Yellow, Red (Top to bottom)
Exit When:
1) Chande Momentum is greater than the upper line. AND
2) PPO has a negative slope. AND
3) Trinity lines are Red, Yellow, Green (Top to bottom)

MicroStrategy Software Business Share PriceSimilar to the MicroStrategy Premium script. This indicator derives MSTR's core software business value by calculating its Bitcoin holdings as a percentage of market cap. Thus you can do, (1 - Bitcoin holdings as a % of market cap) * current share price = Core business share price

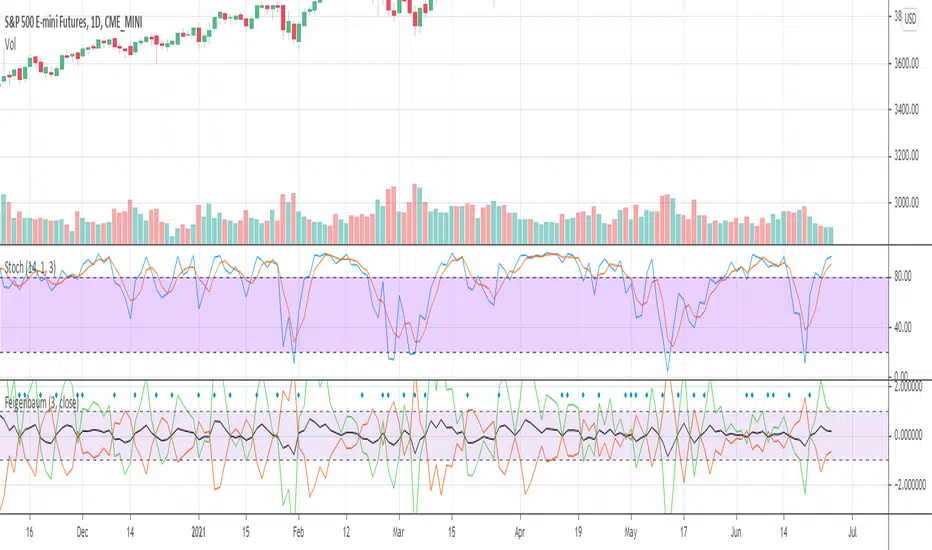
JamesCart's Feigenbaum Constant/Rate Of Change indicatorThis is an indicator that compares the rate of change as a proportion to the Feigenbaum Constant (The black line). The green line is a positive divergence from the rate of change, the red is a negative divergence from the rate of change. When the Red line is on top and the green line is on the bottom, then that is a bearish trend. When the Green is on top and the red is on bottom, that is a bullish trend. The black line also helps indicate a general bullish or bearish trend based on how it moves.
When the lines "open up" that means a trend is beginning, when the lines close that means the trend is ending. This indicator is a powerful leading indicator and needs sensitive eyes. Every small movement needs to be given consideration.
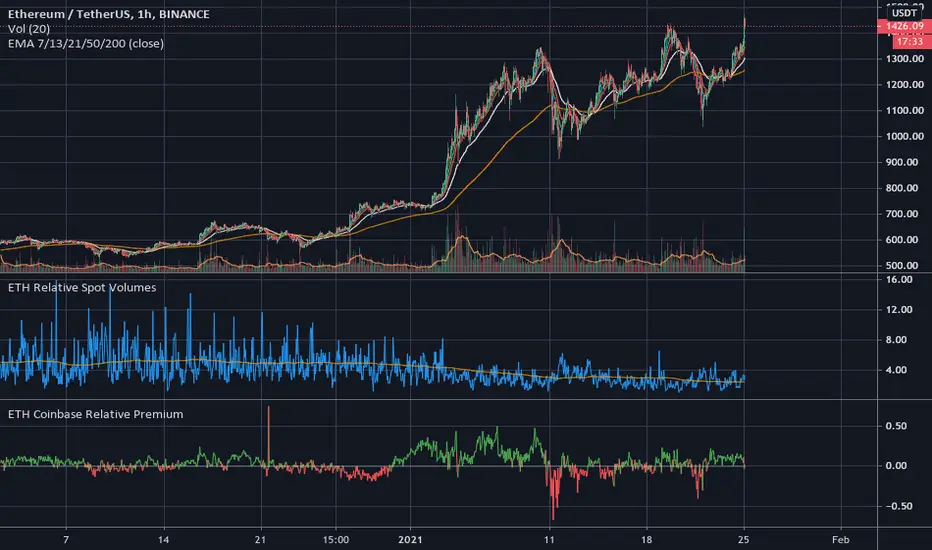
ETH Coinbase Relative PremiumIndicates the relative price premium on Coinbase ETHUSD market against Binance ETHUSDT market.
A great indicator for spotting US-driven spot buying.
Crypto _Market_Compare - XRAY vision Showing data from all corners of the crypto market. Each data input has is own color and label for better visuals. Left click the scale on the indicator and turn on "indicator labels" as well as "indicator value" and make sure there is "no overlapping labels".
This awesome visual is a quick glance tool to help you to grasp the health and current state of an asset vs the market and USD. Often traders overlook the importance of this and I always try to study this data to show what is possible for my profit goals and timeframe.
Things to look for and how these :
PATTERNS!
Crossings (up/down)
Levels
Status or Grade of each plot (which is lowest, low, high, higher, highest etc)
Send inquiries via message for paid access.

RogTrader HFT AlgoThis is a simple algorithm to generate Buy, Sell, Short, and Cover Signals. It uses the following:
RSI , MACD , Stochastic , Bollinger Bands , Ketler Channels, ATR Trailing Stop, Trend, and Volume .
Usage is simple: Green Background is Long and Red Background is Short positions.
LE = Long Entry
LX = Long Exit
SE = Short Entry
SX = Short Exit
This is not a trade recommendation, rather informative signals, and please do your due diligence. Thanks!

Micro Strategy PremiumSince the decision to buy 38,250 Bitcoin under their new treasury policy. Micro Strategy has become an easy and tax efficient way for many investors to gain an exposure to Bitcoin.
This script displays:
- Micro Strategy premium vs price of BTCUSD (CME)
- Micro Strategy premium vs price of BTCUSD (CME) minus Nasdaq 100 (QQQ ETF). A straightforward method to detach Micro Strategy’s share price from the overall performance of the US tech sector. This could potentially give you a more accurate premium.
- Micro Strategy’s 38,250 BTC as a percentage of their Market Cap
This script also acknowledges that Micro Strategy should be renamed “Macro Strategy” and that Michael Saylor is a living legend.

Percentage Oscillator Swing highest high and lowest lowThis is a simple but efficient indicator.
Its made from an oscillator, which is calculated from the current close price with the highest high and the lowest low over a period of time.
This way we can see how much prices has changed over a X ammount of candles ( in positive or negative ) .
US Inflation Rate [nb]This is the United States inflation rate, based on the total Consumer Price Index published by the U.S. Bureau of Labor Statistics.
Option to toggle:
A line to display the inflation rate in December. It does not change until the next December.
What the color change to red is indicative of:
According to the Federal Open Market Committee (FOMC) regarding inflation rate, "2% is a bae number to be around". This does not imply a strict 2% inflation for success and allows room for federal rate cuts should they be needed.
Although FOMC declared 2% to be "bae" in 2012, James Bullard, of federal banking fame, claims that started to become the norm in 1995. Therefore the inflation rate line will only turn red 1995 onwards, and serves as a friendly reminder that inflation has been over at or over 2% for more than one month.
Sources:
www.bls.gov
www.federalreserve.gov
www.stlouisfed.org

CustomCrossCorrelations+AlertsJust a bunch of neatly displayed commonly used/_reused_ indicators that I mainly use alongside cross-correlation. Simply put, this script might help other traders to enter trades indicative of moves to the upside/downside and want to see more confirmation such as crosses and/or confluence areas.
Feel free to customize to your liking and adjust the options as needed. Credits are given to the other authors whose scripts were referenced and used as boilerplate. Feedback appreciated as well!
Disclaimer: Potential signals are subjective, to each his own. Although some settings may need to be tweaked to the trader's preferences, some prove worthy.

Momentum TraderThis study combines two versatile momentum indicators :
Chande Momentum Oscillator:
-Measures trend strength, with higher absolute values meaning greater strength.
-Also tracks divergence. When price increases, but is not accompanied by an increase in Chande Momentum Oscillator values, it signifies bearish divergence and a reversal is likely to follow.
-Shown as the teal and pink histogram.
Percentage Price Oscillator:
-Similar to the MACD, except that it expresses the difference between the two moving averages in terms of a percentage. This makes it a little easier to visualize.
-PPO values greater than zero indicate an uptrend, as that means the fast EMA is greater than the slow (and vice versa).
Entry and Exit Conditions:
Enter When:
1) Chande Momentum crosses over zero from negative to positive territory. AND
2) It has been less than 3 bars since Chande Momentum was less than the lower green line. AND
3) Chande Momentum is rising(positive slope).
Exit When:
1) Chande Momentum is greater than the upper line. AND
2) It has been less than 6 bars since the PPO value was greater than the upper bound. AND
3) PPO is less than 5 (meaning the difference between the two EMA's is less than 5%). AND
4)PPO has a negative slope.
This study comes with alert conditions for long entries and exits.
~Happy Trading~

Combination RSI & PPO%Shows signal bullish when RSI < 30 and MACD fast is below MACD slow and MACD fast is below -0.5
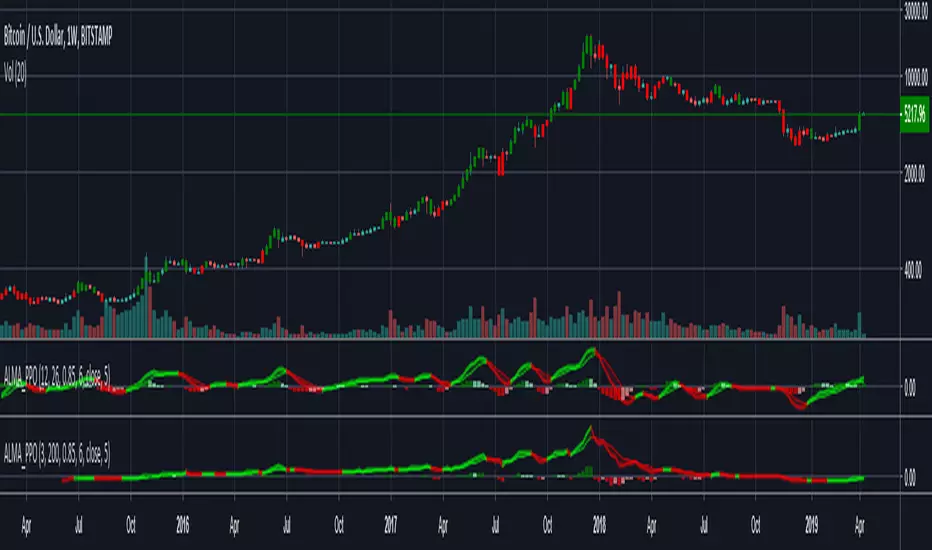
ALMA PPO - Percentage Price OscillatorSimple redo of PPO using ALMA
-------------------------------------------------------------------------------------------------------------------------------------------
If you find it useful please consider a tip/donation : BTC - 3BMEXEDyWJ58eXUEALYPadbn1wwWKmf6sA
PPO Percentile RankThis indicator is based off of the ChrisMoody CM_Laguerre PPO PercentileRank V2 Mkt Tops & Bottoms and The Lark's Laguerre PPO code.
I changed it to use basic moving averages rather than Laguerre, including changing the inputs to MA lengths so that you can coordinate the indicator with other filters more easily.
I also added the option to change the input price and changed the visual look and some other minor changes.

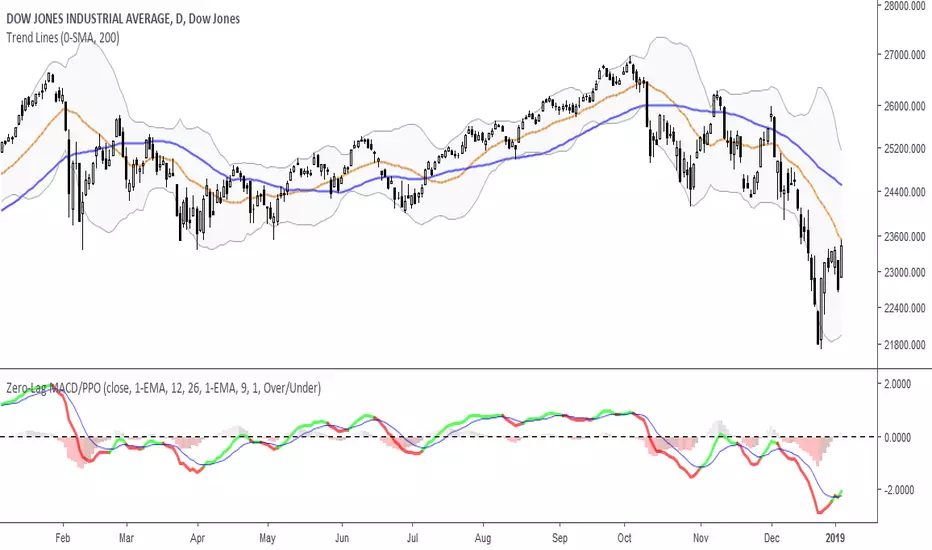
Zero-Lag MACD/PPOMACD/PPO Indicator, with optional faster EMA's to reduce lag.
-Use "MA TYPE" to select SMA, EMA, Double-EMA, Triple-EMA, or Hull as the MACD Source. Default is 'EMA'.
-Use "FAST MA" and "SLOW MA" to set the fast and slow period lengths.
-Use "SIGNAL TYPE" to select SMA, EMA, Double-EMA, Triple-EMA, or Hull as the Signal formula. Default is 'EMA'.
-Use "SIGNAL LENGTH" to set the Signal period length.
-Use "HIST. SIZE" to change the scaling of the histogram and make it stand out more.
-Use "COLOR SIGNALS" to select when to signal green/red on the MACD line.
--- "None" is always black.
--- "Over/Under" will signal based on MACD being over or under the Signal line.
--- "Rising/Falling" will signal based on MACD being over/under the Signal line and both are rising/falling.
-Use "PPO INSTEAD" to use Price Percent Oscillator scaling (works better for long-term and large price fluctuation).
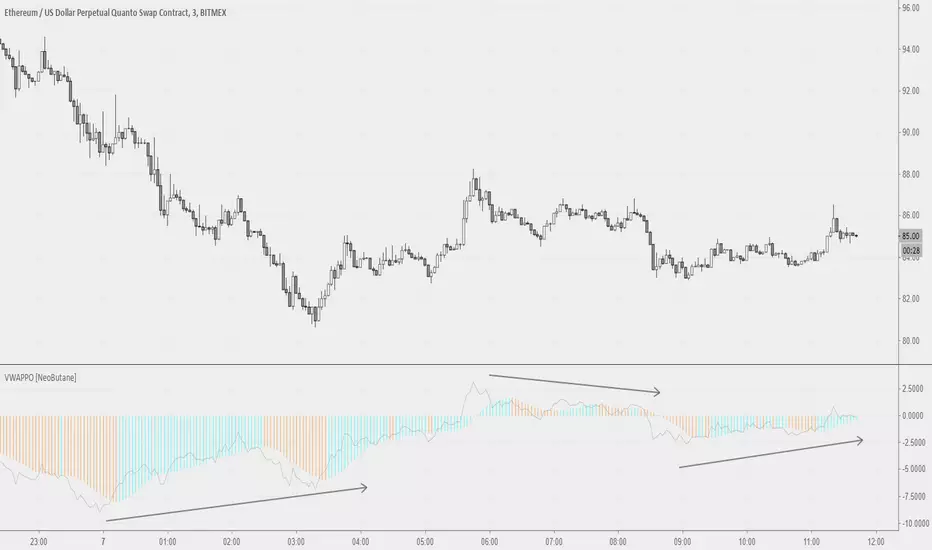
Volume Weighted Average Price Oscillator [NeoButane]VWAP on PPO but not PPO. Two histograms, with the second one being SMAs of the first and signals color/trend change.
1.0 - Release
Framework laid out
Power level readings should be within 9000
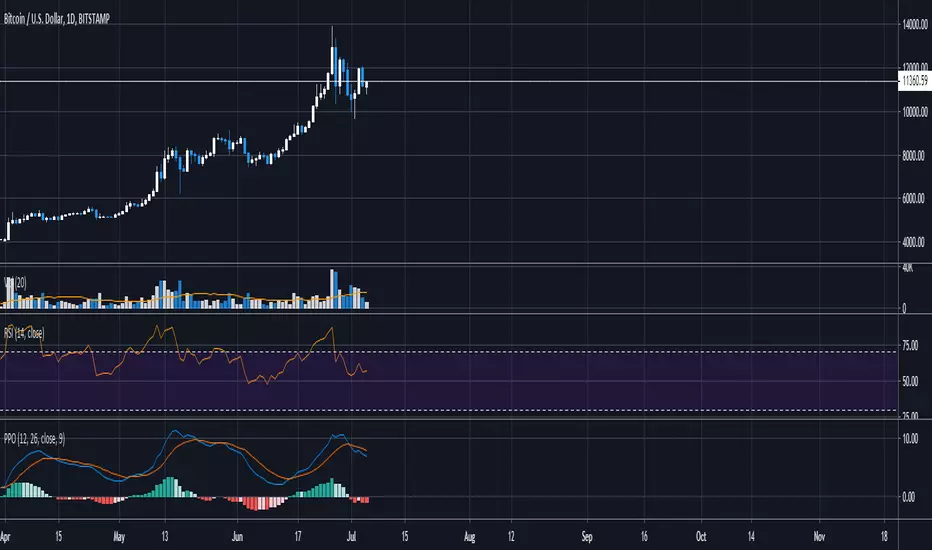
Percentage Price OscillatorThe Percentage Price Oscillator (PPO) is a momentum oscillator that measures the difference between two moving averages as a percentage of the larger moving average. As with its cousin, MACD, the Percentage Price Oscillator is shown with a signal line, a histogram and a center line. Signals are generated with signal line crossovers, center line crossovers, and divergences. More info here and here .
The indicator allows you to change the type of all moving averages (Simple, Exponential, Weighted, Volume-weighted, Triple EMA or a moving average that uses RSI ). The indicator also allows you to volume weight it(turned on by default), which will turn it into an indicator very similar to the Volume-Weighted Moving Average Convergence Divergence (VW-MACD) first used by Buff Pelz Dormeier in 2002 and described in detail in his book "Investing with Volume Analysis: Identify, Follow, and Profit from Trends". If you want to weight the oscillator against the true range instead of volume this is also possible. By default, this will be done automatically for assets that do not support volume. By checking the box "MACD" you can also turn this indicator into a standard MACD indicator.