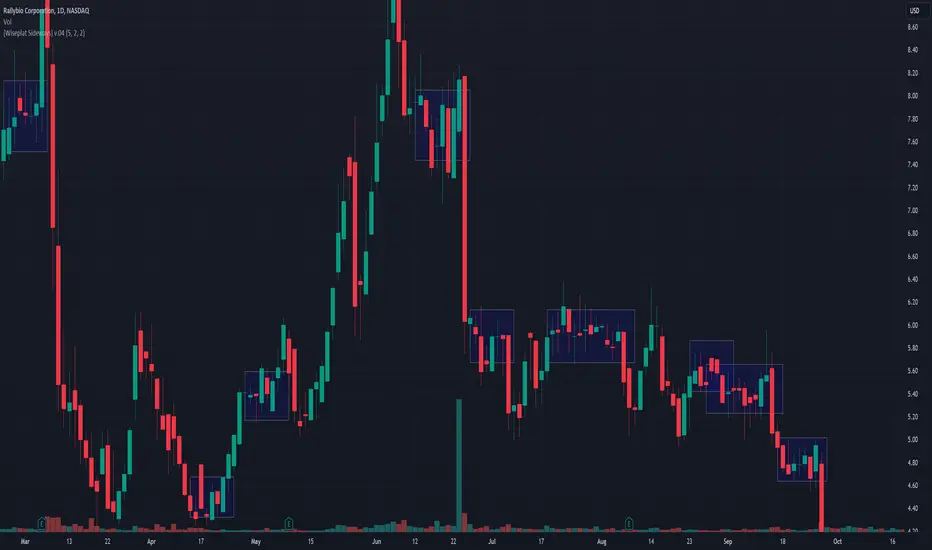
[Wiseplat Sideways] v.04The Sideway indicator for TradingView is a powerful tool designed to identify periods of sideways or ranging price action in the market. With its intuitive interface and customizable parameters, traders can easily spot when an asset is consolidating, providing valuable insights for both trend-following and range-bound strategies.
This indicator utilizes really simple algorithm to analyze price movement and volatility, effectively filtering out noise and false signals. By plotting clear visual cues on the chart.
Traders can adjust the sensitivity parameters to tailor the indicator to their specific trading style and preferences. Whether used in isolation or in conjunction with other technical analysis tools, the Sideway indicator empowers traders to make informed decisions in dynamic market conditions.
Its user-friendly design and simple settings of parameters makes it accessible to traders of all levels, from beginners seeking clarity in choppy markets to seasoned professionals looking for confirmation of their analysis. With the Sideway indicator, traders can confidently navigate sideways price action and stay ahead of the curve in their trading endeavors.
Developer: Oleg Shpagin
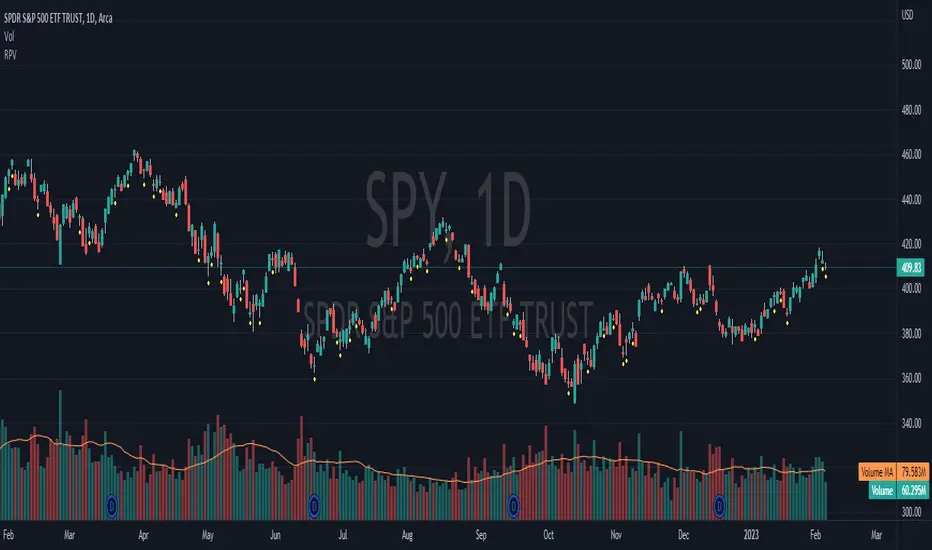
Price Volume Trend (PVT)
High Volume Price Bar ChannelThe "High Volume Price Bar Channel" indicator for TradingView is a tool designed to highlight price bars that experience unusually high trading volume compared to the average volume over a specified lookback period. When the volume of a price bar exceeds a certain multiple of the average volume, a channel is drawn extending from the high to the low of that bar, indicating a potential surge in trading activity.
Key Features:
Customizable Parameters: Users can adjust the color of the channel, the lookback period for calculating the average volume, and the factor by which the current volume should exceed the average volume to trigger the drawing of the channel.
Volume-based Highlighting: The indicator identifies price bars with high volume relative to the average and visually highlights them by drawing a channel.
Flexibility: Traders can tailor the indicator settings to suit their trading strategies and preferences, allowing for adaptability across various market conditions.
Usage:
High volume often indicates increased market activity and potential price volatility. Traders may use this indicator to identify periods of heightened interest or potential trend reversals.
When the channel is drawn, traders may look for confirmation from other technical indicators or price action to make informed trading decisions, such as entering or exiting positions, adjusting stop-loss levels, or assessing the strength of a trend.
The indicator can be applied to various timeframes and financial instruments, providing insights into volume dynamics across different market environments.
Overall, the "Customizable Volume Channel" indicator offers traders a versatile tool to spot significant volume spikes and potential trading opportunities within the context of price movements, aiding in more informed decision-making and risk management strategies.

Forex Multi-Factor IndicatorMoving Averages (MA):
Two moving averages are plotted on the chart: a fast MA (blue line) and a slow MA (red line).
The fast MA is calculated using a shorter period (10 periods by default), while the slow MA is calculated using a longer period (30 periods by default).
Moving averages help identify trends by smoothing out price fluctuations. When the fast MA crosses above the slow MA, it suggests a bullish trend, and when the fast MA crosses below the slow MA, it suggests a bearish trend.
Relative Strength Index (RSI):
The RSI indicator (orange line) is plotted on a separate axis.
RSI measures the speed and change of price movements and oscillates between 0 and 100.
RSI values above 70 are considered overbought, indicating a potential reversal to the downside, while RSI values below 30 are considered oversold, indicating a potential reversal to the upside.
Volume Moving Average (Volume MA):
The volume moving average (purple line) is plotted on the same axis as the volume.
The volume moving average is calculated over a specified period (20 periods by default).
Volume analysis provides insights into the strength of price movements. When the volume increases along with price movements, it suggests strong conviction from traders.
Buy and Sell Signals:
Buy signals (green triangle) are generated when all of the following conditions are met:
The fast MA crosses above the slow MA (indicating a bullish trend).
The RSI is below the oversold level (indicating potential upward momentum).
The current price is above the fast MA, and the volume is higher than the volume MA (indicating positive volume trend).
Sell signals (red triangle) are generated when all of the following conditions are met:
The fast MA crosses below the slow MA (indicating a bearish trend).
The RSI is above the overbought level (indicating potential downward momentum).
The current price is below the fast MA, and the volume is lower than the volume MA (indicating negative volume trend).
Overall, this multi-factor indicator combines moving averages, RSI, and volume analysis to identify potential buying and selling opportunities in the Forex market. Traders can use the signals generated by this indicator as part of their trading strategy, but it's important to consider other factors such as risk management and market conditions before making trading decisions

VSA Volume Spread AnalysisVolume Spread Analysis with Trend Direction is an indicator designed to Identify trend based volume spread.
Volume
Spread
Trend
This is a very simple yet powerful to identify Trend and corresponding volume Breakout. Unlike other Volume Indicators this indicator detects Breakout along with trend direction. One can detect the Early breakout in volume using this indicator. The Buy or Sell Signal is based on zero crossing of the Histogram.
Trend direction is confirmed using the MA of the Histogram which is similar to the Volume MA on volume indicator. One can enter a trade using the indicator when Trend direction and histogram are in same direction. Entry is done when ever histogram crosses the Trend MA line.
Fake entries can be eliminated by changing the indicator to higher Timeframe.
Spread is determined using the difference in open and close of the candle
Volume change is determined using the ratio of change of volume to previous volume
EMA 10 is used to determine the Spread and multiplied by volume change so the
PRICE(ema10), Volume, Spread(close-open) are merged to one indicator.
Direction changes when ever difference of VSA is positive or negative.

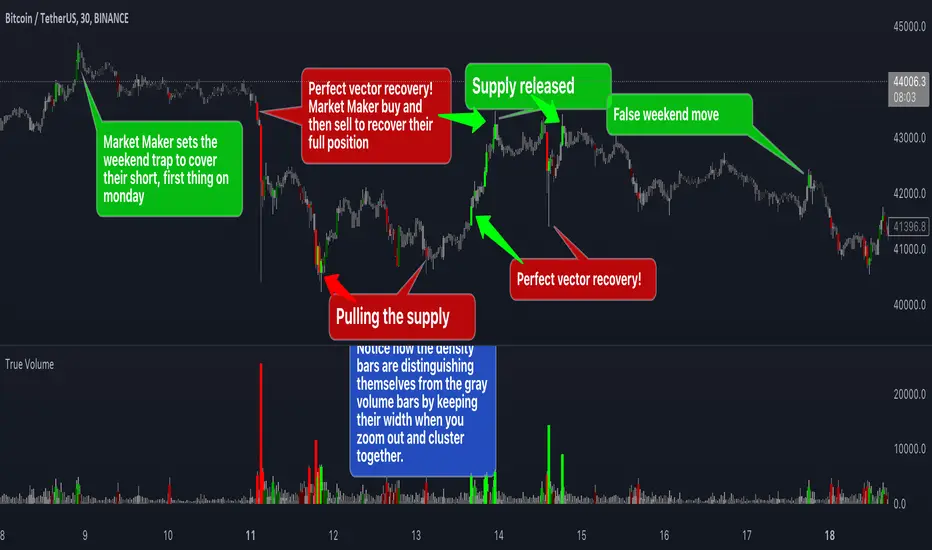
True VolumeThis indicator is designed to provide in-depth analysis of volume data from multiple sources and distinguish highly liquid candles by measuring the density of the volume. By focusing on the density and concentration of volume, rather than just the volume itself, it offers a more nuanced view of the market. This can be particularly beneficial in markets like cryptocurrencies, where understanding the role of market makers versus retail traders is crucial for strategic trading.
This is how it works:
Multiple Asset Integration:
Unlike standard volume indicators, True Volume allows the inclusion of up to four different assets (or the same asset from various exchanges) into its volume calculations. This feature provides a broader and more accurate total volume representation, essential in markets like cryptocurrencies where volume is dispersed across multiple exchanges.
Adjustable Time Anchors:
It offers various time anchor options, allowing traders to analyze volume data over different time periods or a specific amount of lookback candles. This flexibility helps in understanding volume trends over both short and long-term time frames.
Volume Density Analysis:
The core of this indicator is the innovative concept of Volume Density. It's calculated using a sigmoid function that normalizes the volume-to-price movement ratio in a unique way without needing a max cap or having the density column spike off the chart. This method helps in distinguishing between normal volume fluctuations and those that are unusually dense for the given price movement. This distinction is key in identifying potential market maker activities.
The Visuals:
The Volume Density is displayed in a unique way without compromising the original volume bars or cap the density. Infinite density can essentially be represented without having an infinitely large bar or caping out the density data. There's also two different color themes, optional bar color, and an option to flip the density bars up-side down for a different representation. Each of the original volume sources can be displayed separately as well. All colors as customizable as well for your own preference.
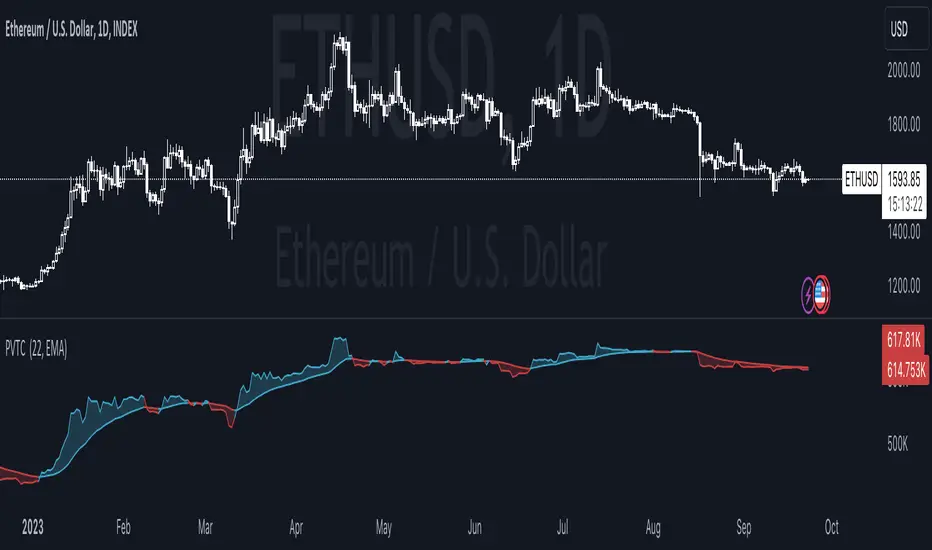
Price Volume Trend (PVT):
Included in this indicator is also the Price Volume Trend, which cumulatively measures the density delta, offering insights into the longer-term momentum of the market.
How do I trade it?
This indicator aims to give you insight into 'the other side of the trade', the Market Makers. When you buy, they provide liquidity by selling to you. That drives the Volume Density up.
Consider whether the market maker is currently long or short and might need to cover their position by wicking price back, or "adjust inventory". Especially towards the end of a market session.
Consider dense candles during market gaps or weekends to be market manipulation moves.
The density also goes up when stop losses are hit. If price makes a higher high or lower low, high density could indicate a liquidation event.
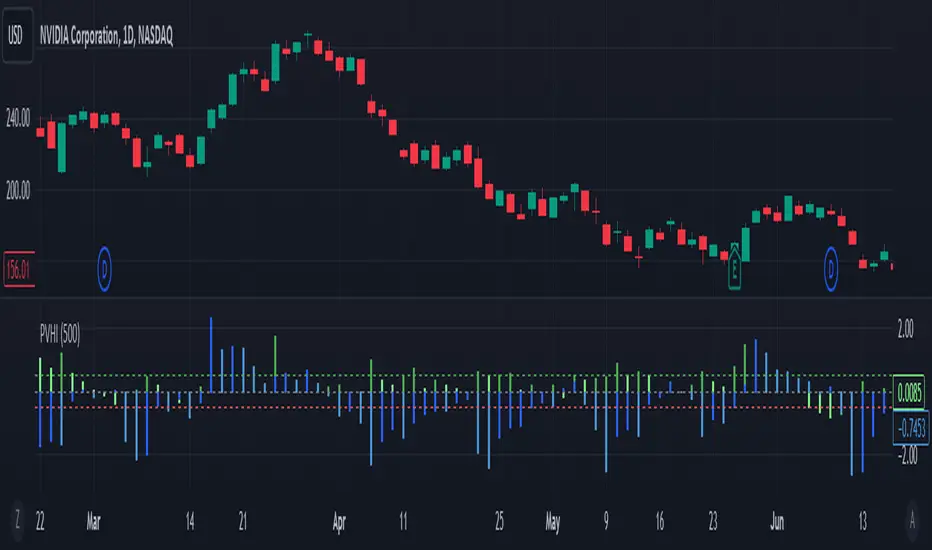
Price Volume Harmony Indicator [Nasan]The indicator "Price Volume Harmony Indicator " (abbreviated as PVHI) combines relative volume intensity (RVI) and relative price change (PC) to identify potential synergy or divergence between price and volume movements. Let's break down the key components and discuss how to interpret the output:
Relative Volume Intensity (RVI):
It calculates the mean volume intensity using simple moving averages (SMA) of different periods (5, 8, 13, and 144).
It then computes point volume intensity based on the current volume compared to the previous bar's volume.
The final RVI is a combination of mean and point volume intensities.
Relative Price Change (PC):
It calculates the median absolute deviation (MAD) and the price change relative to MAD for three different lengths (5, 8, and 13).
The average relative PC is a weighted combination of the three PC values.
Normalization:
RVI and PC are normalized using Z-scores (standard scores) to bring them to the same scale. This enables easier comparison.
Histogram Plotting:
The RVI and PC are plotted as histograms below the main price chart. Green color bars represent RVI, and blue color bars indicate PC. The RVI bars are light green when the RVI values are decreasing compared to previous bar. Similarly, when PC bars are light blue it indicates that the PC values are decreasing compared to previous bars.
There is a zero line +/- 0.5 SD lines movements above and below the SD lines are practically
significant.
Interpretation :
(1) Strong Bullish Movement :
This is when both the green bars (RVI) and blue bars (PC) increases and are on the same side above zero .
(2) Strong Bearish Movement :
This is when the green bars (RVI) increases and blue bars (PC) decreases. The green bars above zero but blue bars below zero.
(3) Weak Bullish Movement :
This is when the green bars (RVI) decreases and are below zero but the blue bars (PC) increases and are above zero .
(2) Weak Bearish Movement :
This is when both the green bars (RVI) and blue bars (PC) decreases. The green bars and blue bars are below zero.
This output is slightly hard to read but with practice can be read easily.
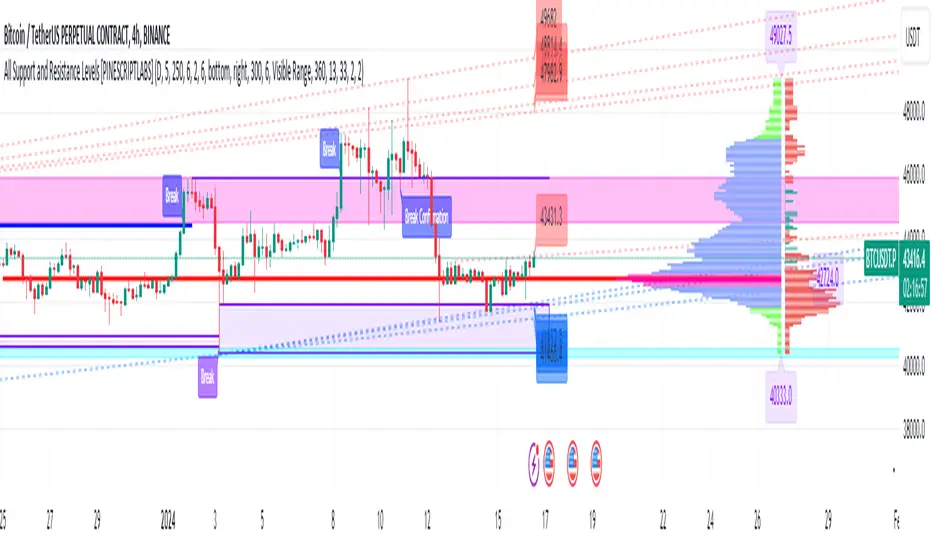
All Support and Resistance Levels [PINESCRIPTLABS]First, we observe the Light Blue Macro Supports and the Pink Macro Resistances. These channels are automatically formed based on market data, identifying pivot points in price history and determining the strength of these levels based on the number of pivot points within these same channels. When the price interacts with the macro Supports, we have a strong reaction that we can take advantage of in two ways:
1. The first and most common, as we can see in the chart, is that these zones elicit a strong reaction, and the price respects the channel. For us, as traders, it signifies a pivot point where we can initiate a trade, either a buy at the macro Support or a sell at the macro Resistance.
2. The second way to use them, for which this algorithm is also prepared, is in case a movement occurs where the price breaks these Macro Supports or Macro Resistances. We have a special alert that will notify us because when these macro channels are broken, they tend to do so violently in a move that we can also capitalize on. Usually, when such a breakout occurs, we will visit the next support or resistance channel, which can bring us significant benefits.
The following complex and highly accurate calculation provided by this indicator allows us to work with price supports and resistances within the internal structure of macro channels. As we can see in the chart, "boxes" are formed that represent the detected support and resistance areas. It also detects breakouts when the price crosses below the support "box" or above the resistance "box" and displays labels on the chart indicating when the breakout occurred, all in real-time. But here comes something very special: the algorithm also has a calculation that, as we see in the chart, there are occasions when the breakout occurs, but the price returns to the support or resistance "box" and is detected. At this moment, a label appears on the chart indicating a possible confirmation of the breakout. In other words, as the price initially broke out but returned to the "box," the algorithm will notify us with another label and a special alert when the price confirms the breakout.
At the same time, we can see in the chart that the algorithm also provides us with a volume profile that allows us to see where the most trading activity has concentrated based on price levels. We can also use it to identify support and resistance levels based on the point of control (POC) and value area levels. As we can see in the chart, there are labels with the exact price where the highest volume was traded. The top label in the chart shows the highest price, and the last label we see is for the lowest price. These displayed labels are within the defined range of retrocession or Lookback Length, which we can configure in our indicator. As we observe, the algorithm shows a strong confluence between the Macro Support channels and the volume profile labels, confirming the strongest areas of the range.
Finally, after calculating supports and resistances from three different perspectives, the algorithm provides us with a macro view of the price in the form of trend lines. In other words, it shows us supports and resistances in the form of diagonal channels where we can see trends in the market and areas where the price has historically encountered difficulties in advancing or retreating, which we can corroborate with the supports and resistances mentioned at the beginning.
As we can see in the chart, the algorithm also shows us labels with the exact price where angular price supports and resistances are located. These calculations are very important as they provide a trend perspective, and we can get an idea of where the price is headed, combining these with the other support and resistance calculations.
Remember that all the previous calculations have their own alerts for when supports or resistances are broken, or in the case of new channels being created, also when there is a breakout of a box or a confirmation of a breakout.
The second type of alert from the indicator is configured to make our indicators work for us without the need to be present on the chart, thanks to special programming within the indicator's code. It will execute automatic buys and sells on our preferred exchange through an alert configured for the 3Commas bot. All you need to do is input your Bot ID, provided by 3Commas, into the alert. All premium indicators come with a configuration explanation that will guide you in detail on where to input your Bot ID.
ESPAÑOL:
En primer lugar, observamos los Macro Soportes en color azul claro y las Macro Resistencias en color rosa. Estos canales se forman automáticamente en función de los datos del mercado, identificando puntos de pivote en el historial de precios y determinando la fuerza de estos niveles según la cantidad de puntos de pivote dentro de estos mismos canales. Cuando el precio interactúa con los macro Soportes, tenemos una fuerte reacción que podemos aprovechar de dos formas:
1. La primera y más común, como observamos en el gráfico, es que estas zonas provocan una fuerte reacción, y el precio respeta el canal. Para nosotros, como traders, significa un punto de pivote donde podemos generar una entrada, ya sea de compra en el macro soporte o de venta en la macro resistencia.
2. La segunda forma de utilizarlos, para la cual este algoritmo también está preparado, es en caso de que se genere un movimiento en el que el precio rompa estos Macro Soportes o Macro Resistencias. Contamos con una alerta especial que nos avisará, ya que al romperse estos macro canales suelen hacerlo con violencia en un movimiento que también podemos aprovechar. Regularmente, cuando existe este rompimiento, visitaremos el siguiente canal de soporte o resistencia, lo que nos puede traer grandes beneficios.
El siguiente cálculo complejo y muy preciso que nos ofrece este indicador nos permite trabajar con soportes y resistencias del precio dentro de la estructura interna de los canales macro. Como observamos en el gráfico, se producen "boxes" que representan las áreas de soporte y resistencia detectadas. Además, detecta breakouts cuando el precio cruza por debajo del "box" de soporte o por encima del "box" de resistencia y muestra etiquetas en el gráfico que nos indican cuándo ocurrió el breakout, todo esto en tiempo real. Pero aquí viene algo super especial: el algoritmo también tiene un cálculo que, como vemos en el gráfico, hay ocasiones en las que el breakout ocurre, pero el precio retorna al "box" de soporte o resistencia y es detectado. En este momento, aparece una etiqueta en el gráfico que nos muestra que estamos ante una posible confirmación del breakout. Es decir, como el precio había hecho en primer lugar el breakout pero regresó al "box", el algoritmo nos avisará con otra etiqueta y alerta especial cuando el precio confirme el breakout.
Al mismo tiempo, observamos en el gráfico que el algoritmo también nos muestra un perfil de volumen que nos permite ver dónde se ha concentrado la mayor actividad de negociación en función de los niveles de precios. También podemos usarlo para identificar niveles de soporte y resistencia basados en el punto de control (POC) y los niveles de valor (Value Area). Como vemos en el gráfico, tenemos etiquetas con el precio exacto donde se negoció la mayor cantidad de volumen. La etiqueta superior del gráfico nos muestra el precio más alto, y la última etiqueta que observamos es la de la parte baja, que nos indica el precio más bajo. Estas etiquetas mostradas están dentro del rango de retroceso definido o Lookback Length, que podemos configurar en nuestro indicador. Como observamos, el algoritmo nos muestra una fuerte confluencia entre los canales de soporte Macro y las etiquetas del perfil de volumen, lo que nos confirma las áreas más fuertes del rango.
Por último, después de hacer los cálculos de soportes y resistencias desde tres perspectivas distintas, el algoritmo nos proporciona una visión macro del precio en forma de líneas de tendencia. Es decir, nos muestra soportes y resistencias en forma de canales diagonales donde tendremos representadas las tendencias en el mercado y áreas en las que el precio históricamente ha encontrado dificultades para avanzar o retroceder, lo que podemos corroborar con los soportes y resistencias de los que hablamos al principio.
Como observamos en el gráfico, el algoritmo también nos muestra las etiquetas con el precio exacto donde se encuentran los soportes angulares del precio y las resistencias angulares. Estos cálculos son importantísimos, ya que nos ofrecen una perspectiva de tendencia y podemos tener una visión de hacia dónde se dirige el precio, combinando estos con los otros cálculos de soportes y resistencias.
Recuerden que todos los cálculos anteriores tienen su propia alerta para cuando los soportes o resistencias se quiebren o en su caso, se creen nuevos canales, también cuando haya una ruptura de un "box" o una confirmación de ruptura.
El segundo tipo de alerta del indicador está configurada para que nuestros indicadores trabajen para nosotros sin necesidad de estar presentes en el gráfico, esto mediante una programación especial dentro del código del indicador que realizará compras y ventas automáticas en nuestro Exchange de preferencia mediante una alerta configurada para el bot 3Commas. Solo bastará con que pongamos nuestro número de Bot o Bot ID que da el proveedor de 3Commas y lo insertemos en la alerta. Todos los indicadores premium tienen en su configuración una explicación detallada sobre dónde poner tus Bot ID.
Price Volume Trend Crosses This script is a modified version of the Price Volume Trend ( PVT ) that uses a moving average of the PVT as a signal ( sig ) line.
The length of the signal line can be adjusted as needed by changing the "PVTC Signal Length" value inside the indicator settings menu.
"PVTC Signal Type" allows you to pick between EMA and SMA as the signal line.
Logic behind this script:
If PVT > sig it indicates an bullish environment and gets coloured with the UP color.
If PVT < sig it indicates a bearish environment and get coloured with the DOWN color.
Colors can be modified in the indicator settings menu.
Crosses can be highlighted by ticking the "Highlight Crosses" box in the indicator settings menu.
"Fill Gaps" fills the gap between PVT and sig with the prevailing trends color.
PVTC should not be used on its own but in conjunction with other indicators!
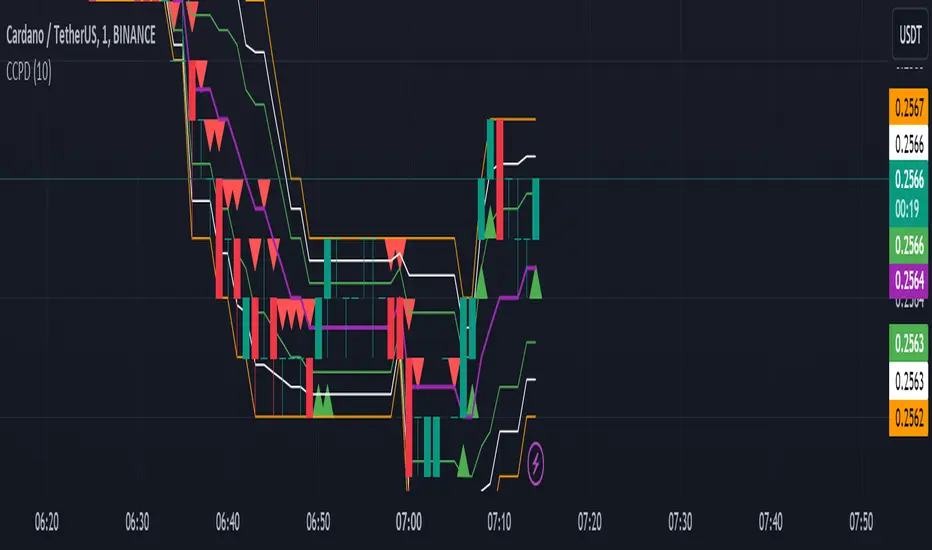
CCPD Candle Color Price DetectorThe "CCPD Candle Color Price Detector" is a custom indicator developed for TradingView, a popular platform for technical analysis and trading. This indicator assists traders in identifying potential trend reversals and assessing market sentiment based on candlestick color changes and key price levels.
This indicator operates as follows:
Color Change Detection: It primarily focuses on the color of candlesticks (green for bullish and red for bearish). When a candlestick closes higher than it opens, it is considered green (bullish), and when it closes lower, it is red (bearish).
High and Low Analysis: The indicator calculates the highest high and lowest low over a user-defined number of bars (specified by the 'Bars for High/Low' input parameter). This helps identify recent price extremes.
Midpoint Calculation: It then computes the midpoint between the highest high and lowest low, effectively determining a central reference point within the specified period.
Signal Generation: Buy and sell signals are generated based on the relationship between the current candlestick's close price, the midpoint, and the candlestick color. Buy signals occur when a green candle closes above the midpoint, suggesting potential bullish momentum. Conversely, sell signals trigger when a red candle closes below the midpoint, indicating possible bearish pressure.
Visualization: The indicator visualizes the highest high, lowest low, midpoint, and additional lines to aid in understanding the price action and potential reversal points.
Alerts: It provides alerts for buy and sell signals, allowing traders to receive notifications when potential trading opportunities arise.
Usage:
Traders can utilize the "CCPD Candle Color Price Detector" in the following ways:
Trend Reversal Identification: This indicator can help traders spot potential trend reversals by signaling when candlestick colors change and close near the midpoint. Buy and sell signals offer entry points for trades based on these reversals.
Confirmation Tool: It can be used in conjunction with other technical analysis tools to confirm trading decisions. For example, a buy signal from this indicator, coupled with a bullish trendline break or a bounce from a key support level, may provide a stronger bullish signal.
Risk Management: By understanding potential reversal points and using stop-loss orders, traders can better manage their risk and protect their capital when entering positions based on the indicator's signals.
Customization: The indicator allows users to adjust the number of bars for high/low calculations, making it adaptable to different trading strategies and timeframes.
In summary, the "CCPD Candle Color Price Detector" is a versatile indicator that can aid traders in spotting potential trend changes, enhancing trading decisions, and managing risk effectively. However, like any trading tool, it should be used in conjunction with other analysis methods and risk management strategies for optimal results.
[TTI] Price confirmation indicator📜 ––––HISTORY & CREDITS––––
The Price Confirmation Indicator is an innovative tool developed by TintinTrading to help his students learn to interpret Price + Volume moves. It is designed to provide traders with a visual cue for price movement confirmation based on both price direction and trading volume. I got the idea from watching Daivd Ryan, how he explains that he looks at volume first before looking at the price of a stock.
🦄 –––UNIQUENESS–––
What sets this indicator apart is its dual analysis approach and easy interpretation: it not only evaluates price movements but also takes trading volume into account. The indicator's color-coded bars are dynamically adjusted based on the volume difference from a 50-day Simple Moving Average (SMA) of the volume. This offers traders an intuitive way to gauge both the market's direction and its strength.
🛠️ ––––WHAT IT DOES––––
The Price Confirmation Indicator performs the following functions:
👉Price Movement: Determines whether each trading day is an 'Up Day' or a 'Down Day' based on the closing price.
👉Volume Analysis: Calculates the 50-day SMA of trading volume and identifies the volume difference in percentage terms.
👉Transparency Adjustment: Dynamically adjusts the transparency of colored bars based on the volume difference.
👉Bar Coloring: Colors the bars blue for 'Up Days' and purple for 'Down Days', with the transparency indicating the strength of the volume.
Transparency Tresholds:
Full color (no transparency 0%) - Volume is greater than 40% compared to the 50DSMA Volume
Strong color (little transparency 20%) - Volume is between 20% and 40% greater than the 50DSMA Volume
Noticable color (moderate transparency 40%) - Volume is between 0% and 20% greater than the 50DSMA Volume
Negligable color (strong transparency 60%) - Volume is light and is less than 50DSMA Volume with less than 20% lower.
Weak color (very strong transparency 80%) - Volume is below 50DSMA, with between 40% and 20% lower.
Very weak color (max transparency 90%) - Volume is below 50DSMA, with between -40% and -80% lower.
Alarming weak color (color is orange) - Volume is noticably light - this generally signals velocity contraction before a breakout.
💡 ––––HOW TO USE IT––––
Installation: Search for " Price Confirmation Indicator" in TradingView’s indicator library and add it to your chart.
Settings:
Price Up Color: Customize the color for 'Up Days'.
Price Down Color: Customize the color for 'Down Days'.
Interpretation:
Blue bars signify 'Up Days', and their transparency indicates the strength of the volume.
Purple bars represent 'Down Days', with transparency again indicating volume strength.
Orange bars signify extremely low volume days.
Volume Transparency: The less transparent the bar, the stronger the volume, aiding in confirming the price direction.
The indicator is a great tool for newer traders to get in the habit of reading Price & Volume together!

Daily Network Value to Transactions Signal (NVTS)
Quote of GlassNode ...
The NVT Signal (NVTS) is a modified version of the original NVT Ratio.
It uses a 90 day moving average of the daily transaction volume in the denominator instead of the raw daily transaction volume.
This moving average improves the ratio to better function as a leading indicator.
The Network Value to Transactions (NVT) Ratio is calculated by dividing the market cap by the transferred on-chain volume measured in USD.
GlassNode says the NVT Ratio was created by Willy Woo.
I have peaked into Glassnode and took their idea.
I also added a few more Moving Averages to select from, and the length can also be changed.
This script does not depend on Glassnode alone, instead I pulls data of several services...
CoinMarketCap
CoinMetrics
GlassNode
IntoTheBlock
Therefor we have more Tokens to select from.
I have also blocked some faulty data of each service.
If you get a study error of any kind then there is no data available,
or you on a wrong timeframe.
Best to use this script in a daily chart.
And keep in mind it pulls data of yesterday.
Therefor the plot is offset by 1 to the left.
The script will check each service if the data for the chart is available.
Market Cap is taken in the following order ...
CainMarketCap
GlassNode
CoinMetrics
Transaction volume as USD is taken in the following order ...
IntoTheBlock
CoinMetrics
GlassNode
Happy Trading!

Price by Volume ColumnsThis indicator allows you to identify how price changes for a given time period are sensitive to the volume. You will identify these changes as bars in the bottom of the chart. You may see the changes in bars for better understanding of price movements, identify trends. Please take trades at your own risk and discretion

ProfitAlgoOverview
ProfitAlgo is a powerful and intuitive trading tool specifically developed to cater to the requirements of both beginners and experienced traders. It is designed to function in every timeframe and on all cryptocurrencies, stocks, indices, forex, futures, currencies, ETF's, energy and commodities. This innovative tool provides real-time signals, comprehensive trend analysis, and advanced risk management features, making it an indispensable asset for traders of all levels. This cutting-edge tool generates 'BUY' and 'SELL' signals, complemented by an array of robust analytical tools. Empower your trading analysis with this all-in-one solution and add to your arsenal of indicators to make well-informed decisions.
This algorithm incorporates a sophisticated Fourier smoothing technique to effectively filter price data, reduce noise and reveal underlying patterns and trends. By utilizing multiple price series data and incorporating Price Volume Trend, it leverages volume analysis and price movement patterns. Furthermore, the algorithm employs relative and simple moving average calculations to enhance signal clarity and filter out outliers, resulting in a more refined and robust indicator.
Features
Buy/Sell signals: Visually illustrated by 'BUY' and 'SELL' labels, these signals provide indications to traders about optimal times to enter or exit positions in the market based on the particular asset they are trading. Traders may want to enter long positions when buy signals appear, and enter short positions when 'SELL' signals appear.
Stop Loss/Take Profit Levels: Stop loss and take profit levels are predefined price thresholds that allow traders to automatically exit trades to limit losses or secure profits, respectively. Stop loss and take profit levels are visually depicted through three dotted lines on the trading chart, including the entry price, take profit (TP), and stop loss (SL). Additionally, a table displays the corresponding price entries for all three levels, providing a comprehensive overview of the trade. Traders can effectively manage their risk and optimize their trading by implementing predefined threshold settings and establishing take profit levels, thus safeguarding their profits using a strategic approach.
Support and Resistance Levels: Support and resistance levels are key price levels in the market that act as barriers or turning points for the price movement of an asset. Traders utilize these levels to identify potential areas of buying and selling opportunities. These can be depicted as red (resistance) and green (support) horizontal lines. These levels can serve as valuable complements to stop/loss and take profit levels, providing confirmation for profit-taking opportunities and facilitating effective risk management. Moreover, they can synergistically work alongside the price lines to identify potential reversal zones by visualizing market highs/lows in conjunction with areas of supply & demand.
Moving Average Bands: Moving average bands, plotted alongside the price data, dynamically change color based on the prevailing trend, with red indicating a downtrend and green representing an uptrend. This visual tool provides valuable insights to users, allowing them to quickly identify and interpret market trends. Integrating Moving Average bands with our buy/sell signals offers added confidence in identifying market trends, enabling traders to seek validation and enhance their decision-making process.
Trend Table: The trend table provides real-time information on the current trend of an asset, displaying three distinct outputs: "Uptrend," "Downtrend," and "Ranging Trend." This valuable tool enables users to assess the live trend of an asset, which may differ from the buy/sell signals. The primary objective of this feature is to analyze real-time trends in both ranging and trending market conditions. While the current signal may indicate a 'BUY' signal, the table can present an alternative output, providing valuable insights for traders and investors.
Price Lines: Price lines are depicted as two parallel grey lines running alongside the price data, representing the highs and lows of the market. This visual tool is utilized to identify patterns of higher highs and lower lows, enabling traders to gain insights into the overall trend and potential reversals in the market. When used in conjunction with our signals, MA bands and trend table, it may reinforce your interpretation of the underlying trend as well as provide insights into the trend strength.
*Note: These features are customizable via the settings menu in TradingView.
Calculations
How are buy/sell signals calculated?
The buy and sell signals are generated through a comprehensive calculation process that encompasses various types of analysis techniques. With permission from the author, wbburgin's Fourier transform is utilized to filter and extract relevant information from the price data, removing noise from the signals (filter is only applied in this feature). The buy and sell conditions are calculated based on a combination of volume-based analysis, and price movement patterns, employed to assess the direction and strength of market trends. The combination aims to produce a comprehensive view of both volume-based and price-based market dynamics. By integrating these analysis techniques, traders can gain insights into the relationship between volume, price, and market trends. This combined approach, as well as Fourier smoothing, can help identify potential market reversals, confirm trend strength, produce less noisy data and provide additional confirmation signals for trading decisions. By considering the insights provided by this analysis, the algorithm determines the appropriate actions, signaling the opportunities to enter or exit positions in the market. In summary, these calculations aim to identify favorable trading opportunities by considering factors such as trend strength, volume dynamics, and price patterns, ultimately assisting traders in making well-informed decisions in the market.
How are stop/loss and take/profit levels calculated?
The stop loss and take profit levels are calculated using a combination of technical factors, including the Average True Range (ATR) and Exponential Moving Average (EMA). The rationale for this combination is to enable dynamic risk management and align profit targets with the prevailing market conditions; ATR provides a measure of volatility and risk, while EMA helps identify the underlying trend, allowing for effective stop-loss and take-profit placement. These indicators are utilized to gauge market volatility and determine suitable levels for managing risk and securing potential profits. By incorporating ATR and EMA calculations, the algorithm generates dynamic stop loss and take profit levels that adapt to market conditions.
Calculating support and resistance levels
These levels help identify areas where the price tends to find support (support levels) or encounter resistance (resistance levels). This script utilizes pivot point calculations to determine these significant price levels, which can assist traders in trading decisions regarding potential price reversals, trend continuations, and entry/exit points in their strategies.
What are the moving average bands based on?
The moving average bands, based on VWMA (Volume Weighted Moving Average) calculations using OHLC4 price data, are visualized as unique bands on the chart. VWMA bands are chosen to find trends because they effectively combine volume-weighted calculations with moving averages, providing valuable insights into the strength and direction of price movements. These bands dynamically change color to reflect the prevailing trend. In an uptrend, the bands are represented by a green color, while in a downtrend, they appear in red. The VWMA bands utilize a unique counting method to capture trend movements and potential reversals.
How is the Trend Table calculated?
The underlying trends in the trend table are calculated based on counting methods applied to the VWMA bands. It utilizes specific thresholds to determine different trends, such as "Up Trend," "Down Trend," and "Ranging Trend." These thresholds are used to assess the current trend of the asset and provide valuable insights for traders.
Price Lines Calculation
The price lines are calculated based on the price data. They represent the range of prices, with one line plotted above the closing price and another line plotted below it. The space between these lines is filled to visualize the price volatility. Traders can utilize these lines to identify significant price levels and observe the overall price movement.
Disclaimer:
The information provided in my indicators/strategies/systems is not intended as financial advice. I assume no responsibility for any losses or damages, including loss of profits, resulting from the use of or reliance on such information.
All investments carry risks, and past performance of a security, industry, sector, market, financial product, trading strategy, backtest, or individual's trading does not guarantee future results or returns. Investors bear full responsibility for their investment decisions, which should be based on their own evaluation of financial circumstances, investment objectives, risk tolerance, and liquidity requirements.
Please note that my indicators/strategies/systems are solely for educational purposes! DO NOT request access in the comment's section.

Volume Change Indicator 0.1 [PATREND]
(Volume Change Indicator)
It is an analytical tool that studies the trading volume and its changes.
This indicator uses the Simple Moving Average (SMA) to calculate the average volume for a specific period of time.
Only candles that meet the required conditions are determined when the trading volume is greater than or equal to the calculated average.
This means that the indicator identifies a volume candle only when there is a significant change in trading volume compared to the average.
This indicator is distinguished from other similar indicators in that it allows the user to determine the required percentage of change as an additional condition for determining the volume candle.
If the conditions are correct, the indicator will display a diamond below the candle that meets the requirements specified by the user.
The indicator also displays lines above and below the candle and places "A" and "B" marks next to them to determine the start and end points.
__________________________________
(Volume Change Indicator)
It is a useful analytical tool for traders who rely on volume analysis strategies in their trading decisions.
This indicator helps traders identify important volume candles and search for trading opportunities more accurately.
Traders can use this indicator to determine trends and search for potential entry and exit points.
The indicator helps determine when there is a significant change in trading volume compared to the average, indicating a possible change in direction.
In general
This indicator benefits traders who use volume analysis strategies in their trading decisions and who want additional information about trading volume and its changes.
It can also be used for all markets and on different time frames.
_________________________________
Settings:
1. The user is allowed to determine whether they want to display the indicator through the "Show Indicator" box.
2. The user is allowed to determine the required percentage of change through the "Percent Change" box.
3. The user is allowed to determine the type of candles they want to display (Bearish, Bullish, both) through the "Candle Type" box.
4. The user is allowed to calculate the average candle volume using the "Average Vol" box.
5. The user is allowed to determine the length of lines and number of lines they want to display through "Max Lines" and "Line Length" boxes.
_________________________________
We hope you find (Volume Change Indicator) useful in your analysis.
Feel free to try this indicator and customize its settings to meet your trading needs.
We look forward to seeing your opinions and comments on this indicator.
______________________________________________________________________________________________________
(Volume Change Indicator)
هو أداة تحليلية تعمل على دراسة حجم التداول وتغيراته.
يستخدم هذا المؤشر متوسط الحجم المتحرك (SMA) لحساب متوسط الحجم لفترة زمنية معينة.
يتم تحديد الشموع التي تلبي الشروط المطلوبة فقط عندما يكون حجم التداول أكبر من أو يساوي المتوسط المحسوب.
هذا يعني أن المؤشر يحدد شمعة الكميات فقط عندما يكون هناك تغير كبير في حجم التداول مقارنة بالمتوسط.
يتميز هذا المؤشر عن غيره من موشرات الممثاله بأنه يتيح للمستخدم تحديد النسبة المئوية المطلوبة للتغيير كشرط إضافي لتحديد شمعة الكميات.
إذا كانت الظروف صحيحة، فسيعرض المؤشر ماسًا أسفل الشمعة التي تلبي المتطلبات المحددة من قبل المستخدم.
كما يعرض المؤشر خطوطًا فوق وتحت الشمعة ويضع علامتي "A" و "B" بجانبهما لتحديد نقاط البداية والنهاية.
________________________________________
(Volume Change Indicator)
هو أداة تحليلية مفيدة للمتداولين الذين يعتمدون على استراتيجيات تحليل الحجم في قراراتهم التداولية.
يساعد هذا المؤشر المتداولين على تحديد شموع الكميات المهمة والبحث عن فرص تداولية بشكل أكثر دقة.
يمكن للمتداولين استخدام هذا المؤشر لتحديد الاتجاهات والبحث عن نقاط الإدخال والخروج المحتملة.
يساعد المؤشر على تحديد متى يكون هناك تغير كبير في حجم التداول مقارنة بالمتوسط، مما يشير إلى احتمالية حدوث تغير في الاتجاه.
In general
يستفيد من هذا المؤشر المتداولون الذين يستخدمون استراتيجيات تحليل الحجم في قراراتهم التداولية والذين يرغبون في الحصول على معلومات إضافية حول حجم التداول وتغيراته.
كما يمكن استخدامة لجميع الاسواق وعلى مختلف الفواصل الزمنية .
_________________________________________
Settings:
1. يُتيح للمستخدم تحديد ما إذا كان يرغب في عرض المؤشر من خلال خانة "Show Indicator".
2. يُتيح للمستخدم تحديد النسبة المئوية المطلوبة للتغير من خلال خانة "Percent Change".
3. يُتيح للمستخدم تحديد نوع الشموع التي يرغب في عرضها (Bearish, Bullish, both) من خلال خانة "Candle Type".
4. يُتيح للمستخدم حساب متوسط حجم الشموع باستخدام خانة "Average Vol".
5. يُتيح للمستخدم تحديد طول الخطوط وعدد الخطوط التي يرغب في عرضها من خلال خانات "Max Lines" و "Line Length".
_________________________________________
نأمل أن تجدواه مفيدًا في تحليلاتكم .
لا تترددوا في تجربة هذا المؤشر وتخصيص إعداداته لتلبية احتياجاتكم التداولية.
نتطلع إلى رؤية آرائكم وتعليقاتكم حول هذا المؤشر.

Ultimate Volume Custom ScreenerThis indicator will allow you to make your custom volume TradingView screener without coding. Add it to the chart, and select up to 40 symbols and up to five indicators. The screener will do the rest for you. The indicator will form a lovely table with all values and highlighted signals. It allows also to filter symbols based on the values of indicators and sends results as an alert.
The screener is highly customizable, and you can choose its position on the chart, sorting, order of the columns, colors for the tables, and all signals separately. You can easily change parameters for all supported indicators.
Supported indicators
Currently, there are 15 different custom indicators available. Current list of indicators:
Accumulation/Distribution (Acm/Dst)
Chaikin Money Flow (CMF)
Ease of Movement (EOM)
Klinger Oscillator (KO)
Money Flow Index (MFI)
Negative Volume Index (NVI)
On Balance Volume (OBV)
Positive Volume Index (PVI)
Price
Price-Volume Trend (PVT)
Volume
Volume MA (VMA)
Volume Percentile (V-Prct)
Volume RSI (V-RSI)
Volume Weighted Average Price (VWAP)
We're already working on adding a few more supported indicators. If you have any ideas about the indicators you want to see in our screener, contact us, and we'll consider them.
Filters
You can combine up to 5 filters on all selected indicators.
This will split the screen table into two parts. The top one will contain symbols that satisfy all conditions:
Alerts
You can also create an alert and receive a filtered symbol at the end of every bar.
Disclaimer
Please remember that past performance may not be indicative of future results.
Due to various factors, including changing market conditions, the strategy may no longer perform as well as in historical backtesting.
This post and the script don’t provide any financial advice.

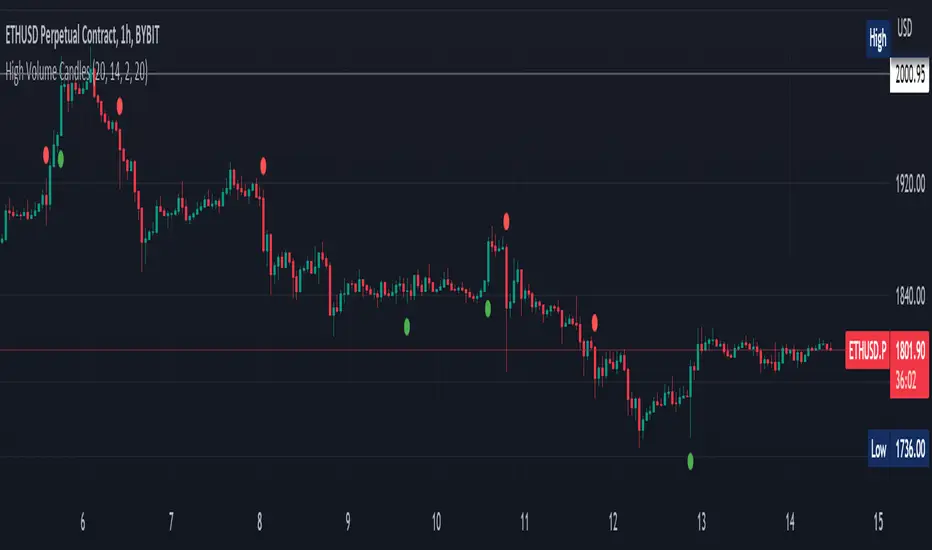
High Volume Candles Detector - Open Source CodeGreetings, fellow traders!
Throughout my trading career, I've been intrigued by the dynamic interplay between candlestick patterns and trading volume. This fascination led me to develop an open-source indicator to help illuminate these patterns for the broader trading community.
Upon researching the Public Library, I found that many indicators relating to candlestick/volume analysis are proprietary and not open-source. This discovery further fueled my commitment to contribute a free, accessible tool that traders of all levels can utilize in their technical analysis.
Thus, I am excited to present to you our High Volume Bars Indicator. A unique tool that I believe fills a gap in the Public Library. I truly hope you find it beneficial in your trading journey and that it empowers you to make more informed decisions.
Description:
The High Volume Bars Detector is designed to help traders identify bars with significantly higher volume than the average. Users can filter in the settings menu:
1) The length of the Simple Moving Average (SMA) for volume, allowing you to define the average volume over a specific number of bars.
2) The Volume Multiplier, a factor that determines how much greater the volume of a bar should be compared to the SMA to qualify as a high-volume bar.
3) The Lookback Period, a specified number of candles used as a comparative benchmark for identifying the highest volume.
4) If the Volume bar is green or red, so if the candle price is --> close > open or open > close
Examples to better understand the logic of the indicator:
1) Length of the Simple Moving Average (SMA) for Volume: This setting allows you to define the average volume over a specific number of bars. For instance, if you set the SMA length to 20, the indicator will calculate the average volume of the past 20 bars and use it as a baseline to identify high volume bars.
2) Volume Multiplier: This is a critical factor that determines the threshold for what constitutes a high-volume bar. If you set the volume multiplier to 2.0, for example, the indicator will flag any bar where the volume is twice the value of the SMA volume as a high-volume bar.
3) Lookback Period: This setting lets you specify the number of candles that the indicator should consider when determining the highest volume. For instance, if the lookback period is set to 14, the indicator will compare the volume of the current bar with the volumes of the previous 14 bars. If the current bar's volume is the highest, it will be flagged.
4) Volume Bar Color: This filter helps you identify whether a high-volume bar is bullish or bearish. If the bar is green (close > open), it suggests buyers were dominant during that period. If the bar is red (open > close), it suggests sellers had the upper hand. By setting this filter, you can choose to focus on high volume bars that are either bullish (green) or bearish (red) or both, depending on your trading strategy.
Remember, these filters offer a level of customization that allows you to tailor the High Volume Bars Detector to your unique trading style and requirements. Always remember to adapt these settings to align with your overall trading plan and risk tolerance.
Keep attention!
It is important to note that no trading indicator or strategy is foolproof, and there is always a risk of losses in trading. While this indicator may provide useful information for making conclusions, it should not be used as the sole basis for making trading decisions. Traders should always use proper risk management techniques and consider multiple factors when making trading decisions.
Support me:)
If you find this new indicator helpful in your trading analysis, I would greatly appreciate your support! Please consider giving it a like, leaving feedback, or sharing it with your trading network. Your engagement will not only help me improve this tool but will also help other traders discover it and benefit from its features. Thank you for your support!
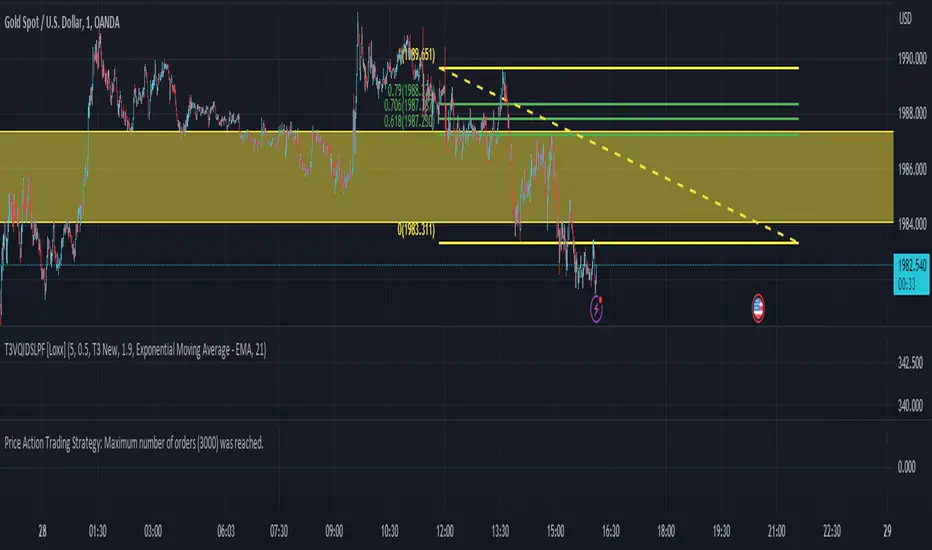
Price Action Trading StrategyIn this strategy, we define the high and low of the previous candle, and then check whether the current candle's high or low is higher or lower than the previous candle's high or low, respectively. If there's a new high, we enter a long position, and if there's a new low, we enter a short position. We also set exit conditions to close the position if the price drops below the previous low or rises above the previous high.
Please note that this is a simple example and should not be used as a standalone trading strategy. It is important to conduct thorough backtesting and consider other factors such as risk management before implementing any trading strategy.
Relative Price Volume
Relative Price Volume is an indicator which shows anomalies between price and volume on a chart over a given period. The goal is to identify potential reversal and/consolidation areas for price as it relates to volume. It is a simple variation of a Volume at Price indicators. It can also be used to mark potential support and resistance lines on the chart as the areas it signals is where the price battles are waged.
Settings:
Period = length for which to calculate average candle body and average volume
Long Factor = relative size multiplier to determine if a candle is larger than average or if volume is higher than average
Short Factor = relative size multiplier to determine if a candle is smaller than average or if volume is lower than average
Anomaly Conditions
1. If a candle is larger than average and volume is lower than average, then this is an anomaly, and we should be on alert for a change in momentum.
2. if a candle is smaller than average and volume is higher than average, then this too is an anomaly and should put us on alert.
The indicator will draw a cross on the chart indicating the candle is that is flashing the warning that the run is done and a potential consolidation and/or reversal is pending. Used in conjunction with support and resistance levels this could signal a time to enter or exit a trade.
The default size factors considers a candle or volume:
1. Larger than average if it is 60% or more (.6) larger than average.
2. Smaller than average if it is 40% or less (.4) smaller than average.
Hope this helps! Happy trading!
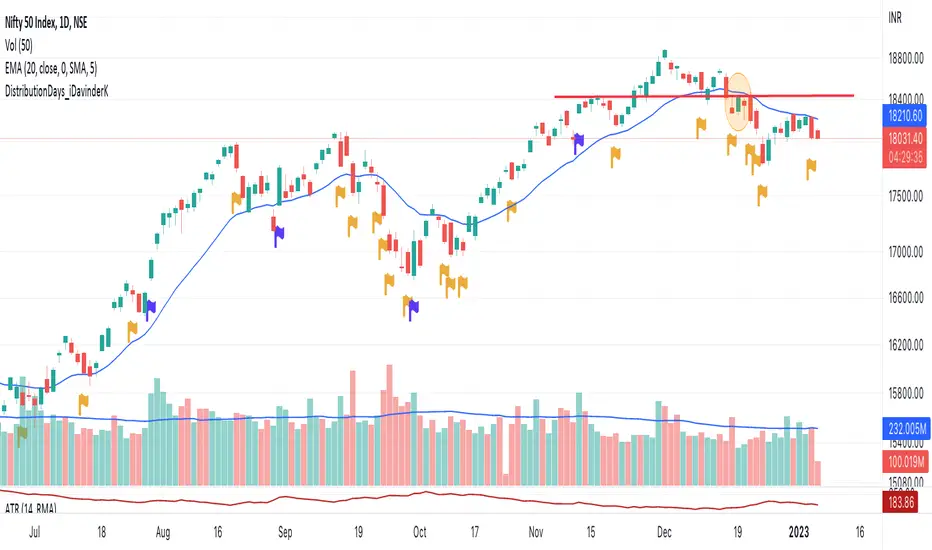
DistributionDays_FTD_iDavinderKThis script identifies the distribution days and follow through day.
DD count helps a trader identify a general trend of the market. A distribution day is flagged when index drops more than 0.2% and above average vols than previous day. 4 or more distribution days shows choppiness in the market and longs are unlikely to work.
A follow through day on the other hand shows strong buying emerges from the bottom. An FTD is flagged when index moves up 1.5% or more on higher vols than previous day.
Once an FTD is seen DD count goes back to zero.
DD are shown as Yellow flag here.
FTD are shown as Blue flag,
ICT - GAPs and Volume Imbalance
GAPs
Gaps are areas on chart where the price have moved sharply up or down, with no trading in between. Gaps often fill, but they don't have to.
Volume Imbalance
Volume imbalance - determined using 2 candles
Bullish Volume Imbalance - area between the close of 1st candle and the open of 2nd candle
Bearish Volume Imbalance - area between the close of 1st candle and the open of 2nd candle
How to use the indicator:-
When you find imbalance in volume or a GAP in the chart, you may expect price to rebalance it before continuation.
Importantly, GAPs/Imbalances do not always fill. Traders should never assume that a gap/imbalance will fill without understanding the reasons for the gap and monitoring trading activity around the gap.
Pair it with your current bias for better results.

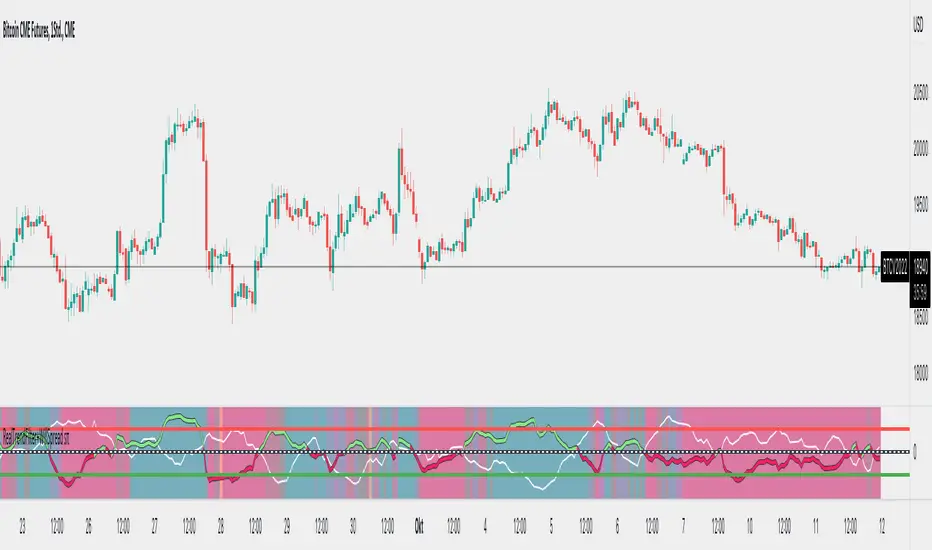
WillSpreadIntermarket + Williams Spread + POIV + ADVolumen sπThe Indicator is a combination of different types of measurements to the Price Action.
1.1 RSI Contra Input like Dollar Index (white Line)
1.2 RSI (colored line)
If you switch off 1.1. and 1.2. you can use the Willspread, POIV or AD Volume as a Indicator
2. The WillSpread is set to measure your Symbol to another chosen Market like Dollar as Contra . But you can switch also between different markets.
2. Accumulation/Distribution with True Range of High or Low including OpenInterest. This only works with Futures .
--Energies, Metals, Bonds, Softs, Currencies, Livestock, live cattle , feeder cattle, lean hogs , index--
Open Interest for:
ZW, ZC , ZS, ZM, ZL, ZO, ZR, CL , RB, HO, NG , GC , SI, HG, PA, PL, ZN, ZB, ZT, ZF, CC , CT , KC, SB , JO, LB , AUDUSD , GBPUSD , USDCAD , EURUSD , USDJPY , USDCHF , USDMXN , NZDUSD , USDRUB , DX , BTC , ETH, LE, GF , HE, NQ, NDX, ES, SPX , RTY, VIX ,
3. Accumulation/Distribution with True Range of High or Low including Volume .
4. The color shows if the Market has positive or negative (RSI, Willspread, Volume or Open Interest)
5. The Indicator also shows Divergences to Price and RSI or Willspread Movements.
If you want to have more information just give me a message.
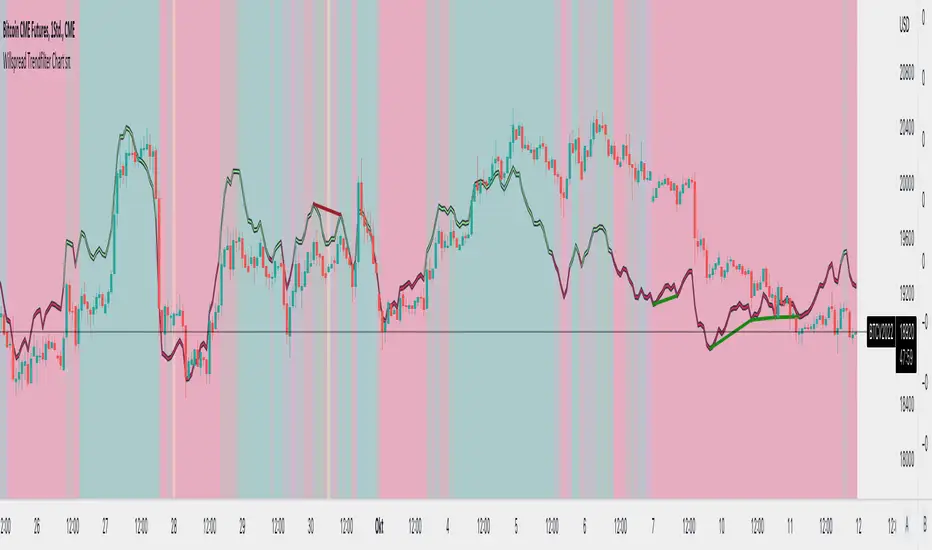
Willspread Chart + POIV & ADVolumen TrendColor sπThe Indicator is a combination of different types of measurements to the Price Action.
1. Spread: The Spread is set to measure your Symbol to another chosen Market like Dollar as Contra . But you can switch also between different markets.
2. Accumulation/Distribution with True Range of High or Low including OpenInterest. This only works with Futures .
--Energies, Metals, Bonds, Softs, Currencies, Livestock, live cattle , feeder cattle, lean hogs , index--
Open Interest for:
ZW, ZC, ZS, ZM, ZL, ZO, ZR, CL, RB, HO, NG, GC, SI, HG, PA, PL, ZN, ZB, ZT, ZF, CC, CT, KC, SB, JO, LB, AUDUSD, GBPUSD, USDCAD, EURUSD, USDJPY, USDCHF, USDMXN, NZDUSD, USDRUB, DX, BTC, ETH, LE, GF, HE, NQ, NDX, ES, SPX, RTY, VIX,
3. Accumulation/Distribution with True Range of High or Low including Volume .
4. The color shows if the Market has positive or negative (Willspread, Volume or Open Interest)
5. The Indicator also shows Divergences to Price and Willspread Movements.
If you want to have more information just give me a message.
Volume+Price Action Alert by Eciujust the update scipt with white text to the markers so it works with dark mode
