PROFIT MAKER |Crypto|ETH|BTC|YFIThis is a trend-following strategy that works very well for many Crypto assets in the usd or usdt pair
It can be used for both futures and spot!
Some of the assets in which this strategy is proven are
Asset Exchange TF
BINANCE:ADAUSDT Binance 45m
BINANCE:BTCUSDT Binance 1h
BINANCE:YFIUSDT Binance 30m
BINANCE:DOTUSDT Binance 45m
BINANCE:ETHUSDT Binance 30m
BINANCE:LINKUSDT Binance 45m
BINANCE:DOGEUSDT Binance 1h
And many others..
BINANCE:BTCUSDT
BINANCE:LINKUSDT
What is this strategy based on?
It is a combination of various parameters, including
-RSI: The relative strength index (RSI) is a momentum indicator used in technical analysis that measures
the magnitude of recent price changes to evaluate overbought or oversold conditions in the price of a stock or other asset.
-MACD: Moving average convergence divergence (MACD) is a trend-following momentum indicator that shows
the relationship between two moving averages of a security’s price.
-ADX: ADX is used to quantify trend strength. ADX calculations are based on a moving average of price range expansion over a given period of time.
-DMI: DMI is a moving average of range expansion over a given period (the default is 14 days). The positive directional
movement indicator (+DMI) measures how strongly price moves upward; the negative directional movement indicator (-DMI)
measures how strongly price moves downward. The two lines reflect the respective strength of the bulls versus the bears.
Included:
Different forms of Take profit, included:
Take profit on squeeze candles
Take profit based on Risk-Benefit (RR)
Take profit a pre-determined %.
Different forms of Stop Loss, including
ATR-based stop loss
Trail stop loss (with option to use a trigger)
Stop loss a pre-determined %.
**All trades include 0.1% of fees + slippage
** The statistics displayed are for the year 01-01-2020 and the period from 2021 to the date of publication (14-01-2020)
For access you can send a message or consult in my social networks.
Links in my tradingview signature (below).
Profit

Smoothed Trend Wave (Strategy)
This is a the Final version of Smooth Trend Wave
* Average Trend is show
* Calculation of different period of moving average
* Candlestick Pattern
* Background color is based on candle color.
Use Strategy Format to show back-test result. When I create this indicator is based on daily chart. (lower timeframe, result might be different)
7 type of strategy (can be select)
Strategy 1 & 2 : long/short according the trend
Strategy 3 & 4 : long/short according retracement in same trend
Strategy 5 & 6 : long/short bet for rebound
Strategy 7 : potential buying point (low chance happens)
Example of back-testing is use crypto between 1-1-2019 to 30-7-2020 (after JULY is a bullish momentum will causing *repaint" of strategy result)
* Strategy is set initial equity of 10000usd
* Each order is only 30% of equity, to make risk management
* Maximum 5 order is allow in strategy
Kindly PM or comment below if you have any question.

Scalping Strategy with SL and TP activation settingsThis strategy can be used on pretty much every timeframe that gives you a satisfying performance and will give you entries with a high probability of a winning trade.
Recommended are lower timeframes, because after all this is a scalping strategy and with that your chart wont be cluttered.
How to use this script?
Currently you can setup your positions SL and TP, because the markets vary in volatility it could improve the performance of the strategy.
You will simply get your signals and can decide to act upon them.
Stop loss: Simply your stop loss order which will trigger when price moves a given % away from your entry.
TP-Activation: When price reaches your % target it will trigger a stop limit order. So if price turns against your position after reaching your target it will close your position in profit and if it runs in your favoured direction it will trigger at a later stage.
Trailing-Offset-%: After reaching your % target it will trigger the TP order with an offset. So if you set your trailing offset to 0.1%, your TP order will be set behind 0.1 %. This can be used to test if the strategy would perform as well
if you leave more room for trades to play out.
Will this script make me profitable?
No strategy is a silver bullet and it depends mostly on you.
Trading is not easy and most people fail, because their risk management skills arent solid or they cant control their emotions.
This script will give you statistically often good entries, so even if you hit a losing streak your SL will protect you from losing more than necessary until you get a winning streak.
Patience and consistency is key to be profitable in the long run.
Does the script repaint?
Although you will get a notification when setting an alarm that the indicator may repaint, no security function is used and the signals will stay on the chart, because the signal is calculated based on the last candle close and will trigger with the next candle.
I am still looking into why that notification pops up.
You are free to try the indicator for a limited time to be sure.
My experience with the strategy
The overall statistical advantage is great. The strategy can be used simply as it is, but becomes better if you already have some experience with trading. Sometimes it will give you a good entry, reaches your target and the price still goes in your preferred direction. So your trading returns and experience could be improved with confluence, but it is totally fine as it is and if used right will help you get going.
Disclaimer: This is no financial advice. This is a tool and I am not responsible for your actions.
If you are interested in the indicator feel free to dm me on TradingView.

Indicator - ATR Profit Loss - DGHi Traders,
This is an on chart indicator that can be used for setting take profit and stop losses very easily using the Average True Range Indicator (ATR). Using a volatility adjusted TP and SL will allow you to set your targets and losses based on market conditions. In the settings, you are able to adjust how much of a multiplier you require depending on your risk tolerance and strategy. For those that follow the NNFX method, the defult settings are preset to 1xATR TP and 1.5xATR SL.
How to use:
- For longs, 'isLong' box must be ticked, for shorts, this box is unticked
- For longs, green line is TP, red line is SL
- For shorts, red line is TP, green line is SL
Regards,
Dillon Grech

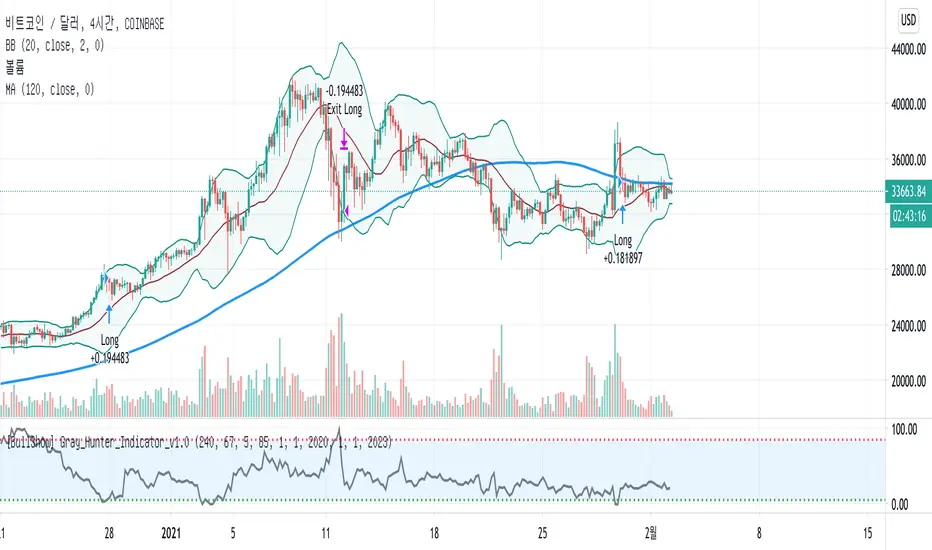
[BullShow] Gray_Hunter_Indicator_v1.0 - Legendary ProfitOver the past 10 years, the price of Bitcoin and cryptocurrency has been dominated by miners. However, since the coronavirus, as the money supply of each government increases and the value of the money decreases accordingly, institutional investors are increasingly intervening in the price of bitcoin. In particular, it is no exaggeration to say that the rise of Bitcoin in recent years was led by institutional investors.
Accordingly, in the past, the indicator of HashRate or Profitability of Mining was an important index for cryptocurrency investment, but now is the time to examine the investment movement of institutions.
This idea is an idea to follow the movement of institutional investors.
I created an index based on the correlation and disparity between the price of institutional investors and the price of bitcoin.
Accuracy increases after the corona, when institutional investors start buying in earnest.
There is no repainting on the chart.
If you are interested in my strategy, Use the link below to obtain access to this indicator or PM me to obtain access
Indicators are shared only with supporters.
Bless you and thanks all!
지난 10년동안 비트코인 및 암호화폐의 가격은 채굴자에 의해 좌지우지 되어 왔습니다. 그러나 코로나바이러스 이후 각 정부의 화폐 공급이 많아지고 그에 따라 화폐가치가 하락하면서 기관투자자의 개입이 조금씩 많아지고 있는 상황입니다. 특히 2020년 최근들어 비트코인의 상승은 기관투자자가 이끌었다고 해도 과언이 아닙니다.
이에따라 과거에는 HashRate 또는 Profitability of Mining의 지표가 암호화폐 투자에 있어서 큰 index였지만 이제는 기관의 투자동향을 보다 더 살펴야 할 때입니다.
그래서 오늘 소개 해 드리고 싶은 전략은 기관의 움직임을 추종하는 전략입니다.
기관투자자들의 매수가격과 비트코인가격의 상관관계 및 이격도를 가지고 지표를 만들었습니다.
기관 투자자들이 본격적으로 매수를 시작하는 코로나 이후 부터 정확도가 증가합니다.
차트에 리페인팅은 없습니다.
Indicator의 공유는 Supporter 분들에게만 해 드리고 있습니다.
축복합니다 언제나 승리하세요!
Indicator Information
* Indicator is only working on the time frame (not support D,W,M and Seconds)
* Initial indicator sets under 1 to buy, over 85 sell
* The accuracy and reliability of indicators rise sharply from 2020, From the point when institutional market intervention increases rapidly
* Other altcoins buy and sell at the same time frame as Bitcoin.
* 해당 인디케이터는 시간 범위에서만 작동합니다 (D, W, M 및 초는 지원하지 않음).
* 초기 지표셋팅은 1아래에서 매수, 85 이상에서 매도
* 지표의 정확성과 신뢰성은 기관의 시장 개입이 급격히 증가하는 2020 년부터 급격히 증가합니다.
* 다른 알트 코인은 비트 코인과 동시에 매매합니다.
Back Testing
Back testing start from 2020. 01 . 01
Initial_capital: 1000
percent_of_equity: 100%
Commission: 0.2%
Profit
BTCUSDT: 559.12%
ETHUSDT: 1675.08%
XRPUSDT: 1121.74%
XLMUSDT: 1003.23%
LINKUSDT: 2087.28%
LTCUSDT: 781.35%
BCHUSDT: 310.89%
BNBUSDT: 706.14%
XMRUSDT: 667.08%
DASHUSDT: 570.35%
TRXUSDT: 796.54%
ADAUSDT: 1352.74%
CIVICUSDT: 3259.17%
IOTAUSDT: 935.22%
WAVESUSDT: 4187.95%
MACD Strategy KMACK Rev 1.1Hull smoothed 45/10 macd
Please note that the macd/rsi values do not print unless the current day is Monday-Friday and the market will be open.
14 period hull smoothed rsi marks the rsi value at each macd reversal and will not signal a long position above 70 or a short position below 30
Macd and rsi will only display on the current day and will only display the last 2 hours
Lit candles occur after 0920 nyse time
Alerts or entries will only fire after 0931 nyse time
Entry signal will confirm with the 5 minute candle.
Long entry requires the current 5 minute candle to close>=hlc3
Short entry requires the current 5 minute candle to close<=hlc3
Buy/sell alerts will only fire in the last 10 seconds of the realtime (current) bar
Options:
Select bias
Modify macd lookback period(s)
Alerts:
Buy
Sell
Rsi crossing into the power region (60)
Rsi crossing into the weakness region (40)
Current strategy exits position upon signal opposite to selected bias, this is for simplicity.
There are currently no add-on strat signals but the alerts/lit candles will fire
Successful trades average >55% with an average profit factor of 3%
Net profit averages 3%
Max drawdown averages below 0.25%
Added order size input
Added show/hide strat signals. Still lights the bars green/red. Make sure your bar color setting in tv is set to a transparent color so you can see the bright reds and greens.
Added a couple lines of code that fire the alert/strat if macd reverses and the corresponding 5min candle does not agree and the following candle does agree. Added an average of 1.5% winning trades.
Message me for free trial access
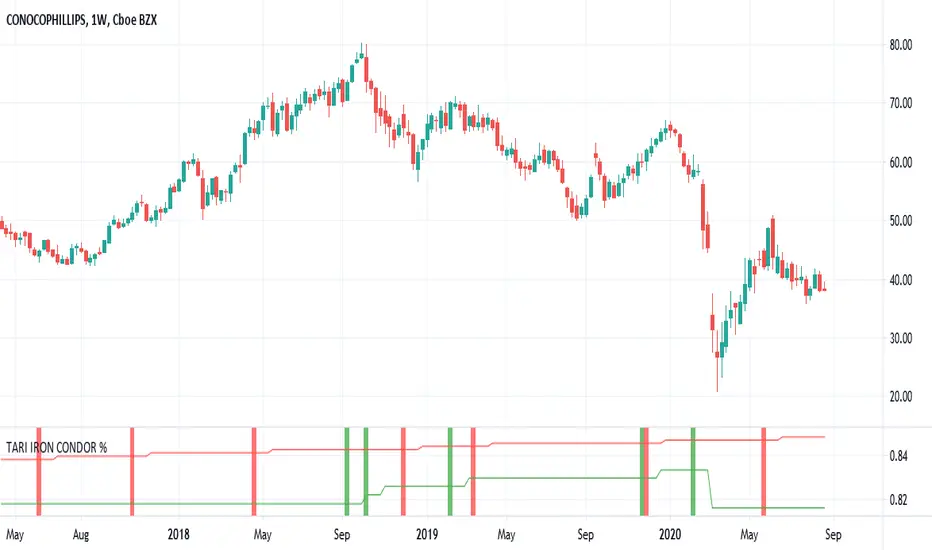
TARI IRON CONDOR %Hi guys!
I give here some details about my new script.
It's a script to find the best opportunity to trade options, sotcks, etf, index, an ocean of securities!
It works it's best on Weekly time frame, and that's how I use it.
There are only 2 settings to do before to dive into the market:
Period: it means how many candles you want to trade before expiration.
Strike: it's where to sell the put and the call, as % of actual price.
It's easier to get it reading about my routine:
Monday morning I open the Weekly chart, I set "period" to match it with next expiring day (if next regular expires in 2 weeks I set period=2, if I prefer to trade a weekly option I can set "period=1"), and I set a Strike. "Strike" 10% means that the short legs must be placed +/-10% from Monday opening price ( we call this price just opening price). If Monday open is 100$ (opening price is 100), and I choose 7%Strike, the short put must be placed @ 93$, the short call @107$.
On the script you can find a green or a red histogram, when it appears it means that there is a good edge to trade iron condor.
On the right side of the indicator you will see the success rate for green and red signal. You can play with Strike to find the better odds, for exemple: XYZ with 10% strike gives 88% success ( so reward / risk ratio is (100-88)/88=12/88= 0.14), and all the trades that gives you by your broker platform a succes rate lower than 88% (that means RR higer than 0.14), is good for us!
So basically we know for each strike and each expiring date, on a given security, our odds by TARI CONDOR, we know our Reward / Risk ratio, and when the market pays more than what we see by the strategy, we have an edge.
If I find a good opportunity I jump on my broker platform and place an order. It's not always possible to find a decent RR, in thoese cases I place a pending order, so maybe after a few days it can be executed as the price moves closer to the wings. But we trade only if we have a real edge! I trade about 10 iron condors in a week.
Once the order has been executed it's time to manage the position, the rules are the basic rules for iron condor: if one candle cloes at the end of the week over one long strike we roll ( up the puts and down the calls) the side that is still in profit, until around the opening price, to collet more credit, raising our RR. If one spread is deep ITM we can close that side, lowering our max loss.
That's it. I will publish my trades over the next days, to better understand the power of this script.
By TARI CONDOR we can trade almost everityhing with options, having a good edge on our side, plus all the benefit in trading options instead trading stocks or etf (levarage is the most important).
Subscribe and Enjoy your wallet!
Tari
Profit Accumulator Relative VolatilityRelative Volatility Indicator
This is a support indicator to the Main Indicator which has also been published.
This indicator uses volatility to determine if the market is quiet, or trading sideways or if there is money in the market and the opportunity for a long or short signal. There is an adjustable bottom line (in this case 0.15) and anything near or below that would indicate that no trades should be taking place. Similarly, if the trend line is declining, this is another indication that any trades should not be taken.
The trend line as an adjustable maximum setting of 0.5 and an increasing trend line is indicative of volatility in the market and a long or short position should be considered. This indicator should be used with the other suite of indicators to provide confluence of the trade.
Whilst an actual alert function is not set for the indicator, the TradingView alert function can be used to trigger a message when the line crosses above 0.15.
I've been using this successfully on the one hour FX charts, but seems to work equally as well on higher or lower time frames (not less than 15min).
The other indicators which are part of the suite are shown on the website which is highlighted in my signature at the bottom of the page. Purchase of the main indicator gives access to the full suite of eight indicators. I use the other indicators to confirm the direction of the trade and to determine if I want to trade or not. I use it along with the 2min, 15min and 4hr timeframes to identify the best entry window and how long I'm likely to be in the trade.
Support can be provided via private message or in the comments below.
The links are provided below for access to the indicator.
ATR with Take and StopThis simple indicator will plot the take profit and stop loss values based on the ATR indicator.
It's possible to set how many times the ATR value will be applied to the closing price and
what trade type is used, Long or Short.

PS ATR VariantProfit Sniper ATR Variant v0.1 is completely new but based off of the Profit Sniper 3.0 you know and love :
The original SNIPER operates off two timeframes in parallel, your Trend Timeframe (Higher Timeframe concerned with identifying market up & down trends), and your Trade Timeframe (Lower Timeframe to actually trade Longs & Shorts in).
Within each timeframe, you can tailor your preference for waiting for either Stochastic Ribbon cross only, or Ribbon Cross followed by Chande Confirmation for that additional market structure confidence. Flags & Alerts will then provide you with numerous trading Long & Short trading opportunities per day.
You also have the option to trade with trend so the indicator will automatically flag & alert only Shorts in a Short trend, and Longs in a Long Trend.
This version has the ATR (Average True Range) Indicator incorporated, to give trend direction (only tke longs in long trend and vice versa) and some additional safety features using ATR values.
For access please send a DM
With some extra features. such as ATR ( Average True Range ) trade entry which measures market volatility by analysing the range of asset price during a specified period.

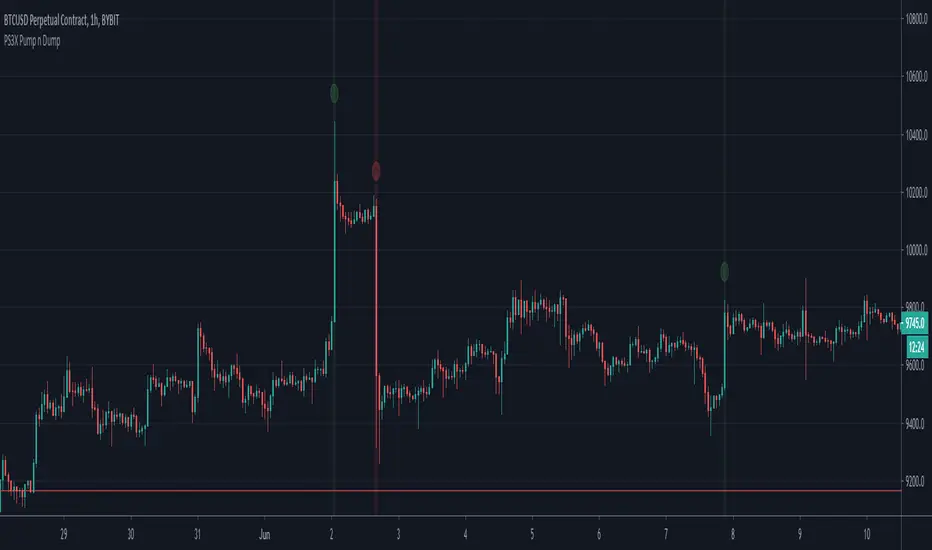
PS3X Pump n DumpA simple strategy that signals when price moves X amount over Y number of candles. Useful for identifying when to pause trading after a large move up or down
For access please send a DM
Swing Low Sweet ChariotI've been using this indicator now for the past few months and seen some very large profits as a result of it.
I've been using this successfully on the one hour FX charts, but seems to work equally as well on higher or lower time frames (not less than 30min).
I've added in some support and resistance functionality and plenty of settings to play with to fine tune to your strategy.
One of the main reasons that I've added in some support and resistance is that there are some times when an indicator is triggered very close to a S&R point then I may not take the trade.
Additionally to the indicator, I'll use trend lines, ADX and RSI to confirm the trend.
Alerts are set up for Long Entry, Short Entry, Long Exit and Short Exit.
Not that the exit points are approximate and won't hit the peaks, however they will prevent price retracement.
Offering 5-day free use of the indicator and then after that it will be £100/yr if you like the indicator. This will also cover all future updates.
Happy to answer any questions or send over other screenshots of currency pairs. Also happy to work with any other users if they have any ideas for improving (i.e. automated trend lines).
Cheers
Mike

TSI CCI Hull with profit$$$This is a modified version of @SeaSide420 TSI CCI Hull with profits exit on long and short order
ORIGINAL SCRIPT:
/// /// feel free to edit/improve and comment

Swing trading StrategyThis indicator based on capturing historical swing. It predicts future swing based on historical swing data. This is very useful for short term swing trading and gives best result on 30 minute chart.

PS3X Strategy TesterPS3X Strategy Tester is a completely new strategy built from the ground up as a successor to previous 1.0 and 2.0 versions of Profit Sniper.
Offering up huge improvements, including multiple position triggers, derived from Bollinger Bands and Chande Momentum as well as our own bespoke stochastic ribbons that provide trend pivots.
So how does it work?
PS3X Strategy Tester allows you to tailor your preference for waiting for either Stochastic Ribbon cross only, Ribbon Cross followed by Chande Confirmation, or Ribbon Cross followed by rising/falling MACD for additional market structure confidence.
Strategy exits can be configured to exit on % change of MACD histogram indicating a direction change, and additionally using our revolutionary "Profit Lockin" to provide a stepped lock in of profits according to your preferred risk strategy. Commision of 0.05% has been added to represent "limit in-market out" trading, but please tailor this again to your preferred trading approach.
If you would like access, please send me a PM.

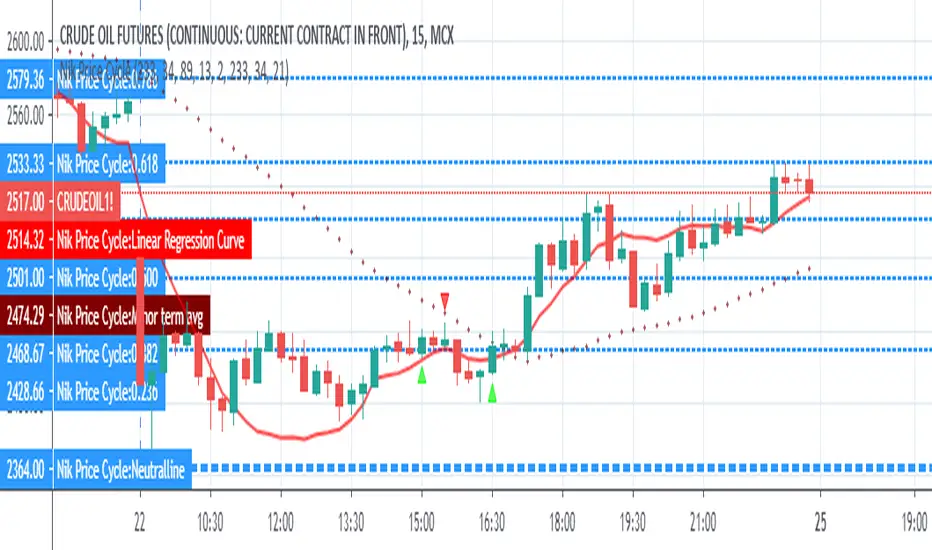
Nikesh Price CycleEvery Script has a pattern and it follows a cyclic movement which results into many small and big swings. We have tried to capture these cyclic pattern. Division line acts here as a pivot point which defines a holistic view of bulls and bear power. Price moving above division line indicates bullish trend and price moving below division line indicates bearish trend. Price scale bar defines trend momentum. when price crosses price scale bar with green scale bar colour it shows we should enter. we will keep on booking our profit on near next fib level. we will exit the trend once price candle crosses linear regression line. for safe entry in case of bulls entry-- price scale bar,linear regression line and mid avg term line should be below price candle. In case of bears entry--price scale bar,linear regression line and mid avg term line should be above price candle.

Nik Price CycleEvery script follow a pattern in their price cycle. This can be defined by division of price cycle. Division line will act as pivot point.Above this bar this any price movement is indication of bullish trend while below this line any price movement is indication of bearish trend. This Nik price signal will give great result in combination of magicsignal which is also one of our developed signal. Although we have included various calculation for analysis purpose in this indicator. i suggest to go in setting and uncheck all channel lines and shapes for getting clear picture of trend and entry point. for more details on how to use this indicator people can message us
PS3X MACD CompanionPS3X MACD Companion to be used as a visual tool alongside "Profit Sniper 3.0" Strategy, MACD Companion uses the standard MACD with signals for Histo cross & Histo change in % or absolute value to indicate trend changes.
If you would like access, please send me a PM.

[Daveatt] BEST Trade Manager Pivots 1.0Hello BEST traders
The BEST Trade Manager got upgraded with many more features
This version allows setting automatically the TP levels on either Fibonacci/Traditional/Camarilla/Woodie pivots
I. 💎 SCRIPTS ACCESS 💎
1. Available only with one-time payment on my website.
2. My website URL is in this script signature at the very bottom (you'll have to scroll down a bit and going past the long description) and in my profile status available here: Daveatt
3. Many video tutorials explaining clearly how all our indicators work are available on your website > guides section.
4. You may also contact me directly for more information
II. 🔎 What is the BEST Trade Manager?🔎
2.1 Concept
The BEST Trade Manager is compatible with any indicator.
Once connected, it adds another layer of good stuff with real-time user custom defined stop loss (8 available options), take profits (4 possible options) + alerts compatible for trading automation.
2.2 How hard is it to update your indicator?
We'll send to our customers, a comprehensive and easy tutorial, to make any indicator compatible.
I guarantee you, it should take no more than 2 minutes per indicator. We made it easy, fun, and awesome. #bolder #statement
III. The amazing benefits of our Plug&Play system
I hope you're ready to be impressed. Because, what I'm about to introduce, is my best-seller feature - and available across many of my indicators.
The BEST Trade manager can be connected to any external indicator
Let's assume you want to connect your RSI divergence to your Trade Manager.
I mentioned an RSI divergence but you may connect any oscillator ( MACD, On balance volume, stochastic RSI, True Strenght index, and many more..) or non-oscillator (divergence, trendline break, higher highs/lower lows, candlesticks pattern, price action, harmonic patterns, ...) indicators.
THE SKY IS (or more likely your imagination) is the limit :)
We go in-depth on our website why the Plug&Play is an untapped opportunity for many traders out there - URL available on my profile status and signature
IV. 🧰 Features 🧰
Candles can be colored to highlight the trend direction better [/b [
4.1 Stop-Loss Management
For what's following, let's assume that 2 is the stop-loss value you inserted in the indicator, and the Algorithm Builder gives a BUY signal.
This is NOT a recommendation at all, only an example to explain how this feature works.
- %Trailing: The Stop-Loss starts 2% away from the entry price - and will move up (because we're on a BUY trade as per our example) every time your trade will gain 2% profit
- Pips Trailing: Same as above but using a distance in pips/USD value
- Percentage: The Stop-Loss stays static 2% away from the entry price. There is no trailing here
- TP Trailing: Trail your stop-loss every time a Take Profit level is hit
- Supertrend: embedded supertrend use as a trailing stop
- Fixed: Set the Stop-Loss at a fixed position (value should be in currency/units)
- ATR multiple: Set the Stop-loss at a multiple of ATR
- External connector: Let's say your indicator already contains embedded stop-loss levels, you can add them in the Trade Manager
4.2 Take Profits Management
You can manage up to 3 take profit levels defined as a percentage or price value or ATR multiple.
The expected input is in percentage value (for instance, setting the % target of TP1 to 2% will set the TP1 level 2% away from the entry price
This version allows setting automatically the TP levels on either Fibonacci/Traditional/Camarilla/Woodie pivots
4.3 Built-in Risk-to-Reward Panel with real-time analytics
The good stuff doesn't stop here.
You'll notice that this sometimes green (when in a LONG), sometimes red (when in a SHORT) panel at the right of your chart.
- Entry Price: the price when the Algorithm Builder will give a signal.
- The Trade PnL in percentage.
- Entry Stop Loss: Distance (in currency/units) between the selected stop-loss algorithm (percent, trailing, TP trailing, etc.) and the entry price.
- Entry TP1/TP2/TP3: Distance (in currency/units) between the entry price and the first take profit
- Risk/Reward TP1/TP2/TP3: Using the Stop-loss distance at entry, and Take Profit 1/2/3 at the entry to compute the risk-to-reward ratio.
- Max drawdown and Max opportunity (value and percentage): respectively the maximum loss and maximum win per trade
For more details, please check the guides section of my website. Links are in my signature and profile status.
V. 🔔 Alerts 🔔
We enabled the alerts on the:
1. Stop-Loss hit
2. Take Profit 1/2/3 hit
3. custom hard exits based on either MACD / RSI divergence/ MM cross
5.1 🤖 Compatible with trading bots? 🤖
It's compatible with all third-parties out there capturing alerts and forwarding them to the brokers.
We enabled TradingConnector and ProfitView alert templates so far.
If you have any doubts or questions, please hit me up directly or ask in the comments section of this script.
BEST regards,
Dave

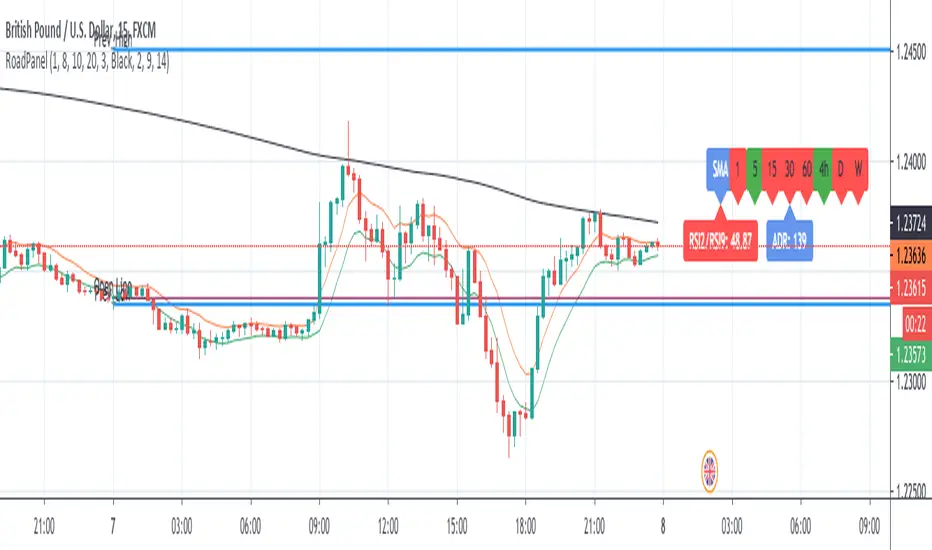
RoadMap PanelThis study is usefull for who follows the rules of "Laura's RoadMap" trading strategy.
If someone doesn't know what I'm talking about, google it because I cannot post link here.
It could be used for scaliping too.
Basically, the rules are:
- Open only in direction of Multitimeframe SMA200
- EMA high/low channel shall be above(buy) or below (Sell) SMA200
- RSI2/RSI9 shall be above(buy) or below (sell) 50
- Look at ADR, last day high/low, daily open for possible supports/resistance.
Next improvement (only to whom is interested to this script and follows me): ADR, last day high/low, daily open to be added to this study.
Next improvement (only to whom is interested to this script and follows me): Alerts to be added.
Please use comment section for any feedback.
********************************** IMPORTANT********************************************************************
I have developed an expert advisor for metatrader4 (MT4) with good results in 2019-April 2020
*********************************************************************************************************************
This study is free to use but code is private. If you like or have question please use comment section.
Check also my other scripts at www.tradingview.com
Thanks for your feedbaks.
Fixed Percent Stop Loss & Take Profit % - For Study Scripts===========
Fixed Percent Stop Loss & Take Profit % - { FOR STUDY SCRIPTS! }
===========
A neat example of how to set up Fixed Stops and Take Profit as a percent of the entry price - This is for setting Alerts within your own Study Script for when either your SL or TP get hit.
Yup, that's about it!
You can ignore the actual entry/exit orders - they're based on a simple MA cross and are therefore NOT relevant, NOT profitable and NOT recommended!
You should be using this code as a way of adding Stops and Takes to your own scripts - hope it helps!
Set your "Open Long/Short" Alerts to be triggered "Once per Bar Close" - Set your "SL/TP" Alerts to trigger "Once per Bar".
--
We wrote this with a bit of a rush on! ~ If you spot any mistakes/bugs just let us know and we'll get round to them asap!
-----------
Good Luck and Happy Trading!

SMA Cross strategyThis is a simple strategy which is always profitable and trades better than most premium channels and I give it out for free :)
Working very good on ETHUSDT futures on binance :)

Scalping rubicointThe scalping strategy is very common in currency trading, since Forex is a market that generally presents very clear trends in very short periods of time. There are different indicators for scalping, such as the RSI (relative strength) or the investment volume, the important thing is to choose one and apply it correctly. An example of a one-minute scalping strategy is buying 20,000 euros in EUR / USD when the currency pair is trending upwards (such as + 0.33%). Since it is relatively rare for the trend to reverse in one minute, the trader following this Forex scalping trend would sell them after one minute. Typically at the end of the sale of the currency is that the investor will earn a margin close to + 0.33% for the total value of the investment.
